Warning: mkdir(): Permission denied in /home/virtual/lib/view_data.php on line 81

Warning: fopen(upload/ip_log/ip_log_2024-09.txt): failed to open stream: No such file or directory in /home/virtual/lib/view_data.php on line 83

Warning: fwrite() expects parameter 1 to be resource, boolean given in /home/virtual/lib/view_data.php on line 84
Nutritional Status and Eating Behavior of Lactating Women in Daejeon

Nutritional Status and Eating Behavior of Lactating Women in Daejeon

Article information

Korean J Community Nutr. 2011;16(1):37-50
Publication date (electronic) : 2011 February 28
doi : https://doi.org/10.5720/kjcn.2011.16.1.37
Departments of Consumers' Life Information, Chungnam National University, Daejeon, Korea.
1Department of Food and Nutrition, Chungnam National University, Daejeon, Korea.
Corresponding author: Joung-Won Lee, Departments of Consumers' Life Information, Chungnam National University, 99 Dahak-ro, Yuseong-gu, Daejeon 305-764, Republic of Korea. Tel: (042) 821-6844, Fax: (042) 821-8887, leejw@cnu.ac.kr
Received 2011 January 04; Revised 2011 February 01; Accepted 2011 February 07.

Abstract

Nutrients intake status of 73 lactating women, that is 45 breast feeding (BF), 13 formula feeding (FF) and 15 mixed feeding (MF), living in Daejeon was investigated. Self-recorded food intakes for two weekdays and eating behaviors using questionnaires were surveyed from May to August 2008. Subjects aged 29.2 ± 3.4 years and their infants aged 8.2 ± 3.2 months. Body mass index of the subjects was 21.0 ± 3.2. Of the subjects 23.3% were employed. Daily energy intake was 1953 ± 391 kcal. Mean adequacy ratio (MAR) was 0.77 ± 0.14 and was higher in FF (0.86 ± 0.13) than in BF (0.76 ± 0.11) and MF (0.72 ± 0.18). Nutrients that over 50% of the subjects took less than estimated average requirement were vitamin A, riboflavin, folate, vitamin C and calcium. And index of nutritional qualities of those 5 nutrients were below one Forty six and sixths percent (46.6%) of the subjects showed GMFVD = 11111 pattern of five food group intakes and 57.5% took meals three times daily, 56.2% skipped often breakfast, and 64.4% dined out two times and more per week. Subjects having lower MAR (< 0.72, n = 24), compared with those having higher MAR (≥ 0.83, n = 24), showed more skipping daily meals and less frequency of eating-out, and took less legumes, vegetables, fishes, and milk. As the results, intakes of calcium, vitamin A, riboflavin, folate, and vitamin C were insufficient in lactating women, especially in BF and MF mothers. Meal skipping and low intakes of dairy foods, legumes, vegetables, and fishes might have adverse influences on nutritional status of lactating women. Accordingly, nutrition care program for lactating women should be focused on intake of three meals daily and a variety of food.

References

1. Ahn BRM. Comparison among the interest of weight control, health related factors and dietary habits according to the obese index in female college students 2005. Wonkwang University; MS thesis.
2. Ahn HS. Nutritional intake levels of Korean infants. Korean J Community Nutr 1999. 4(4)610–622.
3. Ahn HS, Bai HS, Kim SY. Research on biological and sociobehavioral factors affecting determinants of breast feeding duration. Korean J Nutr 1995. 28(4)331–344.
4. Butte NF, Garza C, Stuff JE, O'Brian SE, Nichols BL. Effects of maternal diet and body composition on lactational performance. Am J Clin Nutr 1984. 39296–306.
5. Chang NS, Kang MH, Paik HY, Kim IH, Choi YW, Park SC, Shin YW. Serum folate and iron levels of pregnant, lactating, and non-pregnant, non-lactating women. Korean J Nutr 1993. 26(1)67–75.
6. Choi KS, Lee HJ. A study on knowledges and attitudes about breast milk feeding and needs for breast milk feeding education among high school students. Korean J Community Nutr 2006. 11(2)191–204.
7. Choi MH, Moon SJ, Ahn HS. An ecological study of changes in components of human milk during the breast feeding and the relationships between the dietary behavior of lactating women and the growth of breast-fed Infants. Korean J Nutr 1991. 24(2)77–86.
8. Choi MG, Ahn HS. Influence of matemal diet on mineral and trace element contents of human milk and relationships between level of these milk constituents. Korean J Nutr 1993. 26(6)772–782.
9. Hwang HS, Lee JS. A study of teacher's breakfast behavior and ideal breakfast types. Korean J Community Nutr 1999. 4(4)575–586.
10. Hyun WJ, Song KH, Choi MK, Son SM. Food energy and nutrient composition table easy to understand 2007. Seoul: Kyomunsa;
11. Jeon HS, Hong SY. A study of factors affecting status and method of infant feeding in Incheon. Korean J Community Nutr 1996. 1(3)433–440.
12. Kant AK, Schatzkin A, Ziegler RG, Nestle M. Dietary diversity in the US population NHANES II. 1976~1980. J Am Diet Assoc 1991. 911526–1531.
13. Kim WJ, Ahn HS, Chung EJ. Mineral intakes and serum mineral concentrations of the pregnant and lactating women. Korean J Community Nutr 2005. 10(1)59–69.
14. Kim KN, Hyun TS, Kang NM. A survey on the feeding practices of women for the development of a breast-feeding education program: Breast feeding knowledge and breast feeding rates. Korean J Community Nutr 2002. 7(3)345–353.
15. Koo JY, Lee JW, Choi YS, Kim JH, Lee JH. Nutrition throughout the life cycle 2006. Seoul: Hyoil Co.;
16. Korea Dietetic Association. Food weights by eye measurement and food pictures 1999.
17. Korean Society of Community Nutrition. Questionnaires for surveying dietary life 2000.
18. Lee JS, Choi KS, Kim ES. Changes on milk production of lactating women in Kwangwon province during lactation. Korean J Nutr 1996. 29(10)1105–1111.
19. Lee GJ, Moon SJ, Lee MJ, Ahn HS. Postpartum changes in maternal diet, body fat and anthropometric measurements in lactating vs non-lactating women. Korean J Nutr 1993. 26(1)76–88.
20. Lee JA, Huh YR, Lee JI, Lim HS. Composition and yield of Korean breast milk and maternal intakes of foods and nutrients. Korean J Nutr 1994. 27(8)795–804.
21. Lee JW, Lee MS, Kim JH, Son SM, Lee BS. Nutritional assessment 2006. Seoul: Kyomunsa;
22. Lee SI, Choi HM. Nutrition for infants and children 2002. Seoul: Kyomunsa;
23. Lee YK, Sung CJ, Choi MK, Lee YS. Effects of sodium intakes on blood pressure and blood parameters in Korean normal adult women. Korean J Nutr 2002. 35(7)754–762.
24. Feeley RM, Eitenmiller RR, Jones JB, Barnhart H. Calcium phosphorus and magnesium contents of human milk during early lactation. J Pediatr Gastroenterol Nutr 1983. 2262–267.
25. Ministry of Health and Welfare, Korea Health Industry Development Institute. Report on 2005 National Health and Nutrition Survey : Nutrition Survey(1) 2006.
26. Moon SJ, Kang JS, Lee MJ, Lee JH, Ahn HS. A longitudinal study of macro-mineral concentrations in human milk. Korean J Nutr 1993. 26(9)1098–1109.
27. Moon HK, Kim EG. Nutrient and food intake of Koreans by the economic status and meal pattern using 1998 Korean national health examination nutrition survey. Korean J Nutr 2004. 37(3)236–250.
28. Nam KS. How to use SPSS for statistical analysis 2007. Seoul: Chayou Academy;
29. Ngoan LT, Mizoue T, Fujino Y, Tokui N, Yoshimura T. Dietary factors and stomach cancer mortality. Br J Cancer 2002. 87(1)37–42.
30. Ro HK. Infant feeding practices in Kwangju area. J Korean Soc Food Nutr 1994. 23(1)48–54.
31. Rural Development Administration and Korean Society of Community Nutrition. Food composition tables easy to understand for consumers 2003.
32. Takeda Y, Yoneda T, Demura M, Furukawa K. Effects of high sodium intake on cardiovascular aldosterone synthesis in stroke-prone spontaneously hypertensive rats. J Hypertens 2001. 19(3)635–639.
33. The Korean Nutrition Society. Dietary reference intakes for Koreans 2005.
34. Wang SK, Kim JH. A study on infant feeding and weaning practice in Taejon. Korean J Community Nutr 1999. 4(4)489–495.
35. Worthington-Roberts BS, Williams SR. Nutrition in pregnancy and lactation 1989. St Louis: CV Mosby Co.;
36. Yoon JS, Chang HK, Park JA. A study on calcium and iron status of lactating women. Korean J Nutr 2005. 38(6)475–486.

Article information Continued

Fig. 1

Percentage distribution of energy and some nutrient daily intakes into three meals, snack, and dietary supplements.

Breast: breast feeding Formula: formula feeding Mixed: mixed feeding

B: breakfast L: lunch D: dinner S: snack DS: dietary supplements

Fig. 2

Mean adequacy ratios(MAR) of the subjects. p = 0.014 by ANOVA, and MAR with alphabet 'b' was higher than those with 'a' at p < 0.05 by LSD

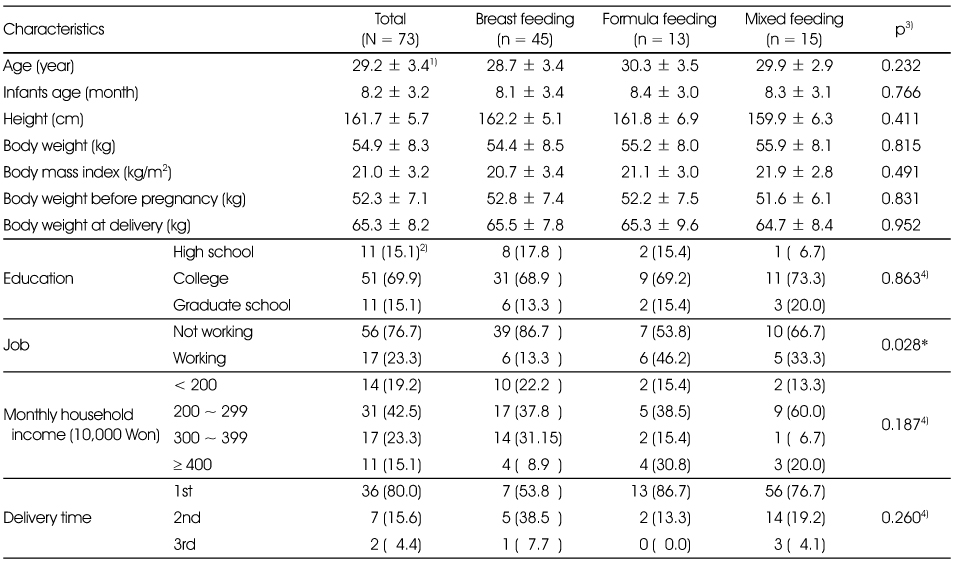
Table 1

General characteristics of the subjects

Table 1

1) Mean ± SD, 2) N (%), 3) by ANOVA and χ2-test *: p < 0.05, 4) Subject number of one cell and more was below 5 in the variable

Table 2

Energy, protein and lipid intakes by milk feeding type

Table 2

1) Mean ± SD, 2) Mean, 3) EER %, 4) AI %, 5) by ANOVA, *: p < 0.05, **: p < 0.01, ***: p < 0.001

abc: Values with different superscripts were significantly different at p < 0.05 by LSD

P/M/S = poly unsaturated fatty acid / mono unsaturated fatty acid / saturated fatty acid

Table 3

Mineral and vitamin intakes by milk feeding type

Table 3

1) Mean ± SD, 2) Mean, 3) Goal value %, 4) AI %, 5) by ANOVA, *: p < 0.05 **: p < 0.01 ***: p < 0.001

ab: Values with different superscripts were significantly different at p < .05 by LSD

Table 4

Proportion of the subjects took nutrients less than EAR and unacceptable macronutrient distribution ranges

Table 4

1) N (%), 2) by χ2 test, 3) All variables except 'Vitamin C' had one cell or more with the subject number below 5.

4) Acceptable macronutrient distribution ranges (carbohydrate : protein : lipid = 55 ~ 70 : 7 ~ 20 : 15 ~ 25)

Table 5

Index of nutritional quality(INQ) by milk feeding type

Table 5

1) Mean ± SD, 2) by ANOVA, *: p < 0.05 **: p < 0.01 ***: p < 0.001

ab: Values with different superscripts were significantly different at p < 0.05 by LSD

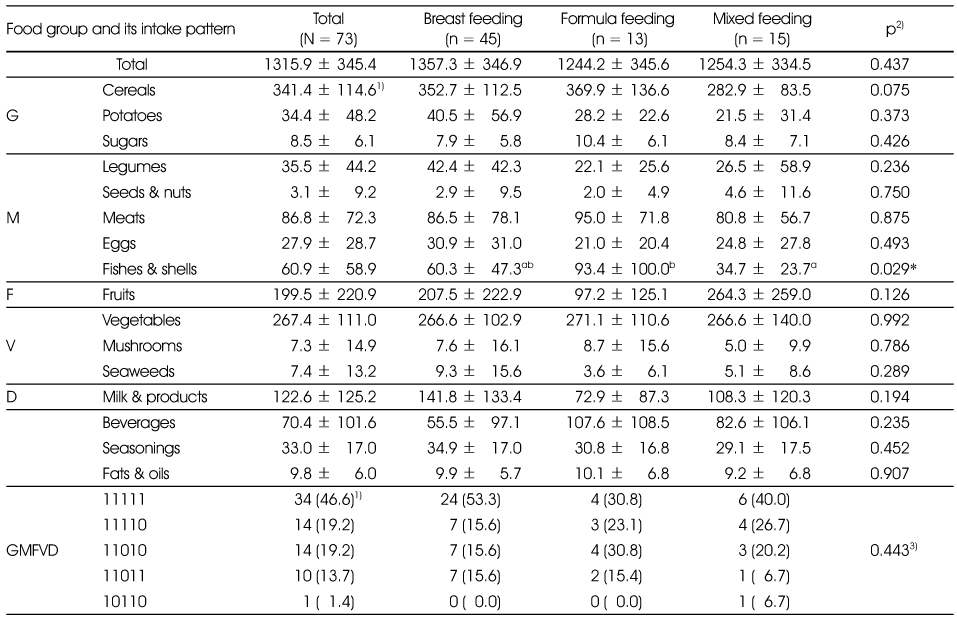
Table 6

Food intakes and food group intake pattern by milk feeding type

Table 6

1) Mean ± SD, 2) by ANOVA, *: p < 0.05

ab: Values with different superscripts were significantly different at p < 0.05 by LSD

3) Subject number of 10 cells were below 5

GMFVD: grain, meat, fruit, vegetable, dairy product

Table 7

Dietary behavior and weight reducing trial by feeding type

Table 7

1) N (%), 2) χ2 test, 3) Among subjects who did weight control trial to reduce weight

4) Subject number of one cell or more was below 5 in the variable

Table 8

Comparison of food group intakes and its patterns between the subjects with MAR < 0.72 and those with MAR ≥ 0.831)

Table 8

1) MAR ≥ 0.83: 100th~68th percentile, MAR < 0.72: 33th~0th percentile, 2) Mean ± SD, 3) by t-test

GMFVD: grain, meat, fruit, vegetable, dairy product, *: p < 0.05, **: p < 0.01, ***: p < 0.001

4) Subject number of 5 cells were below 5

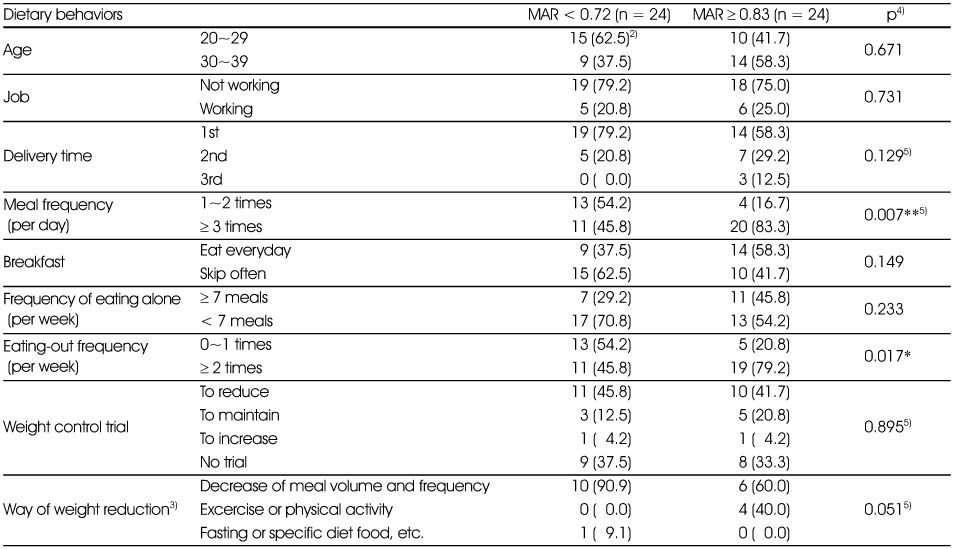
Table 9

Comparison of dietary behaviors between the subjects with MAR < 0.72 and those with MAR ≥ 0.831)

Table 9

1) MAR ≥ 0.83: 100th~68th percentile, MAR < 0.72: 33th~0th percentile

2) N (%), 3) Among subjects who did weight control trial to reduce weight

4) χ2 test, *: p < 0.05, **: p < 0.01, 5) Subject number of one cell or more was below 5 in the variable