Analysis of health behavior changes among residents in depopulation areas in Korea: a cross-sectional study based on Community Health Survey data from 2010 to 2019
Article information

Abstract
Objectives
The total population of Korea began to decline in 2019; in particular, the population in rural areas has been rapidly decreasing and is aging. Therefore, the government has designated depopulation areas and is seeking ways to support them. In this study, we determined that observing whether health gaps occurred due to population decline in local areas was necessary. Therefore, we attempted to examine changes in health behavior in depopulation areas in a time series manner using Community Health Survey data.
Methods
The analysis used Community Health Survey data from 2010 to 2019, and regional classification was divided by depopulation areas designated by the Ministry of the Interior and Safety. Trends in health behavior and chronic disease prevalence between depopulation and non-depopulation areas were analyzed. All analyses were conducted using complex sample analysis procedures in SAS 9.4 software.
Results
The smoking rate steadily decreased in both depopulation and non-depopulation areas, whereas the high-risk drinking rate increased slightly. The walking practice rate did not improve in depopulation areas compared to non-depopulation areas. Furthermore, nutritional labeling usage rate was consistently lower in depopulation areas than in non-depopulation areas, with the gap being the largest. The prevalence of obesity, diabetes, and hypertension showed that the gap between depopulation and non-depopulation areas is continuously increasing.
Conclusions
Health behaviors in depopulation areas have not improved, and the prevalence of chronic diseases is increasing rapidly. Therefore, the demand for health care services that support healthy lifestyle practices and chronic disease management in these areas is expected to increase.
INTRODUCTION
Korea has been experiencing rapid population aging and regional population decline due to a sharp decrease in birth rates. In response, the government designated 89 regions as depopulation areas under the Special Act on Balanced National Development in an effort to prevent regional extinction and ensure socio-economic vitality in these areas [1]. Although the national population started to decline in 2019, depopulation areas have been experiencing continuous decline for about 20 years [2]. This decline is attributed more to social factors, such as population migration due to industrial changes, rather than natural factors, like a decrease in birth rates. Depopulation areas face a shortage of socio-economic resources, leading to reduced local tax revenues, weakened financial investments, and subsequently deteriorating quality of life and living conditions for residents.
Currently, depopulation areas have higher proportions of elderly and vulnerable populations, fewer public sports facilities, medical facilities, and national and public childcare facilities, and higher mortality and suicide rates [3]. These regions also suffer from weakened functions of institutions providing essential services like healthcare and welfare, which are considered crucial for living conditions. A study using the 2020 Community Health Survey data examined the demographic and socio-economic characteristics of depopulation and non-depopulation areas, and analyzed differences in key health indicators. It found that depopulation areas had higher proportions of elderly people and non-professional/non-office workers, lower education levels and household incomes, and poorer outcomes in walking practice rates, hypertension treatment rates (for those aged 30 and above), and annual unmet medical care rates compared to non-depopulation areas [4].
Recent studies examining regional health disparities in South Korea have primarily focused on comparisons between urban and rural areas [5-9] or between the metropolitan area and non-metropolitan areas [10-12]. However, the regional disparities in South Korea cannot be fully explained by traditional urban-rural categories alone. Even small and medium-sized cities outside the metropolitan area are concerned about population decline, indicating the need for a categorization that considers these regional characteristics.
Therefore, this study aims to analyze and compare health behaviors and the prevalence of chronic diseases such as hypertension and diabetes in depopulation and non-depopulation areas using long-term data from the Community Health Survey. It seeks to observe whether the health disparities have changed due to the persistent population decline over the past decade.
METHODS
Ethics statement
Among the data from the 2010–2019 Community Health Survey used in this study, the data from 2010 to 2016 were collected after obtaining approval from the Institutional Review Board (IRB) of the Korea Disease Control and Prevention Agency (KDCA) (IRB No. 2010-02CON-22-P, 2011-05CON-04_C, 2012-07CON-01-2C, 2013-06EXP-01-3C, 2014-08EXP-01-3C, 2014-08EXP-09-4C-A, 2016-10-01-P-A), and data for 2017, 2018, and 2019 were collected after being exempted from deliberation by the IRB of the KDCA.
1. Survey data
The survey data used for this study are from the Community Health Survey, conducted annually at the city, county, and district levels by the KDCA under Article 4 of the Regional Health Act and Article 2 of the Enforcement Decree of the same Act since 2008. For analysis, data from 2010 to 2019 were integrated, excluding the COVID-19 pandemic period, resulting in a total of 1,826,491 data points. Depopulation and non-depopulation areas were classified based on the designation of depopulation areas by the Minister of the Interior and Safety in 2021, according to the Special Act on Balanced National Development (Notification No. 2021-66, October 19, 2021). As of 2019, 89 out of 255 regions with public health centers and health clinics were designated as depopulation areas (Figure 1).
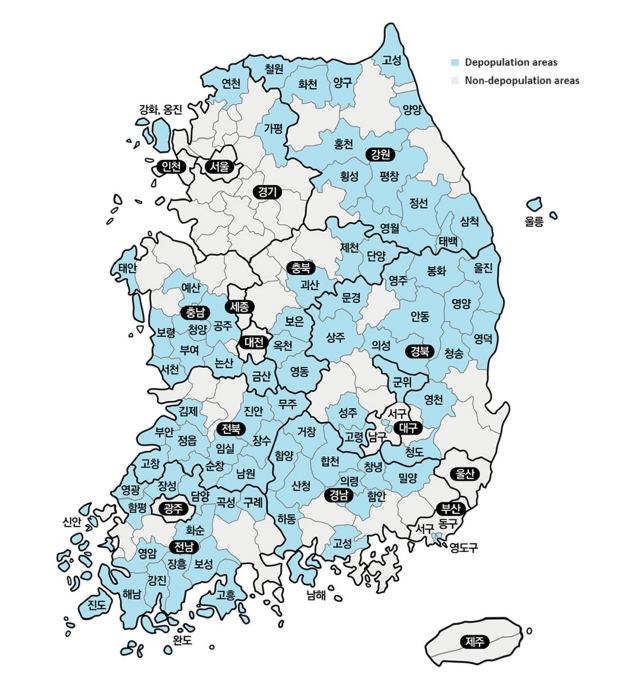
Distribution of depopulation and non-depopulation areas.
2. Analysis methods
To observe the population characteristics and health behaviors of depopulation and non-depopulation areas from 2010 to 2020, available data from the Community Health Survey were used, including indicators such as age, sex, education level, and health behaviors (smoking rate, high-risk drinking rate, moderate physical activity rate, walking practice rate, and nutritional labeling usage rate) and disease prevalence rates (obesity, hypertension, and diabetes). Descriptive statistical analyses and year-by-year trend analyses were conducted. Changes in health behaviors and disease prevalence between depopulation and non-depopulation areas were analyzed after adjusting for sex, age, and education level. Statistical analyses were performed using SAS version 9.4 (SAS Institute Inc.), employing complex sample analysis procedures (proc surveymeans, proc surveyfreq, proc surveylogistics).
RESULTS
1. Population characteristics of depopulation and non-depopulation areas
Analysis of the distribution of data by sex, age, and education level from the Community Health Survey from 2010 to 2019 revealed that depopulation areas had higher proportions of women and elderly people compared to non-depopulation areas. In particular, depopulation areas had lower proportions of individuals under 40 years old and higher proportions of those aged 50 and above. Additionally, depopulation areas had higher proportions of individuals with lower education levels, with more than half having an education level of middle school or below. While there were significant differences in the distribution of subjects by sex between depopulation and non-depopulation areas from 2010 to 2014, no significant differences were observed from 2015 onwards. However, significant differences in age and education level distribution persisted (Table 1).

Characteristics of distribution of subjects between depopulation and non-depopulation areas
2. Health behavior trends in depopulation and non-depopulation areas
The smoking rate was lower in depopulation areas compared to non-depopulation areas. In depopulation areas, the smoking rate steadily decreased from 23.0% in 2010 to 18.1% in 2019, while in non-depopulation areas, it decreased from 24.6% in 2010 to 19.0% in 2019. The odds ratio for the increase in years was 0.964, indicating a similar decreasing trend in both areas.
The high-risk drinking rate was lower in depopulation areas compared to non-depopulation areas until 2012, but became higher in depopulation areas from 2013 onwards. In depopulation areas, the high-risk drinking rate increased from 14.8% in 2010 to 19.1% in 2019, while in non-depopulation areas, it increased from 15.9% in 2010 to 18.0% in 2019, with a smaller increase in depopulation areas. The odds ratio for high-risk drinking with the increase in years was 1.037 (1.032–1.042) in depopulation areas and 1.015 (1.013–1.018) in non-depopulation areas, indicating a higher increasing trend in high-risk drinking rates in depopulation areas.
The moderate physical activity rate was higher in depopulation areas compared to non-depopulation areas. In depopulation areas, the rate remained almost unchanged from 27.0% in 2010 to 26.0% in 2019, while in non-depopulation areas, it increased from 20.9% in 2010 to 23.7% in 2019. The odds ratio for moderate physical activity with the increase in years was 0.990 (0.985–0.995) in depopulation areas and 1.022 (1.020–1.024) in non-depopulation areas, indicating a decreasing trend in moderate physical activity rates in depopulation areas and an increasing trend in non-depopulation areas.
The walking practice rate was higher in depopulation areas until 2013, after which it became higher in non-depopulation areas. In depopulation areas, the rate significantly decreased from 86.6% in 2010 to 79.9% in 2019, while in non-depopulation areas, it slightly increased from 82.5% in 2010 to 84.0% in 2019. The odds ratio for walking practice with the increase in years was 0.952 (0.947–0.958) in depopulation areas, showing a decreasing trend, and 1.022 (1.019–1.024) in non-depopulation areas, showing an increasing trend.
The utilization rate of nutritional labeling showed the greatest difference between non-depopulation and depopulation areas among the health behavior indicators, with about a 10% difference between the two areas throughout the decade. The utilization rate of nutritional labeling decreased, falling from 24.0% in 2010 to 14.0% in 2018 in depopulation areas before rising to 19.0% in 2019. Similarly, in non-depopulation areas, it decreased from 34.4% in 2010 to 25.2% in 2018, before recovering to 29.1% in 2019. The odds ratio for nutritional labeling utilization with the increase in years was 0.935 (0.930–0.940) in depopulation areas and 0.942 (0.940–0.944) in non-depopulation areas, indicating a more pronounced decreasing trend in depopulation areas (Tables 2 and 3).

Health behavior practice trends between depopulation and non-depopulation areas

ORs for health behavior practice between depopulation and non-depopulation areas
3. Disease prevalence trends in depopulation and non-depopulation areas
There was no difference in obesity rates between depopulation and non-depopulation areas in 2010, with rates of 22.2% and 22.4%, respectively. However, by 2012, the obesity rate in depopulation areas surpassed that of non-depopulation areas, reaching 32.0% in 2018 compared to 30.4% in non-depopulation areas (Figure 2). The odds ratio for obesity with the increase in years was 1.062 (1.058–1.066) in depopulation areas and 1.049 (1.047–1.051) in non-depopulation areas, indicating an increasing trend in both areas, but a more significant increase in depopulation areas.
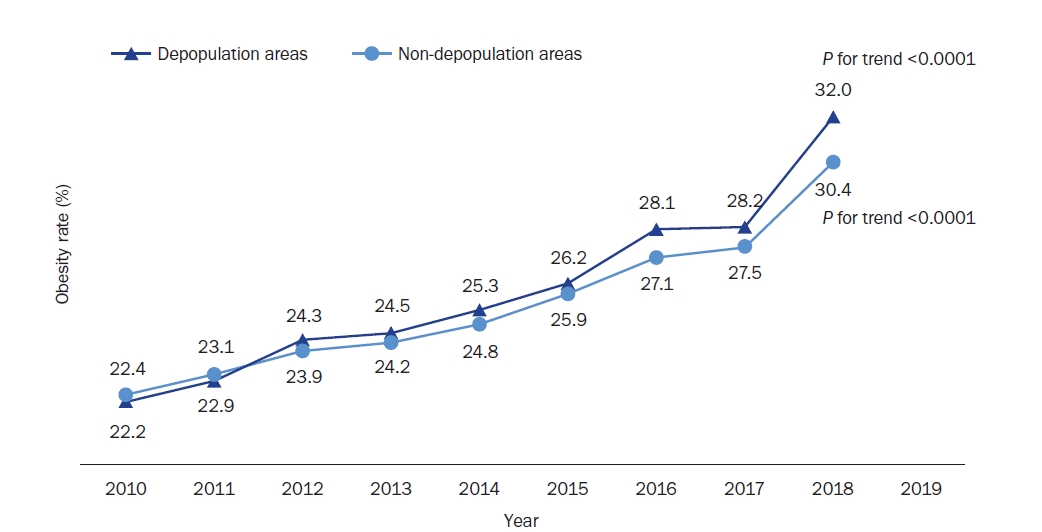
Obesity rate trends between depopulation and non-depopulation areas.
Obesity rate by region type was measured as a percentage of complex sampling design effect and appropriate sampling weights of the national survey using the SURVEYFREQ procedure in the SAS program.
P for trend adjusted for sex, age and education level from PROC SURVEYLOGISTIC procedures.
The prevalence of diabetes remained consistently higher in depopulation areas compared to non-depopulation areas, with both areas showing a continuous rise. In depopulation areas, the prevalence of diabetes increased from 8.7% in 2010 to 12.6% in 2019, an increase of approximately 3.9%. In non-depopulation areas, the prevalence rose from 6.1% in 2010 to 8.4% in 2019, an increase of about 2.3% (Figure 3). The odds ratio for diabetes with the increase in years was 1.037 (1.034–1.041) in depopulation areas and 1.020 (1.018–1.023) in non-depopulation areas, indicating an increasing trend in both areas but a larger increase in depopulation areas.
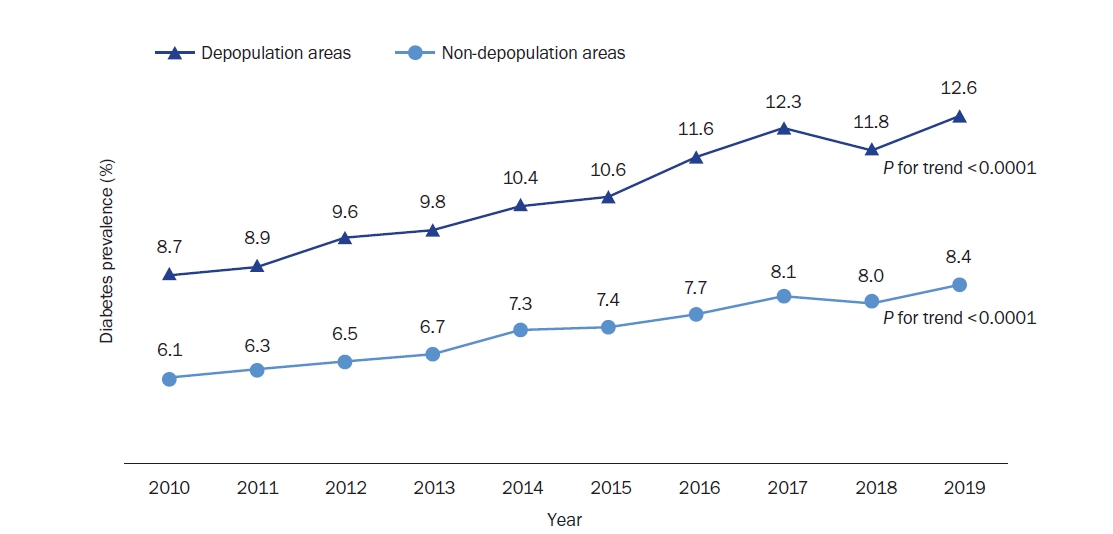
Diabetes prevalence trends between depopulation and non-depopulation areas.
Diabetes prevalence by region type was measured as a percentage of complex sampling design effect and appropriate sampling weights of the national survey, using the SURVEYFREQ procedure in the SAS program.
P for trend adjusted for sex, age and education level from PROC SURVEYLOGISTIC procedures.
Similarly, the prevalence of hypertension showed a continuous increase in both areas, with depopulation areas experiencing a more significant rise. In these areas, the prevalence of hypertension increased from 23.5% in 2010 to 31.9% in 2019, an increase of approximately 8.4%. In non-depopulation areas, the prevalence rose from 15.9% in 2010 to 20.2% in 2019, an increase of about 4.3%, indicating that the increase in depopulation areas was roughly double that in non-depopulation areas (Figure 4). The odds ratio for hypertension with the increase in years was 1.032 (1.029–1.035) in depopulation areas and 1.009 (1.007–1.011) in non-depopulation areas, showing an increasing trend in both areas but a more pronounced increase in depopulation areas. From 2010 to 2019, obesity rates, diabetes prevalence, and hypertension prevalence all increased in both depopulation and non-depopulation areas. However, the increase was more substantial in depopulation areas, leading to a widening gap between the two regions (Table 4, Figures 2-4).
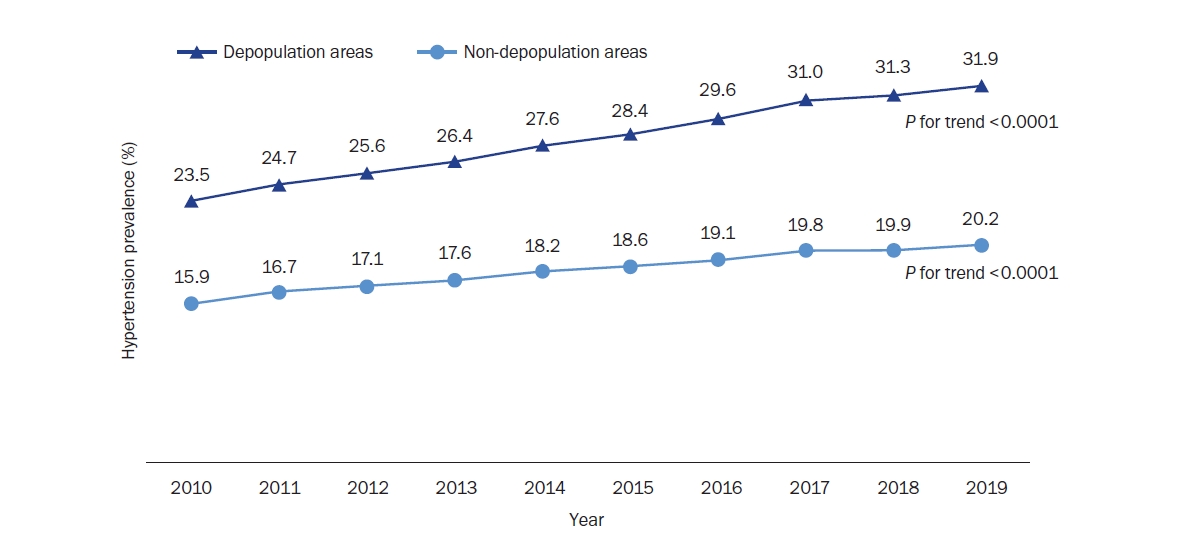
Hypertension prevalence trends between depopulation and non-depopulation areas.
Hypertension prevalence by region type was measured as a percentage of the complex sampling design effect and appropriate sampling weights of the national survey using the SURVEYFREQ procedure in the SAS program.
P for trend adjusted for sex, age and education level from PROC SURVEYLOGISTIC procedures.

ORs for chronic disease between depopulation and non-depopulation areas
DISCUSSION
A study investigating the population change in depopulating areas found that from 2010 to 2020, the proportion of young people in these areas decreased more significantly, while the proportion of elderly people increased more sharply compared to non-depopulating areas [13]. This has raised concerns about the deepening polarization of the population structure between depopulating and non-depopulating areas. Our study also confirmed that depopulating areas have higher proportions of elderly and low-education populations. Out of 89 depopulating areas, 85 were in non-metropolitan regions. Referring to a study indicating that the proportion of elderly single-person households is increasing significantly more in rural areas compared to urban areas [14], it is anticipated that the proportion of elderly single-person households would also be high in our study's depopulating areas.
The results of this study show that in depopulating areas, health behavior indicators related to health risks, such as smoking rates, were lower compared to non-depopulating areas. However, active health-promoting behaviors, such as moderate physical activity, walking practice, and nutritional labeling usage, were lower. Particularly, while the rates of moderate physical activity and walking practice improved in non-depopulating areas due to increased health awareness, these rates decreased in depopulating areas. This aligns with the results from the National Health Promotion Comprehensive Plan [15], which showed a decline in aerobic physical activity practice in certain areas. Given that regional disparities were calculated using the absolute difference in indicators, it is difficult to capture the changes due to the reversal phenomenon between regions, as observed in our study.
Additionally, the prevalence of diabetes and hypertension increased more sharply in depopulating areas. This can be interpreted as a health disparity resulting from differences in healthcare service benefits, as suggested by a study reporting that diabetes patients in depopulating areas receive less diabetes management education and fewer complication screenings compared to those in non-depopulating areas [16]. The high prevalence of diabetes and hypertension in depopulating areas suggests a high demand for health-promoting healthcare services. With most elderly individuals having at least one chronic disease [17], managing chronic diseases inevitably increases with the rising elderly population, highlighting the need to supplement healthcare services in these depopulating areas.
A study on the elderly in rural areas of South Korea found a significant association between inconvenient transportation and unmet medical needs [18], indicating that the characteristics of depopulating areas are closely linked to transportation and geographical factors [19]. Therefore, policy efforts to improve access to health-promoting healthcare services in these areas are crucial.
The “Special Act on Support for Depopulating Areas 2022” was enacted to provide a legal basis for effective responses to population decline and regional extinction, led by local regions with national administrative and financial support [20]. Although this special act allows for special support for depopulating areas, various amendments have been proposed to increase the law's effectiveness. These amendments include support for education (proposed by Representative Seo Dong-young in February 2023), childcare (proposed by Representative Lee Gae-ho in November 2022), foreign resident policies (proposed by Representative Lim Yi-ja in December 2022), cultural facilities (proposed by Representative Kim Hyung-dong in January 2023), and lifestyle population and relationship population (proposed by Representative Choi Hyung-doo in April 2023). However, these discussions have yet to include support for healthcare services that aid health-promoting behaviors in depopulating areas [21].
While various factors exacerbate regional health inequalities, merely allocating resources and support may not suffice to mitigate these inequalities [22]. Nevertheless, without substantial investment to enhance access to healthcare services, especially as individual capabilities diminish due to aging, health disparities will likely widen. Given that healthcare services supporting health-promoting behaviors are often publicly funded in rural areas, it is essential to secure stable public personnel and resources. Recent strategies to revitalize depopulating areas consider lifestyle population perspectives across various policy fields, such as culture, arts, and transportation [23]. In healthcare, utilizing healthcare professionals to support health-promoting behaviors should be actively reviewed from a lifestyle population perspective to effectively enhance the health of local residents in depopulating areas.
CONCLUSIONS
This study observed changes in health behaviors and disease prevalence in depopulation and non-depopulation areas using Community Health Survey data. However, due to the limitations of the data, the causes of these changes could not be fully identified. To effectively address the issues of population decline and regional extinction, as intended by the “Special Act on Support for Depopulating Areas,” multidimensional analyses that include various socio-economic and geographical factors, in addition to the Community Health Survey data, are necessary to provide policy implications for enhancing regional health capabilities and addressing health disparities.
Notes
Conflict of Interest
There are no financial or other issues that might lead to conflict of interest.
Funding
This study was performed with financial support from the Korea Disease Control and Prevention Agency in 2023.
Data Availability
Data sharing is not applicable to this article as no new data were created or analyzed in this study.