Sex differences in health-related quality of life among older Korean adults with type 2 diabetes mellitus: a cross-sectional study
Article information

Abstract
Objectives
This cross-sectional study examined sex differences in Health-Related Quality of Life (HRQoL) among seniors with Type 2 Diabetes Mellitus (T2DM).
Methods
Data from the Korea National Health and Nutrition Examination Survey (2008–2020) were analyzed. The EuroQol-5 Dimensions (EQ-5D), a measure of HRQoL, was used. It comprises five dimensions: mobility, self-care, usual activity, pain/discomfort, and anxiety/depression, each with three levels.
Results
Analysis of 3,826 older adults with T2DM showed a significant increasing trend in the EQ-5D Index from the 4th survey phase onwards (P for trend < 0.001 for both men and women). Men consistently reported higher EQ-5D levels than women across all survey years. Women’s EQ-5D levels remained lower than men’s, maintaining a decade-old disparity (P < 0.05). Men scored significantly higher (P < 0.05) in most EQ-5D domains, except for self-care and anxiety/depression, resulting in a higher total EQ-5D Index (P = 0.001). Increased comorbidities were strongly associated with lower EQ-5D levels in both sexes. Additionally, there was a negative correlation between the EQ-5D Index and refined grain intake for both sexes (P for trend < 0.001), with high-EQ-5D groups consuming fewer refined grains. Women in the high-EQ-5D group consumed more nuts, vegetables, and meat compared to men (P for trend < 0.05).
Conclusions
Our study highlights the sex disparities in HRQoL among older adults with T2DM. The findings suggest the need for tailored treatment guidelines aimed at improving the HRQoL of elderly T2DM patients, with a focus on their sex-specific characteristics. Implementing these tailored guidelines could enhance the HRQoL of older women with T2DM and promote more equitable healthcare outcomes. This underscores the importance of considering sex differences to comprehensively improve the well-being of this population.
INTRODUCTION
Health-Related Quality of Life (HRQoL) is closely related to an individual’s health status [1] and represents a multidimensional assessment of the impact of illness and treatment on Quality of Life (QoL) [2]. HRQoL indicates how individuals perceive and experience health across the physical, psychological, and social dimensions [3]. In 2020, overall life expectancy in South Korea was 83.5 years, with a healthy life expectancy of 66.3 years, indicating that people lived with illness for approximately 15 years [4]. The growing gap between life expectancy and healthy life expectancy underscores the increasing focus on disease management and QoL in the elderly population. This shift emphasizes the need for a qualitative approach to life in an aging society [1,2]. The growing emphasis on HRQoL in academic research [3] is reflected its use in healthcare policies, service evaluation, clinical research, and patient counseling [5], with recent studies stressing the importance of HRQoL measurements alongside clinical indicators for patients with chronic diseases [6].
Diabetes, a chronic condition with high global prevalence, requires long-term consistent management [7,8]. Patients must maintain blood sugar levels, adhere to a regular diet, engage in appropriate exercise, and undergo medication as needed [9]. For the elderly, the complexity of managing diabetes increases because of age-related cognitive and memory decline and directly affects their QoL [10,11]. HRQoL can vary according to individual characteristics including biological, psychological, and social factors, with sex playing a significant role. Differences in the symptoms, management needs, and psychological responses to diabetes between men and women are critical considerations in developing diabetes management and treatment strategies.
A meta-analysis of 18 cross-sectional studies involving 57,109 participants on the QoL of patients with Type 2 Diabetes Mellitus (T2DM) identified factors such as physical activity, frequency of blood sugar checks, and diabetes complications [12]. The QoL tends to decrease with age, and women with diabetes generally have a lower QoL than men [13-15]. This suggests that sex-specific factors should be considered in diabetes management and treatment strategies [16]. While prior research in Korea has focused on working adults aged 30–40 [17], the accelerating global aging of societies highlights the need for more in-depth research on elderly patients, considering both their age and sex. Such research is crucial in developing effective diabetes management strategies and policies in an aging society and ultimately improving the QoL of patients with diabetes. Therefore, further studies focusing on the elderly population with diabetes are necessary, particularly regarding sex-specific QoL factors.
In South Korea, among diabetes-related complications, women predominantly experience cardiovascular and ocular issues such as myocardial infarction, ischemic stroke, heart failure, and diabetic retinopathy [8]. In contrast, men are more prone to renal and oncological complications such as end-stage renal disease and most cancers (excluding breast and renal cancers) resulting from diabetes [8]. These sex-specific complications can diminish the QoL for individuals with diabetes [18]. The QoL for diabetes patients is influenced not only by these physical health issues but also by concerns about hypoglycemic episodes, as well as apprehension about lifestyle changes and long-term consequences [19]. Particularly, women may experience a higher prevalence of mental health issues such as anxiety and depression, further contributing to a decrease in QoL [20].
Proper blood sugar management is crucial in diabetes treatment to prevent complications and maintain a QoL comparable to individuals without diabetes [21]. Blood sugar management requires not only exercise and medication but also dietary therapy to be considered essential. According to randomized clinical trials, there are sex differences in food choices and adherence to nutritional recommendations among diabetes patients [22]. However, research findings suggest that the restrictions and burdens associated with dietary therapy can diminish the enjoyment of meals and decrease the QoL for diabetes patients [21]. Given these complexities, our study focused on comorbidities and dietary habits as they are significant, modifiable factors influencing HRQoL in diabetic populations. Understanding these factors can provide actionable insights for developing sex-specific management strategies.
Furthermore, exploring sex-specific diseases and their distinct impacts on HRQoL can offer deeper insights. Women with diabetes often face unique challenges related to hormonal changes and pregnancy management, while men may deal with complications such as end-stage renal disease and various cancers. Therefore, examining these differences can help in creating more targeted and effective interventions.
Herein, we aimed to analyze and compare HRQoL among elderly patients (≥ 65 years) with T2DM, based on sex, using data from the Korea National Health and Nutrition Examination Survey (KNHANES). This research delved into understanding the specific impact of sex on the daily lives and HRQoL of elderly patients with T2DM, encompassing factors such as comorbidities and dietary habits. The primary hypothesis was that significant differences would be evident in HRQoL levels between elderly men and women with T2DM.
METHODS
Ethics statement
The data used in this study from the KNHANES for 2008–2020 were collected with the consent of all participants. For 2008–2014 and 2018–2020, the research was approved by the Institutional Review Board of Korea Centers for Disease Control and Prevention (approval numbers: 2008-04EXP-01-C, 2009-01CON-03-2C, 2010-02CON-21-C, 2011-02CON-06-C, 2012-01EXP-01-2C, 2013-07CON-03-4C, 2013-12EXP-03-5C, and 2014-12EXP-03-5C). Data for 2015–2017 were exempt from ethical review according to the opinion of the Research Ethics Review Committee of the Korea Disease Control and Prevention Agency [23].
1. Study participants
This study analyzed data from KNHANES [23]. The KNHANES, initiated in 1998 and conducted every 3–4 years, switched to an annual format from 2007 (4th phase, 1st year) for timely national statistics and continued to the 8th phase (2019–2021). The KNHANES includes household health examinations and nutrition surveys [24]. We analyzed integrated raw data from the KNHANES, focusing specifically on the years providing HRQoL information. This includes data from the 4th phase second years (2008) to the 8th phase second years (2020).
Our analysis, covering 2008–2020, involved 108,497 survey participants. The exclusion criteria were as follows: 1) < 65 years of age (87,549 participants); 2) nondiabetic or unaware of their T2DM (16,933); 3) diagnosed with diabetes before age 30 (15); and 4) nonrespondents to the EuroQol-5 Dimensions (EQ-5D) survey (174). Consequently, 3,826 individuals were included in the final analysis (Figure 1).
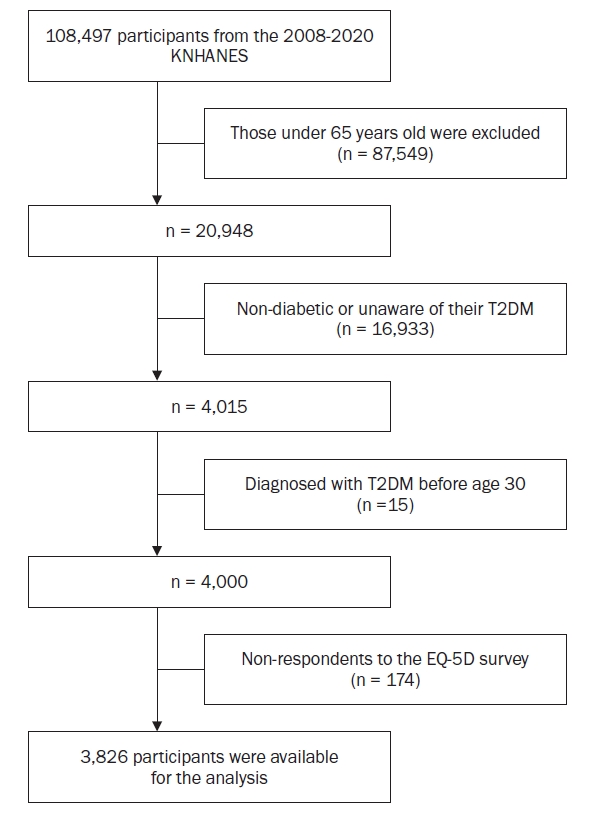
Flow chart showing participant inclusion and exclusion steps
KNHANES, Korea National Health and Nutrition Examination Survey; T2DM, Type 2 Diabetes Mellitus; EQ-5D, EuroQol-5 Dimensions.
2. Demographic and lifestyle factors
Participant age, sex, education level, monthly household income, employment status, household type, physical activity level, smoking status, alcohol consumption, type of diabetes treatment, and duration of diabetes were surveyed using health questionnaires [23]. Health behaviors, such as smoking status and alcohol consumption were self-reported, and trained interviewers collected data on sex, age, education level, physical activity, EQ-5D questionnaires, and disease prevalence [23]. Education was categorized as elementary school or lower, middle school, or high school, or higher. Monthly household income levels were classified based on the tertile thresholds of KNHANES sample households. Employment status was divided into employed, unemployed, and economically inactive. Household types were categorized as living alone, with a spouse, or with relatives. Alcohol consumption was calculated by multiplying the number of serving per sitting and frequency of alcohol consumption in the past year. The body mass index (BMI) was calculated as weight (kg) divided by height (m2). Physical activity levels were determined based on the frequency and duration of high-intensity, moderate-intensity, and walking activities by calculating the metabolic equivalents of tasks (METs-h, metabolic equivalent task-hours per week/week) [25]. Smoking status was classified as nonsmoker, former smoker, or current smoker.
Elderly patients with T2DM were defined as having comorbidities if they had chronic diseases (hypertension, dyslipidemia, stroke, myocardial infarction/angina, renal failure, or cancer) in addition to T2DM. These comorbidities were determined using health questionnaires based on: 1) a medical diagnosis, 2) recent or current suffering, or 3) ongoing treatment. Cancer was defined as any one or more types of gastric, liver, colon, breast, uterine, lung, or bronchial cancer. Using this information, patients were categorized based on the number of comorbid conditions: none, one, two, three, or more.
3. Definition of patients with self-aware Type 2 Diabetes Mellitus
Most participants in this study were individuals with T2DM who were aware of their condition. They were defined as being aware of their T2DM if they met one or more of the following criteria: 1) reported receiving a medical diagnosis in the health survey; 2) acknowledged currently suffering from T2DM; or 3) indicated undergoing treatment for diabetes with oral hypoglycemic agents, insulin therapy, or through diet/exercise regimens.
4. Health-Related Quality of Life
The EQ-5D tool from the KNHANES was used to analyze HRQoL levels and their influencing factors among elderly patients with T2DM who were aware of their condition. The EQ-5D is a subjective self-assessment tool for current health status and comprises five dimensions: mobility, self-care, usual activity, pain/discomfort, and anxiety/depression [26]. Mobility assesses the ability to walk, while self-care focuses on the ability to perform personal hygiene and dressing. Usual activities measure the ability to carry out typical daily tasks such as work, study, housework, family, or leisure activities. Pain/discomfort evaluates the level of physical pain or discomfort, and anxiety/depression addresses mental health issues related to feelings of anxiety and depression. The EQ-5D Index, a composite score, applies specific QoL weights to the Korean population [27]. For ease of interpretation, we reclassified the response categories for each EQ-5D item provided by the KNHANES as 0 = severe problems; 0.5 = some problems; and 1 = no problems. The participants were then divided into tertiles based on their EQ-5D Index scores, with the lowest group labeled Tertile 1 and the highest as Tertile 3.
5. Dietary assessment
The nutritional survey in the KNHANES involved trained interviewers conducting household interviews using the 24-hour recall method, in which respondents detailed their food intake from the previous day. The survey was conducted in principle through direct face-to-face interviews by trained interviewers, excluding the use of written records. When necessary, assistance from a proxy (guardian) was allowed [28]. The analysis used food group classifications from the KNHANES’s individual 24-hour dietary recall data, covering grains (divided into refined and unrefined), potatoes and starches, legumes, eggs, meats, fish and seafood, seeds, fruits, vegetables (subdivided into vegetables and salted vegetables), mushrooms, dairy, and seaweeds.
6. Statistical analysis
In this study, we utilized a complex sample design method incorporating cluster sampling variables, variance estimation strata, and weights. To address potential errors arising from differences in the number of households and population between the sampling design stage and the survey stage, as well as issues such as unequal sampling rates and nonresponse errors from survey nonparticipants, we employed association analysis weights [23]. Specifically, we used health survey-examination survey weights and the nutrition survey weights. To analyze the general characteristics of the elderly patients with T2DM, categorical variables were presented as frequencies and percentages using chi-square tests for significance. Continuous variables were expressed as means and standard errors with linear regression for significance testing. Multivariable linear regression was used to examine sex differences in EQ-5D scores, adjusting for factors such as age, BMI, physical activity, education level, monthly household income, smoking status, and alcohol consumption. Multivariable logistic regression was used to analyze the association between comorbidities and low HRQoL by sex, calculating odds ratios (OR) and 95% confidence intervals (95% CI). For the logistic regression analysis, the response categories for each EQ-5D item were reclassified. The original categories "some problems (0.5)" and "severe problems (0)" were merged into a single category labeled "Low HRQoL (1)," while the category "no problems (1)" was retained and relabeled as "High HRQoL (0)". The P for trend was calculated using the median value of each quartile as a continuous variable. Potential confounders, identified through literature review and preliminary analysis, were adjusted [12,29,30]. The confounding variables adjusted for include age (continuous), BMI (continuous), physical activity (continuous), education level (elementary school graduation or less, middle school graduation, and high school graduation or higher), monthly household income (< 1,000,000, 1,000,000–2,000,000, and ≥ 2,000,000), smoking status (nonsmoker, former smoker, and current smoker), and alcohol consumption (serving/day). Statistical processing was performed using SAS 9.4 (SAS Institute Inc.) and significance was tested at α = 0.05.
RESULTS
1. General characteristics and lifestyle factors of elderly patients with Type 2 Diabetes Mellitus by sex
The general characteristics and lifestyle factors of the survey participants were analyzed by sex and are presented in Table 1. This analysis included 1,653 men and 2,173 women. The average age was 71.89 for men and 73.17 for women, indicating that women were older on average (P < 0.001). Men had higher education, monthly household income, and employment rates than women (all P < 0.001). More women lived alone than men (P < 0.001). Among women, 91.04% were non-smokers, whereas men had higher rates of current and past smoking (P < 0.001). Alcohol consumption was higher in men than in women (P < 0.001). The mean BMI was 24.16 and 25.06 kg/m² for men and women, respectively, while average physical activity was 26.78 and 17.25 METs-h/week for men and women, respectively (all P < 0.001).

Demographic and lifestyle characteristics of participants by sex
2. Comparison of EuroQol-5 Dimensions domains and index scores by sex
Figure 2 compares the EQ-5D domains and index scores by sex in elderly patients with T2DM. After adjusting for age, BMI, physical activity, education level, monthly household income, smoking status, and alcohol consumption, women displayed lower EQ-5D levels in mobility, usual activities, pain/discomfort, and the overall EQ-5D Index than men. In detail, women and men respectively scored 0.81 and 0.75 in mobility (P = 0.002), 0.87 and 0.83 in usual activity (P = 0.027), and 0.81 and 0.71 in pain/discomfort (P < 0.001). The overall EQ-5D Index also revealed lower scores for women (0.84) relative to those of men (0.88, P = 0.001).
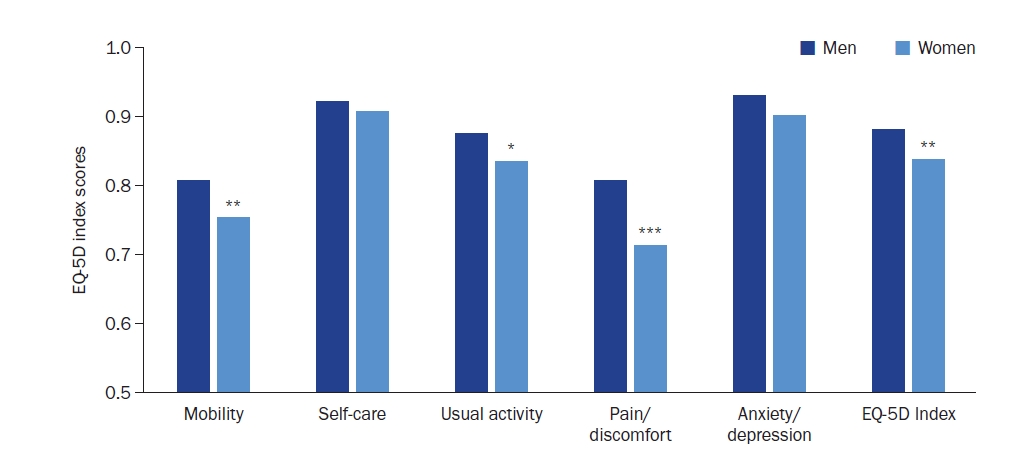
EQ-5D domains and index scores of participants by sex.
Values are adjusted for age, body mass index, physical activity, education level, monthly household income, smoking status and alcohol consumption.
EQ-5D, EuroQol-5 Dimensions.
*P < 0.05, **P < 0.01, ***P < 0.001 by multivariable linear regression analysis between men and women.
3. Trend analysis of EuroQol-5 Dimensions Index scores by sex
Figure 3 shows the sex-specific trends in the EQ-5D Index scores over different survey phases among elderly patients with T2DM. Both men and women showed a significant increasing trend in the EQ-5D Index scores from the 4th survey phase onwards (P for trend < 0.001). The EQ-5D Index scores for women increased until the 6th phase, significantly decreased in the 7th phase, and slightly increased in the 8th phase, whereas for men, this continued to increase until the 7th phase, with only a slight decrease in the 8th phase.
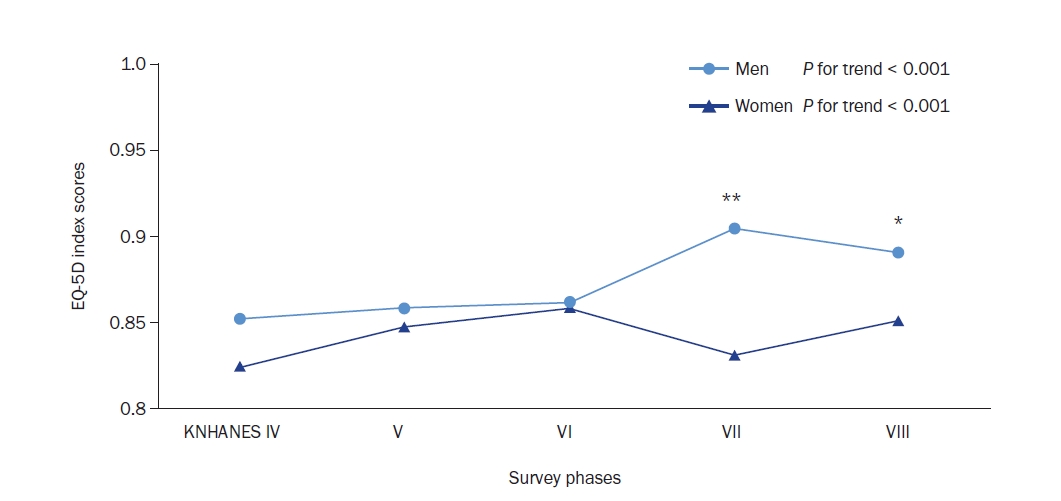
Sex-specific trends in the EQ-5D Index scores across survey phases (KNHANES IV–VII).
Values are adjusted for age, body mass index, physical activity, education level, monthly household income, smoking status and alcohol consumption.
KNHANES, Korea National Health and Nutrition Examination Survey; EQ-5D, EuroQol-5 Dimensions.
*P < 0.05, **P < 0.01, indicates significance for sex differences, and P for trend represents significance in linear trends, both assessed by multivariable linear regression analysis.
No significant differences were observed between men or women in the 4th or 6th phases. However, in the 7th and 8th phases, the EQ-5D Index scores in women was significantly lower than that in men. In the 7th phase, men scored 0.90 and women 0.83 (P = 0.001), and in the 8th phase, men scored 0.89 and women 0.85 (P = 0.016).
4. Association between comorbidities and low Health-Related Quality of Life by sex
Table 2 presents the results of the multivariable logistic regression analysis that examined the association between comorbidities and low HRQoL (defined as the lowest scores in EQ-5D domains) in elderly patients with T2DM, segmented by sex. In men, an increase in the number of comorbidities was associated with a significant decrease in all domains of EQ-5D (all P for trend < 0.05). Specifically, having three or more comorbidities was associated with low HRQoL in the domains of mobility (OR: 1.94, 95% CI: 1.22–3.09), self-care (OR: 2.49, 95% CI: 1.27–4.88), usual activity (OR: 3.64, 95% CI: 2.15–6.18) and pain/discomfort (OR: 1.71, 95% CI: 1.08–2.70) compared to those with no comorbidities. Similarly, in women, an increase in the number of comorbidities correlated with low HRQoL across three aspects: usual activity, pain/discomfort, and anxiety/depression (all P for trend < 0.05). Having three or more comorbidities was associated with low HRQoL in the domains of usual activity (OR: 1.72, 95% CI: 1.11–2.66), pain/discomfort (OR: 1.90, 95% CI: 1.24–2.92), and anxiety/depression (OR: 1.74, 95% CI: 1.05–2.90).

Odds ratios and 95% confidence intervals for low Health-Related Quality of Life according to the number of comorbidities1, analyzed separately for men and women
5. Comparison of food group consumption by EuroQol-5 Dimensions Index scores and sex
Table 3 shows the sex differences in the average food group consumption based on the EQ-5D Index scores among elderly patients with T2DM. Both men and women consumed fewer refined grains and had higher EQ-5D Index scores (P for trend < 0.001). In men, no significant differences were observed in other food groups in addition to refined grains. For women, higher EQ-5D Index scores were associated with higher consumption of meat, nuts, and vegetables (P for trend < 0.05).

Food group consumption by EQ-5D Index score tertiles and sex
DISCUSSION
This study found that elderly women with T2DM consistently exhibited a lower HRQoL than men did. This disparity has been particularly pronounced in recent years as indicated by EQ-5D Index trends. This study also revealed a significant correlation between increased comorbidities and lower HRQoL in men, which was not observed in women. Additionally, dietary habits linked to a higher EQ-5D Index, such as lower refined grain consumption and higher intakes of meat, nuts, and vegetables in women, suggest potential areas for targeted health interventions.
Our findings showing lower HRQoL in elderly women with T2DM than in men are underscored by broader social and economic factors. Globally, elderly women often have lower education and income levels and less economic participation [31-33]. These elements were linked to reduced HRQoL, which mirrors our results [34]. Additionally, in South Korea, the longer life expectancy of women paradoxically includes more years in poor health [4,35]. Social support gaps and entrenched sex roles further exacerbate HRQoL challenges [36]. Considering the higher prevalence and severity of chronic diseases in elderly women [37], which significantly affects life satisfaction [38], a holistic approach should be adopted and effective policies formulated to target the unique needs of this demographic.
Our study reinforces the significant impact of comorbidities on HRQoL in older men with T2DM, aligning with global research trends. This association was mirrored in a Dutch study involving 1,676 patients with T2DM that observed a marked decline in both mental and physical QoL with increased comorbidities [39]. Furthermore, a meta-analysis of patients with T2DM in Sub-Saharan Africa highlighted a negative correlation between comorbidities and HRQoL [30]. Comorbidities profoundly affect self-management and daily functioning in patients with T2DM, ultimately deteriorating their QoL [40,41].
This study found that higher EQ-5D Index scores were associated with lower refined grain consumption in both men and women. High-glycemic foods such as refined grains increase the risk of inflammation and cardiovascular disease, which are known to exacerbate psychological disorders [42]. Refined grains can induce postprandial hyperglycemia and hyperinsulinemia, reducing the secretion of autonomic hormones such as adrenaline, cortisol, glucagon, and growth hormone [43,44], potentially affecting the QoL of patients with diabetes. Women with higher EQ-5D Index scores also showed an increased consumption of vegetables, meat, and nuts. Intake of vegetables can aid in blood sugar control [45] while nuts improve lipid profiles and reduce cardiac complications [46]. A comprehensive review of dietary guidelines for diabetics confirmed the long-term benefits of vegetable, nut, and moderate meat consumption on blood sugar and cardiovascular disease risk management [47]. These dietary habits influence blood sugar and complication management in patients with diabetes, subsequently impacting their mental health, including depression symptoms [48].
This study was based on an analysis of KNHANES data from 2008 to 2020. Generally, cross-sectional studies have limitations in establishing cause-and-effect relationships between variables. However, in this study, we leveraged sex as the primary exposure variable, which helped mitigate some of these limitations, as sex itself is not influenced by the study outcomes. While efforts were made to adjust for confounding factors selected through a review of prior literature and a preliminary analysis to compare the QoL of elderly patients with diabetes by sex, residual confounding factors not accounted for may be present because of the nature of observational studies. Lastly, the use of single-day 24-hour recall data to assess dietary intake presents a limitation. This method relies on participants’ memory, which can be particularly challenging for those aged 65 and older due to potential cognitive decline. Additionally, using only a single day of recall data may not accurately represent typical dietary patterns due to daily variations in food intake, further affecting the reliability of the dietary assessment. Nevertheless, the KNHANES data used in this study provide robust guidelines for enhancing the validity and reliability of the measurements and analyses. As a nationally representative survey, KNHANES offers a comprehensive overview that is more representative of the general population compared to other datasets. The use of trained interviewers for data collection ensures high-quality data and reduces potential biases, thereby supporting the credibility of our findings. Despite the limitations mentioned, the comprehensive and representative nature of the KNHANES data contributes significantly to the understanding of dietary patterns and health outcomes in older adults with chronic diseases [23].
CONCLUSIONS
Our study revealed that elderly women with T2DM tend to experience lower levels of HRQoL compared to men, especially in recent years. Additionally, the impact of comorbidities and dietary habits on HRQoL varies by sex. Therefore, it’s crucial to develop tailored treatment guidelines aimed at improving the HRQoL of elderly T2DM patients, with a focus on their sex-specific characteristics. Implementing these tailored guidelines could enhance the HRQoL of older women with T2DM and promote more equitable healthcare outcomes. This underscores the importance of considering sex differences to comprehensively improve the well-being of this population. Continuously assessing HRQoL in this demographic allows for a better understanding of the factors influencing health and QoL, leading to more effective management strategies.
Notes
Conflict of Interest
There are no financial or other issue that might lead to conflict of interest.
Funding
This research was funded by 2024 Yeungnam University Research Grant and the National Research Foundation of Korea (NRF) grant funded by the Korea government (MSIT) (grant number: 2021R1A2C1007869).
Data Availability
This data that supports the findings of this study are openly available in the Korea National Health and Nutrition Examination Survey (KNHANES) at https://knhanes.kdca.go.kr/knhanes/main.do.
Acknowledgements
The authors are thankful to the investigators and participants of KNHANES.