Food and nutrient intake in pregnant women with singletons or multiples and post-delivery changes in intake in Korea: an observational study
Article information

Abstract
Objectives
Nutrient intake during pregnancy and lactation is crucial for the health of both mother and offspring. Diet and nutrient metabolism potentially vary according to ethnicity and fetal number; nevertheless, recent studies validating this are inadequate. Furthermore, few studies have tracked changes in intake after delivery. We compared the food and nutrient intakes between pregnant women in Korea carrying singletons and multiples during late pregnancy and assessed their changes through postpartum.
Methods
Ninety-eight pregnant women were recruited from Chonnam National University Hospital between January 2019 and December 2023, and 48 responded to follow-up. Third trimester and postpartum intake were assessed via food frequency questionnaires and supplement questionnaires. Student’s t-test, Mann–Whitney U test, chi-square test, paired t-test or Wilcoxon signed-rank test was performed and adjustments were made for covariates.
Results
Nutrient intake was generally adequate relative to the Dietary Reference Intakes for Koreans, with no differences between singleton- and multiple-pregnancy women. Sixty-six of 98 (67%) pregnant women consumed meat, fish, vegetables, and fruit daily. Dairy intake was low, while the mean iron intake during pregnancy reached 54.2 ± 34.0 mg/d, exceeding the tolerable upper intake level, mainly owing to supplements. Postpartum fruit and vitamin C intake decreased, with no significant differences between breastfeeding and non-breastfeeding women.
Conclusion
Dietary intake did not significantly differ between Korean singleton- and multiple-pregnancy women. Dairy intake was low and iron intake was excessive. Fruit intake decreased after delivery; however, difference in dietary intake according to breastfeeding status was minimal. Nutritional education may be necessary to promote a balanced diet in pregnant and postpartum women.
Trial Registration
Clinical Research Information Service Identifier KCT0005118.
INTRODUCTION
Adequate nutrient intake during pregnancy and lactation is important for maternal health and offspring development. The appropriate intake of iron, omega-3 fatty acids, calcium, and folic acid significantly impacts short- and long-term health outcomes, including maternal complication prevention and fetal brain development and growth [1-3]. In addition, nutrient metabolism during pregnancy is dynamically modulated to support fetal growth and development, optimizing nutrient absorption and utilization. During pregnancy, intestinal calcium absorption is enhanced compared to the non-pregnant state, while renal calcium reabsorption is also upregulated [4]. Maternal iron absorption is also increased to accommodate the expansion of blood volume and fetal iron storage [5]. In South Korea, the consumption of dietary supplements among pregnant women has been reported to be relatively high up to 2013 [6-8]. The government has recommended universal iron supplementation and free iron supplements for pregnant women have been provided since 2012, possibly contributing to a further increase in supplement intake. Although iron supplementation serves as an effective strategy for preventing iron deficiency, careful consideration is required as risk of adverse events due to excessive intake may increase, including risk of gestational diabetes and hypertension. However, the diet and nutrient intake of Korean pregnant women have not been recently reported.
Furthermore, current research on postpartum changes in nutrient intake among lactating women is lacking in the Asian population. Studies based on the National Health and Nutrition Examination Survey indicate that non-Hispanic Asians have higher Healthy Eating Index scores than Whites and Blacks [9]. Postpartum care practices, including traditional food intake, vary according to ethnicity. On the other hand, nutrient metabolism differs among Asians for certain nutrients [10]. However, nutrient metabolism during pregnancy and lactation has been understudied in Asians, in addition to other races and ethnicities. Therefore, additional data on food intake among Asian pregnant women are required to understand their nutritional security status and biology.
Meanwhile, the rate of multiple births has steadily been increasing worldwide since 2000. The 2021 fertility rate for multiple births in the United States was 3.1% [11], while the 2022 figure for Korea was 5.8% [12]. Multiple pregnancies are considered to have higher nutritional requirements than singleton pregnancies to address the demands of two or more fetuses. However, studies on the appropriate nutritional intake for mothers with multiple pregnancies and their fetuses are lacking. Therefore, studies on the dietary intake of pregnant women with multiples are required to examine nutritional security and can serve as a basis for physiological nutrition research in pregnant women.
This study aimed to investigate nutritional intake in Korean pregnant women during the third trimester of pregnancy and postpartum using a food frequency questionnaire (FFQ) and supplement questionnaire. This study 1) evaluated food group and nutrient intake, 2) analyzed post-delivery changes in intake depending on lactation status, and 3) compared intake between singleton- and multiple-pregnancy women.
METHODS
Ethics statement
This study received consent from all participants before commencement, obtained approval from the Institutional Review Board of Chonnam National University Hospital (CNUH-2018-125), and was registered with the Clinical Research Information Service (KCT0005118).
1. Study design
This study was conducted as an observational study and is presented according to the STROBE (Strengthening the Reporting of Observational Studies in Epidemiology) guidelines [13].
2. Participants
This study analyzed the dietary intake of pregnant women participating in a study assessing the association of dietary intake with bone mineral density and nutrient transport in the placenta. Pregnant women scheduled for delivery in the Department of Obstetrics and Gynecology, Chonnam National University Hospital, Gwangju, were recruited between January 2019 and July 2023. The participants were Korean women aged over 20 years and more than 24 weeks pregnant with 1–3 fetuses. To be included in the study, women had to be scheduled for delivery via cesarean section or induced labor at Chonnam National University Hospital owing to scheduling reasons. The exclusion criteria were as follows: 1) intrauterine fetal death, 2) disease or medication potentially affecting bone metabolism, 3) genetic disease, 4) pregnancy with 4 or more fetuses, and 5) implausible energy intake (< 500 or > 5,500 kcal/d). Additionally, participants with body mass index (BMI) above or below 3 standard deviations of the mean were considered outliers and excluded, as such extreme values could potentially affect the results (n = 1). A total of 98 women participated, among whom 48 were included in the follow-up analysis (Fig. 1). Women were classified as non-lactating if they had breastfed for less than 21 days. Lactating women visited the hospital within 1 month of weaning, while non-lactating women visited 6 months after delivery.
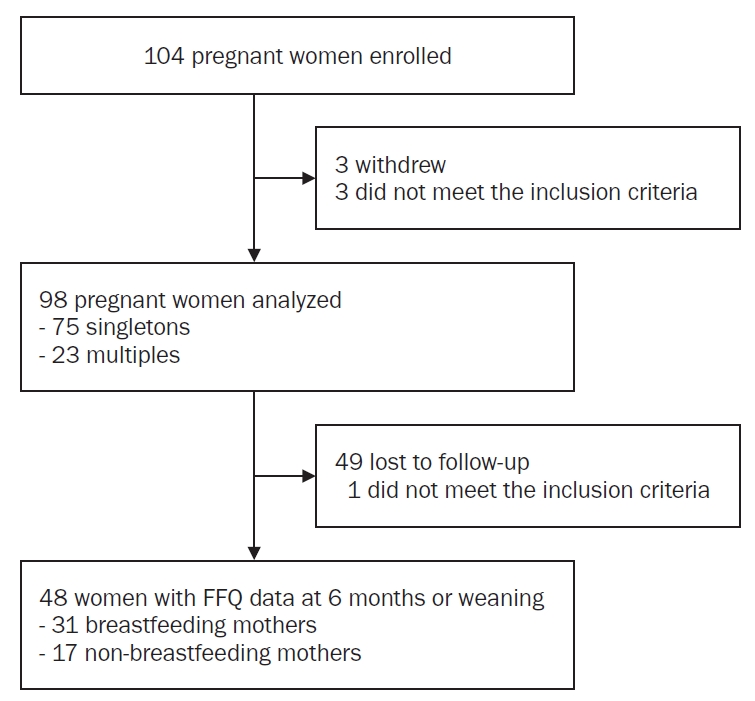
Flowchart of pregnant women participating in diet assessment during late pregnancy and post-delivery.
FFQ, food frequency questionnaire.
3. Dietary assessment
Food intake during the third trimester of pregnancy was investigated once between 1 day before delivery and 3 days after delivery. Post-delivery intake was assessed within 1 month of weaning in breastfeeding mothers and at 6 months postpartum in non-breastfeeding mothers. Food intake was surveyed using a semi-quantitative FFQ from the Korea National Health and Nutrition Examination Survey [14] and analyzed using the database provided by Korea Disease Control and Prevention Agency. A trained dietitian conducted face-to-face interviews and used food models where necessary. The FFQ included 112 food and beverage items, categorized into 17 food groups based on the main ingredients (Supplementary Table 1), from which the intakes of food groups, energy, and 22 nutrients were calculated. Serving sizes for each food group were defined according to the 2020 Dietary Reference Intakes for Koreans (KDRIs). The number of servings consumed per day was calculated. In addition, heme-iron intake was calculated by applying the percentage heme content of animal products to the individual ingredients of foods in the FFQ [15].
Dietary supplement intake was evaluated via interviews, and their nutritional content was used to calculate daily intake. Only supplements taken consistently for at least 2 weeks during the third trimester of pregnancy or after delivery were included in the analysis. When categorizing supplement type, a supplement was classified based on the most emphasized nutrient on the packaging if it comprised more than 1 nutrient (similar to how a consumer would self-report the supplement). If it contained 5 or more nutrients, it was classified as a multivitamin. Where a participant could not remember the name of the product, the mean supplemental intake of other participants that took the same type of supplement was considered.
4. Adequacy of intake
Personal energy requirements were calculated using the 2020 KDRIs. Although physical activity was not specifically investigated, pregnancy is generally considered a period of low activity according to the KDRIs; thus, we used the coefficient for low physical activity. Nutrient intake adequacy was analyzed based on the estimated average requirement (EAR) or adequate intake (AI) and tolerable upper intake level (UL) of the 2020 KDRIs [16].
5. Other characteristics
Maternal pre-pregnancy weight, height, smoking status, and drinking habits were self-reported. Data regarding maternal age at pregnancy, weight at delivery, gestational age, parity, diseases, and delivery complications were obtained from medical records. Breastfeeding status was verified monthly during follow-up.
6. Statistical analysis
Participants were categorized according to the number of fetuses carried (singletons or multiples), and data collected during follow-up were analyzed based on lactation status. Differences between groups were analyzed using the student’s t-test or Chi-square test. Non-normally distributed variables were transformed to approximate a normal distribution or analyzed using the Mann–Whitney U test. Food group and nutrient intakes during the third trimester of pregnancy and after delivery were compared using the paired t-test or Wilcoxon signed-rank test. Adjustments were made for maternal age, pre-pregnancy BMI, BMI at delivery, length of gestation, and fetal number using the general linear model. Statistical analysis was performed using SAS software (version 9.4; SAS Institute), and statistical significance was established at P < 0.05.
RESULTS
1. Participant characteristics
A total of 98 mothers were included in this analysis (75 singletons and 23 multiples [22 twins and 1 triplet]; Fig. 1). The mean maternal age and gestational length were 32.7 ± 3.9 years and 256.3 ± 9.2 days, respectively (Table 1). Multiple-pregnancy women exhibited shorter gestational lengths than their singleton counterparts (248.1 ± 9.4 d vs. 258.9 ± 7.5 d, P < 0.001). Eighty-seven percent of the participants took supplements, with the most common being iron (61 of 98 women; 62%), vitamin D (44 of 98 women; 45%), multivitamins (42 of 98 women; 43%), probiotics (28 of 98 women; 29%), omega-3 fatty acids (27 of 98 women; 28%), and calcium (9 of 98 women; 9%). More than half (51 of 98 participants; 52%) of the participants had a disease, with the predominant diseases being diabetes (17 of 98 women; 17%), hypertension (11 of 98 women; 11%), and thyroid-related diseases (11 of 98 women; 11%). Approximately 1 participant consumed alcohol during pregnancy, and none smoked during pregnancy.

Characteristics of Korean pregnant women carrying singletons or multiples assessed at delivery
2. Intake during the third trimester of pregnancy
The mean daily intake of rice, which served as the participants’ staple food, was 2.15 ± 0.88 servings (Table 2). On average, participants consumed 4.27 ± 2.83 and 2.49 ± 2.15 servings of vegetables and fruits per day, respectively (Table 2). Sixty-seven percent of the participants met the Korean dietary guidelines for pregnant and lactating women in terms of “consuming meat, fish, vegetables, and fruit daily” (Supplementary Table 2). However, only 9 pregnant women consumed dairy products more than 3 times a day. No significant differences in intake were found between singleton- and multiple-pregnancy women for most food groups (Table 3).

Mean intakes of food groups and nutrients of Korean pregnant women carrying singletons or multiples during the third trimester of pregnancy

Mean food group intakes during the third trimester of pregnancy in singleton- and multiple-pregnancy mothers
The mean daily energy intake from food during the third trimester of pregnancy was 2,255.7 ± 812.8 kcal. Most women met the EAR for vitamin A, thiamine, riboflavin, niacin, and vitamin C (Table 2). The mean calcium intake was 610.6 ± 270.5 mg/d, which constituted 87% of the recommended nutrient intake (RNI) (700 mg/d). No difference in nutrient intake from foods during late pregnancy was observed between singleton- and multiple-pregnancy women (Table 4). The mean total intakes (from foods and supplements) of most nutrients met their respective RNIs or AIs (Fig. 2A). A substantial proportion of pregnant women did not fulfil the recommendations for energy (72 of 98 women; 74%) or fiber (65 of 98 women; 66%) intake.

Mean nutrient intakes from foods during the third trimester of pregnancy of mothers carrying singletons or multiples
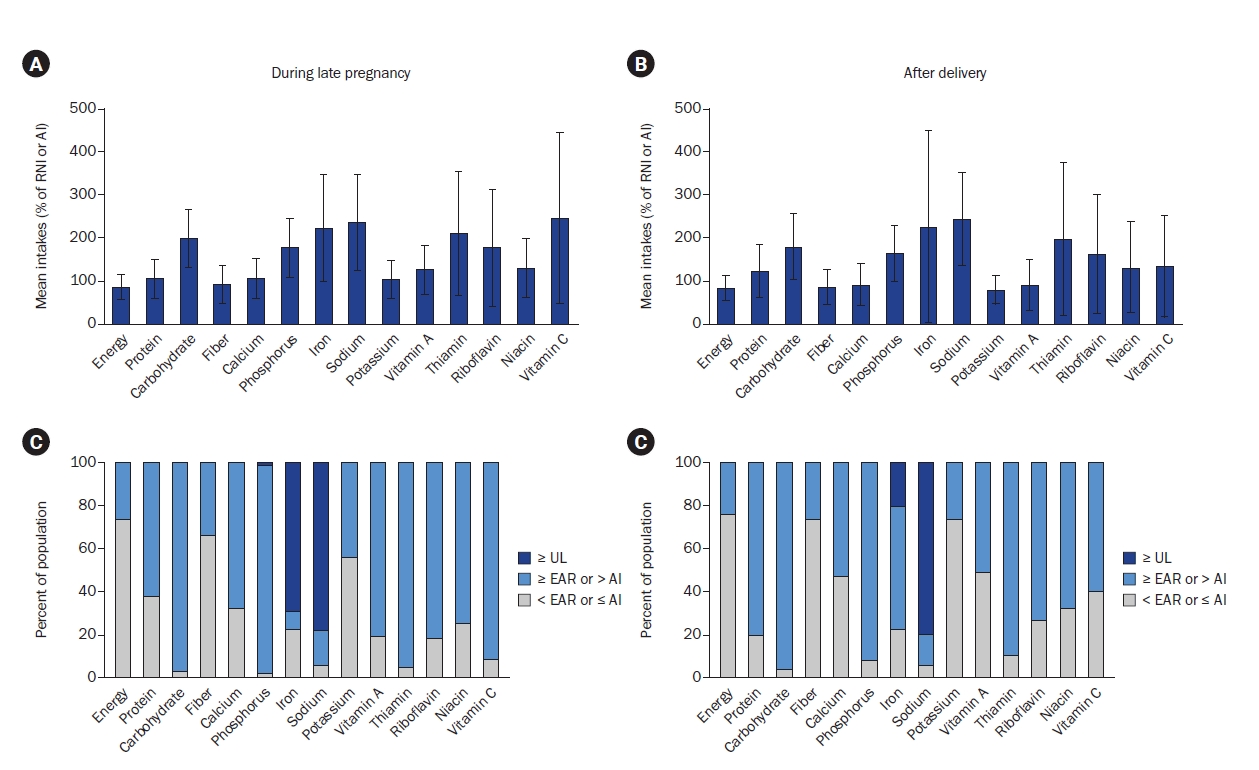
(A) Mean nutrient intakes from foods and supplements during late pregnancy shown as percentages of the respective RNIs or AIs. (B) Mean nutrient intakes of women after childbirth shown as percentages of the respective RNIs or AIs. (C) Prevalence of nutrient intake in pregnant women according to the EAR, AI, or UL. (D) Prevalence of nutrient intake in women after delivery according to the EAR, AI, or UL. All nutrients were based on the 2020 KDRIs. EAR, RNI, and UL values were used for all nutrients, except fiber and potassium, which were calculated based on the AI, and sodium, which was based on the chronic disease risk reduction intake. (A, B) Participants consuming extreme amounts of iron (≥ 140 mg/d, n = 2), thiamine (≥ 33 mg/d, n = 2), riboflavin (≥ 27 mg/d, n = 1), or vitamin C [≥ 1,000 mg/d, (A): n = 6, (B): n = 2] were excluded from the analysis of the corresponding nutrient. These extreme intakes emanated from supplements. (C, D) Black, excess is above the UL; gray, adequate is above the EAR or AI but below the UL; light gray, deficient is below the EAR or AI.
RNI, recommended nutrient intakes; AI, adequate intake; EAR, estimated average requirement; UL, tolerable upper intake level.
The mean iron intake from diet was 15.5 ± 6.6 mg/d, accounting for approximately 65% of the RNI (24 mg/d), while the mean iron intake from supplements was 54.2 ± 34.0 mg/d, exceeding the UL (Supplementary Table 3), resulting in 69% of the participants consuming iron in excess of the UL from diet and supplements (Fig. 2C). Iron intake from supplements was higher in multiple-pregnancy mothers than in their singleton counterparts. Supplement-based iron intake was primarily in the form of non-heme iron, except for 1 participant.
3. Post-delivery intake
Among the 98 participants registered in this study, 48 (31 breastfeeding and 17 non-breastfeeding women) were followed beyond delivery (Fig. 1). The participants that agreed to the follow-up and those that dropped out displayed similar characteristics. No significant differences in baseline characteristics were found between breastfeeding and non-breastfeeding mothers (Table 5).

Characteristics of participants with follow-up
After childbirth, regardless of lactation status, fruit and dairy intake decreased, whereas coffee and alcohol consumption increased (Table 6). Dairy and leafy vegetable intakes decreased in breastfeeding mothers, but not in non-breastfeeding mothers. Additionally, the increase in coffee intake was significantly greater in non-breastfeeding mothers than in breastfeeding mothers (0.4 ± 1.0 vs. 1.4 ± 1.1 serving/d; P = 0.002). Sixteen out of 31 breastfeeding women (52%) were compliant with Dietary Guidelines for pregnant and lactating women in terms of “consuming meat, fish, vegetables, and fruit every day”, while only 3 participants consumed dairy products 3 times a day (Supplementary Table 2).

Changes in food group intakes from the third trimester of pregnancy to postpartum according to breastfeeding status
Similar to that during pregnancy, a considerable proportion of women did not meet the Estimated Energy Requirement or EAR and AI for fiber and potassium intake from foods and supplements, even after delivery (Fig. 2D). Energy intake remained unchanged after delivery; however, vitamin C intake from foods significantly decreased in both breastfeeding (mean change: –62.1 ± 231.1 mg/d, P = 0.01) and non-breastfeeding (mean change: –104.4 ± 229.7 mg/d, P = 0.02) women (Table 7). After delivery, 10 of 49 participants (20%) consumed iron in excess of the UL. Owing to the small number of multiple-pregnancy mothers that were followed-up, statistically comparing maternal intake by lactation status according to the number of newborns was not possible; however, the mean intakes are presented in Supplementary Tables 4 and 5. Supplement intake was similar between lactating and non-lactating mothers (Supplementary Table 6).

Changes in nutrient intake from food from the third trimester of pregnancy to postpartum according to breastfeeding status
DISCUSSION
We examined the dietary intake of Korean pregnant women carrying singletons or multiples during late pregnancy and postpartum. The intake of most foods, supplements, and nutrients did not significantly differ between singleton- and multiple-pregnancy women. Korean pregnant women were found to generally consume a balanced diet; however, dairy intake was low. The mean calcium and iron intake from food was inadequate both pre- and post-delivery. Iron was overconsumed via supplements. Fruit, dairy, and vitamin C intake decreased postpartum, regardless of breastfeeding status.
The women in the present study may have been trying to maintain healthy dietary habits during pregnancy. The mean age of the participants was 34.5 years, which exceeds that of pregnant women from other countries; nonetheless, it did not largely deviate from the mean age of delivery in Korea (33.5 years of age) [17]. As the age at child birth of Korean women and the education status, and thus employment status, of women increased during the past decades, participants of this study may be more financially stable and invested in their pregnancies compared to pregnant women decades ago. This may result in better diet quality and nutrition status during pregnancy as income and education status are known to be positively associated with diet quality [18, 19]. The proportion of participants who consumed meat, fish, vegetables, and fruits every day (68.4%) exceeded that of Korean pregnant women in 2013 [6-8, 20]. Additionally, the post-delivery change in food intake, such as the decrease in fruit intake and increase in coffee and alcohol consumption, indicate that women attempted to consume healthier foods during pregnancy. Participants of this study consumed approximately 4.4 servings of vegetables per day, which could be calculated as approximately 330 g/d, assuming a serving size of 75 g. This intake is substantially higher than that reported in pregnant women in Japan, the Netherlands, and the United States (43.9–158 g/d) [21-23]. Additionally, the fruit intake of participants of this study exceeded that of pregnant women in Japan and the Netherlands [21-25]. Vegetable and fruit intake among Koreans ranks third highest among Organization for Economic Cooperation and Development countries [26]. In addition to the traditionally higher intake of fruits and vegetables among Koreans, participants of this study also exhibited a higher fruit intake than Korean women of childbearing age (91.9 ± 0.61 g) [27]. Consistently, although our participants’ calcium intakes during pregnancy were lower than those of their counterparts in other countries [21, 22, 24, 25, 28, 29], they remained higher than the mean calcium intake of Korean women of childbearing age (432 mg/d) [27]. However dairy and calcium intake decreased after delivery, suggesting that Korean pregnant women aimed to increase their calcium intake during pregnancy by ingesting more dairy products or supplements. The proportion of pregnant women ingesting supplements (86 out of 98 women; 87%) almost doubles that of other women of similar age (48.3%) [30, 31] and coincides with that of pregnant women surveyed 10 years ago [6-8]. These characteristics suggest that pregnant women are particularly interested in health and nutrition compared to Korean women of childbearing age.
Nevertheless, iron was overconsumed. During pregnancy, the absorption of non-heme iron increases [32]. Iron absorption rates have not been reported in pregnant Asian women, despite recent reports of ethnic differences in iron absorption. We analyzed heme and non-heme iron separately, referring to a recent database of the heme iron content of animal foods [15]. In our study, non-heme iron intake accounted for 90% of the total iron intake, displaying consistency with the calculated non-heme iron intake ratio from Korean food according to the KDRIs [16]. As non-pregnant East Asian women exhibit higher absorption rates of non-heme iron than their White counterparts [10], it is possible that Korean pregnant women may excessively absorb iron due to both high intakes and greater absorption rates. Once absorbed, most iron is not excreted; therefore, excess iron accumulates in the liver, heart, and pancreas in the non-pregnant state. Iron overload during pregnancy potentially aggravates the risk of “small for gestational age,” preterm birth, intrauterine death [33], copper and zinc deficiency [34, 35], and gestational diabetes [36]. In Korea, iron supplements are available to pregnant women free of charge at public health centers, irrespective of income, an initiative regarded to have an impact on iron containing supplement use. Our results suggest that Korean pregnant women potentially overconsume iron from supplements, indicating the need to reconsider the necessity of universal iron supplementation for pregnant women and limit the amount of iron contained in prenatal supplements.
In this study, the intakes of most foods and nutrients during pregnancy did not significantly differ between singleton- and multiple-pregnancy mothers. Knowledge regarding the appropriate nutrient intake for women carrying multiples is currently limited. Some organizations recommend that women with multiple pregnancies take additional calcium, vitamin D, iron, and folic acid [37]. However, according to certain intervention studies, high-dose folic acid supplementation in pregnant women with multiple pregnancies did not mitigate the risk of complications, such as preeclampsia, while iron supplementation exclusively benefitted mothers with anemia [38]. Regarding calcium, bone resorption in women pregnant with twins exceeds that in women with singletons during the second and third trimesters of pregnancy [39], indicating that the increase in the fetal calcium needs of multiple fetuses are met via maternal metabolic changes. In this study, pregnant women with multiples were expected to increase their energy, food, and nutrient intakes owing to elevated physiological needs. However, similar intakes were noted between singleton- and multiple-pregnancy mothers, revealing the possibility that the mother may respond to fetal needs by increasing her absorption rate or the efficiency of nutrient transport to the fetuses, rather than increasing intake [4, 5]. On the other hand, dietary intake is influenced by many environmental factors as well, therefore the intakes of pregnant women may not reflect physiological requirements. Whether, and if so, how, the mother physiologically acknowledges and responds to the increased number of fetuses warrants further research. In addition, studies on nutrient intake and the short- and long-term health outcomes of mothers with multiples and their children may facilitate the establishment of appropriate dietary guidelines.
Limitations
Our study has several limitations. First, the number of participants is small. Owing to the COVID-19 pandemic, in addition to the rapid decrease in birth rate, unexpected challenges in recruitment were encountered. Nonetheless, our research staff were able to prevent increases in dropout rates during COVID-19. Second, participants were recruited from tertiary hospitals, resulting in a relatively large number of participants with diseases. Such participants may be more health-conscious and consume healthier foods than the general pregnant population [40, 41]. Third, this study may not be entirely generalizable because it is limited to women that delivered at one hospital, despite originating from various parts of southwestern Korea. Furthermore, the importance of dietary quality, in addition to food and nutrient intake, has been emphasized; however, no diet quality index has been validated for use in Korean pregnant women. Finally, in breastfeeding women, food intake may vary depending on the amount of breastmilk produced. However, few participants were breastfeeding, and accurately assessing the amount of breastmilk generated is difficult. Since 44 women out of 48 participants (92%) in this study provided both breastmilk and formula to their newborns, the results of this study may be applicable to lactating mothers who practice mixed feeding. Since the rate of exclusive breastfeeding is decreasing both in Korea and globally [42] while that of mixed feeding is increasing, the findings of this study may help formulate recommendations for this population. Despite its limitations, this study possesses the strength of analyzing dietary intake changes by tracking the same participants from the third trimester of pregnancy through the postpartum period. In addition, this study used an FFQ appropriately developed to capture the dietary habits of Koreans. Furthermore, the intake of iron, an important nutrient for pregnant women, was analyzed in the form of heme and non-heme iron using a recent database.
Conclusion
In conclusion, this study examined overall dietary intake in the third trimester of pregnancy using an FFQ. Food and supplement intakes were similar between singleton- and multiple-pregnancy Korean women. Korean women adequately consumed most nutrients and endeavored to eat healthier during pregnancy by consuming more fruits and dairy and reducing coffee and alcohol consumption relative to post-delivery. Participants consumed excessive iron via supplements during pregnancy. Further research is required to assess the physiological and health effects of food and nutrient intake in pregnant women.
Notes
CONFLICT OF INTEREST
There are no financial or other issues that might lead to conflict of interest.
FUNDING
This work was supported by the National Research Foundation of Korea (Grant number: 2018R1C1B3003777) and Chonnam National University (Grant number: 2023-0080-01).
DATA AVAILABILITY
Research data is optionally available upon a reasonable request to the corresponding author.
ACKNOWLEDGMENTS
During the preparation of this work, the author(s) used DeepL in order to translate the manuscript to English. After using this tool/service, the authors reviewed and edited the content as needed and take full responsibility for the content of the publication.
SUPPLEMENTARY MATERIALS
Classification of food groups included in the food frequency questionnaire
Percentage of women complying with the “Dietary Guidelines for Pregnant and Breastfeeding Women in Korea”
Nutrient intakes from dietary supplements during the third trimester of pregnancy in women carrying singletons or multiples
Mean (± SD) dietary intakes of food groups and nutrients after delivery in breastfeeding mothers according to number of fetuses
Mean (± SD) dietary intakes of food groups and nutrients after delivery in non-breastfeeding mothers according to number of fetuses
Postpartum nutrient intake from dietary supplements by breastfeeding status