The dietary factors associated with sleep duration in postmenopausal middle-aged women: a cross-sectional study using 2019–2023 Korea National Health and Nutrition Examination Survey data
Article information

Abstract
Objectives
This study aimed to analyze dietary factors associated with sleep duration in postmenopausal middle-aged women using data from the Korea National Health and Nutrition Examination Survey (KNHANES), with particular emphasis on the postmenopausal period.
Methods
A total of 3,040 postmenopausal women aged 40–64 years from the 2019–2023 KNHANES were included. Sleep duration was classified into four categories: “appropriate sleep duration” (ASD; 7–9 hours), “short sleep duration” (6–7 hours), “very short sleep duration” (VSSD; < 6 hours), and “long sleep duration” (LSD; > 9 hours). Nutrient and food intake were compared among groups using analysis of covariance. Multinomial logistic and polynomial regression models assessed associations, adjusting for demographic and health covariates.
Results
The VSSD group had higher body mass index and waist circumference than the ASD group, despite lower total energy intake, and also consumed more snack energy and skipped breakfast and dinner more often. This group also had lower intakes of monounsaturated fatty acids and nuts and seeds. In the late menopausal group, greater consumption of cereal grains, fish and shellfish, and beverages was associated with elevated LSD risk. Conversely, higher folate intake in the early menopausal group was inversely associated with VSSD risk. Cholesterol intake was positively associated with LSD risk in both groups. A negative nonlinear association between sleep duration and dietary intake was observed in the early menopausal group when polyunsaturated fatty acid intake exceeded 19.86 g/day and riboflavin intake exceeded 1.76 mg/day. In the late menopausal group, riboflavin intake was strongly correlated with increased LSD risk (odds ratio = 4.776, P = 0.004). Sugar and beverage intake showed a positive linear relationship with sleep duration at average intake levels.
Conclusion
Dietary factors associated with sleep duration differed by postmenopausal period, with specific nutrients and food groups exhibiting variable associations with sleep duration above mean intake levels.
INTRODUCTION
The recommended sleep duration for adults aged 18–64 years to promote optimal health and well-being is 7 to 9 hours per day [1]. Sleep is closely linked to the endocrine system. Therefore, insufficient sleep duration affects cortisol, insulin, ghrelin, leptin, sex hormones, and growth hormone, altering energy metabolism, glucose regulation, and appetite [2]. Impaired metabolic homeostasis due to sleep insufficiency increases the risk of chronic diseases including hypertension, cardiovascular disease, type 2 diabetes mellitus, obesity, and cancer [1, 3, 4]. Conversely, abnormal glucose metabolism caused by diabetes negatively affects sleep through inflammation and nocturia [5], elevated blood pressure deteriorates sleep quality through sympathetic nervous system activation [6], and a high body mass index (BMI) increases the risk of sleep disorders such as insomnia [7]. This indicates a bidirectional relationship between chronic diseases and sleep.
Despite the importance of adequate sleep duration for health, the average sleep duration in the Korean population has steadily decreased over the past decade. In particular, the proportion of adults aged ≥ 19 years who sleep for short durations of < 7 hours has continuously increased, with this phenomenon being more pronounced among women [3]. Sleep disorders, such as insomnia, can occur in men and women across all age groups; however, they are more prevalent in women and significantly increase during the years surrounding menopause [8].
Menopause is defined as the permanent cessation of reproductive function, characterized by the absence of menstruation for 12 consecutive months or more following the reproductive years [9]. Natural menopause, excluding pathological premature menopause, occurs on average between 49 and 52 years of age; therefore, women spend more than the final third of their lives in a postmenopausal state [10]. During the transition to menopause, complex physical and psychological changes associated with aging occur, along with alterations in the endocrine system, including decreased sex hormone levels. Consequently, up to 85% of postmenopausal women experience characteristic menopausal symptoms, including vasomotor symptoms (hot flashes and night sweats), depression, impaired concentration, reduced libido, anxiety, and sleep disturbances [11].
According to the Study of Women’s Health Across the Nation, the prevalence of sleep disorders increases from 16%–42% in premenopausal women to 39%–47% during the perimenopausal period and 35%–60% in postmenopausal women [12]. Studies investigating the causes of increased sleep disorders during the menopausal transition have identified hormonal fluctuations (e.g., estrogen and progesterone), reduced melatonin levels, mood disorders, and vasomotor symptoms (e.g., night sweats and hot flashes) as major contributing factors [3, 9, 12]. In particular, the risk of sleep insufficiency due to ovarian hormone changes during the postmenopausal period is estimated to gradually increase independent of aging [13]. Menopause-related sleep disorders represent a significant public health issue, as they not only contribute to reduced quality of life through chronic fatigue caused by shortened sleep duration, but also negatively impact mental health—leading to conditions such as depression, anxiety, and dementia—and increase the risk of various chronic diseases [9].
Several studies have reported inconsistent findings regarding the relationship between sleep and dietary intake [4]. Nevertheless, irregular eating patterns and the consumption of energy-dense snacks have been consistently associated with short sleep duration [4, 14]. Severe sleep deprivation is presumed to be involved in a series of mechanisms that affect food choice by enhancing the pleasure stimulus processing of the brain, thereby increasing food reward responses [15]. An experimental study targeting young adults at risk of obesity who were chronically sleep-deprived demonstrated that sleep extension reduced overall appetite and cravings for sweet and salty foods [16].
Furthermore, consumption of foods rich in tryptophan or melatonin may improve sleep quality and increase sleep duration [17]. The intake of macronutrients and specific vitamins or minerals has been reported to be associated with the risk of very short or long sleep duration, suggesting that dietary factors and sleep have a mutual causal relationship [18]. Previous research targeting Koreans has demonstrated that habitual alcohol consumption in postmenopausal women is associated with short sleep duration and that comorbidities interact with the relationship between vitamin C and carbohydrate intake and short sleep risk [19].
Sleep insufficiency is a public health issue that imposes social and economic burdens on communities and significantly impairs quality of life by negatively affecting individual mental and physical health. Given that the postmenopausal period constitutes a substantial portion of a woman’s life, identifying factors related to sleep insufficiency that commonly occur during this period is meaningful. However, research investigating the relationship between nutritional intake, dietary habits, and sleep in postmenopausal Korean women and analytical studies examining sleep-related dietary factors according to postmenopausal duration are limited.
Therefore, this study was conducted using the nationally representative Korea National Health and Nutrition Examination Survey (KNHANES) to analyze the dietary factors associated with sleep insufficiency according to postmenopausal duration in middle-aged Korean women to provide fundamental data for promoting sleep health in postmenopausal women and preventing chronic diseases through improved sleep quality.
METHODS
Ethics statement
Informed written consent was obtained from each participant. The study protocol was approved by the Institutional Review Board (IRB) of the Korea Disease Control and Prevention Agency (approval numbers: 2018-01-03-C-A, 2018-01-03-2C-A, 2018-01-03-5C-A, 2018-01-03-4C-A, 2022-11-16-R-A). According to Article 2, Item 1 of the Bioethics and Safety Act and Article 2, Paragraph 2, Item 1 of the Enforcement Decree, the study is considered research directly conducted by the government for public welfare. Therefore, it is exempt from review by a separate Research Ethics Committee.
1. Study design
This study is a cross-sectional analysis of raw KNHANES data, described according to the Strengthening the Reporting of Observational Studies in Epidemiology (STROBE) guidelines (https://www.strobe-statement.org/).
2. Study participants
From the raw data of 35,753 participants across five survey years, including the 1st (2019, n = 8,110), 2nd (2020, n = 7,359), and 3rd (2021, n = 7,090) years of the 8th KNHANES, and the 1st (2022, n = 6,265) and 2nd (2023, n = 6,929) years of the 9th KNHANES, middle-aged postmenopausal women aged 40–64 years were extracted. To exclude analytical errors due to extreme intake, individuals reporting total daily energy intakes of ≤ 500 kcal or ≥ 5,000 kcal were excluded. Additionally, cases with missing health questionnaire data (age, education level, household income, economic activity status, alcohol consumption and smoking rates, and aerobic physical activity practice), health examinations (anthropometric measurements, blood pressure, diabetes, and dyslipidemia tests), and nutritional surveys (food intake and dietary behavior surveys) were excluded, resulting in a final study population of 3,040 participants (Fig. 1).
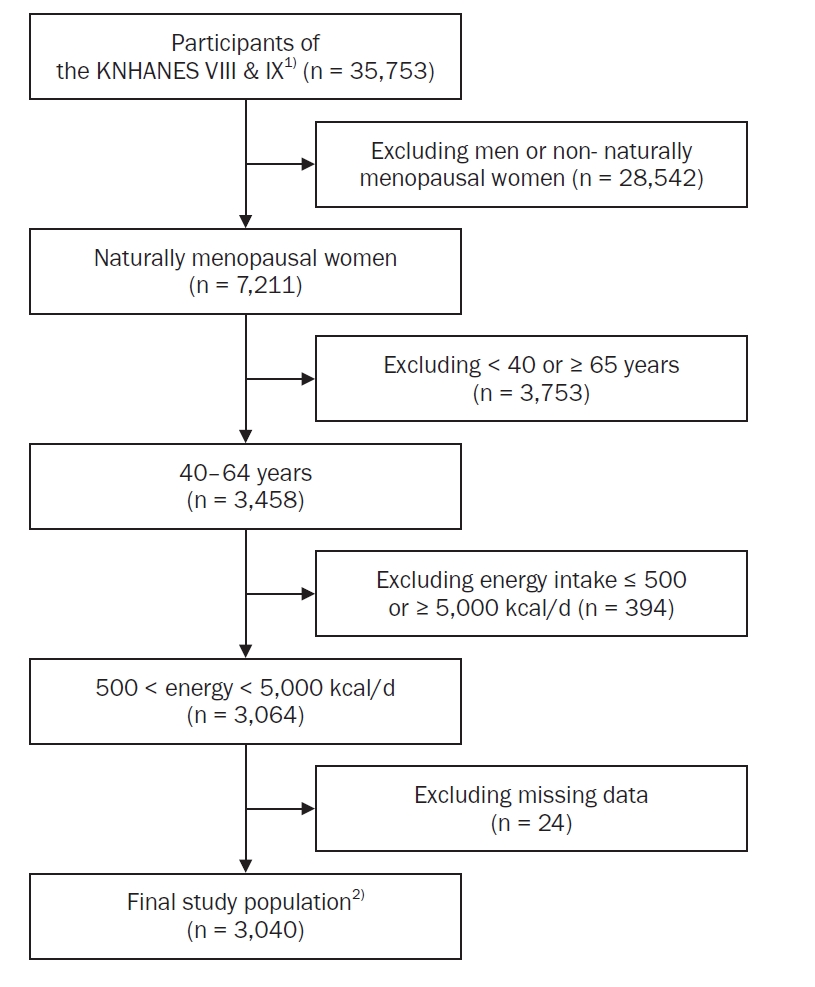
Final study population derivation process.
1)Year 1 (2022) and 2 (2023).
2)Postmenopausal period data missing for two participants.
3. Sleep duration and general characteristics
Daily average sleep duration was calculated using weekday/weekend average sleep hours from the health questionnaire surveys of the 8th Survey 1st and 2nd years and 9th Survey 1st and 2nd years, applying the following formula: {(weekday sleep hours × 5 days) + (weekend sleep hours × 2 days)} / 7 days. For the 8th Survey 3rd year, which investigated weekday/weekend bedtime and wake-up times instead of daily average sleep duration, weekday/weekend daily average sleep hours were calculated first, and then the daily average sleep duration was computed using the same formula. Based on the recommended sleep duration criteria of the National Sleep Foundation for adults aged 26–64 years [1], participants were classified as follows: “appropriate sleep duration (ASD)” group, those sleeping 7–9 hours/day; “short sleep duration (SSD)” group, those sleeping ≥ 6 hours/day but < 7 hours/day; “very short sleep duration (VSSD)” group, those sleeping < 6 hours/day; and “long sleep duration (LSD)” group, those sleeping > 9 hours/day. General characteristics were analyzed using data collected from health questionnaire surveys including age, education level (elementary school or below, middle school, high school, college or above), household income (low, lower-middle, upper-middle, high), economic activity status (employed, unemployed or economically inactive), alcohol consumption status (drinking defined as monthly to 4 times/week consumption, non-drinking otherwise; unknown and non-response excluded), smoking status (smoking defined as daily or occasional smoking, non-smoking otherwise; unknown and non-response excluded), and aerobic physical activity practice (practice defined as moderate-intensity physical activity ≥ 2.5 hours/week or high-intensity physical activity ≥ 1.25 hours/week or equivalent combined moderate and high-intensity activity, non-practice otherwise). Health examination data included anthropometric measurements such as BMI calculated from height and weight and waist circumference (WC); blood test results including fasting blood glucose (FBG), glycated hemoglobin (HbA1c), total cholesterol, high-density lipoprotein-cholesterol (HDL-chol), low-density lipoprotein-cholesterol (LDL-chol), and triglycerides (TG); and mean systolic blood pressure (SBP) and diastolic blood pressure (DBP) from three measurements. Postmenopausal duration was calculated using current age and menopausal age and then classified into two groups according to postmenopausal duration: “early postmenopause” for < 6 years postmenopause and “late postmenopause” for ≥ 6 years postmenopause [20].
4. Nutrient and food group intake and dietary behavior survey
Daily intake data for total energy and nutrients, including carbohydrates, dietary fiber, sugars, protein, fat, saturated fatty acids (SFA), monounsaturated fatty acids (MUFA), polyunsaturated fatty acids (PUFA), n-3 fatty acids, n-6 fatty acids, cholesterol, calcium, phosphorus, sodium, potassium, iron, vitamin A, thiamin, riboflavin, niacin, folate, and vitamin C, and water from 24-hour dietary recall surveys were used. Energy intake ratios for macronutrients (carbohydrates, proteins, and fats) were calculated as 4, 4, and 9 kcal/g, respectively. Daily intake data for food groups, including cereal grains, potatoes and starchy foods, sweeteners, pulses, nuts and seeds, vegetables, mushrooms, fruits, seaweeds, meats, eggs, fish and shellfish, dairy products, fats and oils, beverages, and alcoholic beverages from food intake surveys were utilized. Meal skipping status according to meal type was obtained from the dietary behavior survey questionnaire data.
5. Statistical analysis
Because KNHANES employs a multistage stratified cluster probability sampling design to ensure sample representativeness and estimation accuracy, complex sample analyses were conducted incorporating strata, clusters, and sampling weights. Categorical variables, including age groups, education level, household income, economic activity status, alcohol consumption and smoking status, aerobic physical activity practice, and meal frequency by meal type, were presented as frequencies and percentages using the PROC SURVEYFREQ procedure, and distribution differences among the four groups were tested using the Rao-Scott chi-square test. For continuous data, including food intake survey data such as energy, nutrient, and food group intake, and health examination data such as BMI, WC, SBP, DBP, FBG, HbA1c, total cholesterol, HDL-chol, and TG, complex sample analysis was conducted using the PROC SURVEYMEANS and PROC SURVEYREG procedures. Analysis of variance was performed to present the least-squares means and standard errors for the four groups according to the sleep duration classification and test mean differences. In the analysis of covariance (ANCOVA), variables known to affect sleep [5-7] or showing significant differences according to sleep duration in the statistical analysis results of this study, including age, education level, household income, alcohol consumption and smoking status, BMI, SBP, TG, HDL-chol, HbA1c, and total energy intake, were adjusted, and mean differences were tested. A post hoc analysis using Tukey’s method was conducted for between-group difference testing. Multinomial logistic regression was used to analyze the effects of nutrient and food group intakes on sleep duration with odds ratios. As the LSD group showed different patterns of nutrient and food group intake compared with the other three groups and J/U-shaped relationships between disease risk and sleep have been reported [1, 5], polynomial regression was applied to model nonlinear associations between sleep duration and nutrient and food group intake. For variables showing significance in polynomial regression analysis, 1st coefficients (β1, coefficients of independent variables) showing linear relationships and 2nd coefficients (β2, coefficients of squared independent variables) showing nonlinear relationships were presented, and inflection points with corresponding sleep durations were calculated using the formula –β1 / 2β2. Multinomial logistic and polynomial regression analyses were conducted separately for the early and late postmenopause groups, adjusting for the same variables used in the ANCOVA. Variance inflation factors were checked to diagnose multicollinearity among the independent variables. All data were analyzed using SAS statistical software (version 9.4; SAS Institute Inc.), with significance determined at P < 0.05 using two-tailed tests.
RESULTS
1. General characteristics and health factors of study participants
The general characteristics of the participants are listed in Table 1. Among the total 3,040 study participants, the ASD group comprised 1,570 participants (51.6%), the SSD group 829 participants (27.3%), and the VSSD group 585 participants (19.2%), with the sleep-insufficient SSD and VSSD groups accounting for 46.5% of the total. The LSD group consisted of 56 participants (1.8%). The 50–59 age group was the most prevalent, with 1,721 participants (56.6%), followed by 1,231 participants (40.5%) aged 60–64 years and 88 participants (2.9%) aged 40–49 years. No statistically significant differences were observed in the age group distribution according to sleep duration. The late postmenopausal group included more participants (1,590; 52.3%) than the early postmenopausal group (1,448; 47.7%). While no differences were observed in postmenopausal duration distribution according to sleep duration, daily average sleep duration was significantly shorter in the late postmenopausal group (6.6 ± 0.03 hours) than in the early postmenopausal group (6.8 ± 0.03 hours; P < 0.001, data not shown). Education level, classified as college or above, high school, middle school, and elementary school or below (P < 0.001), and household income, classified as high, upper-middle, lower-middle, and low (P = 0.006), showed statistically significant differences among the four groups according to sleep duration. In particular, the VSSD and LSD groups were characterized by lower proportions of college or above education and high household income and higher proportions of elementary school or below education and low household income. No significant differences were observed among the four groups in terms of the distribution of economic activity status, alcohol consumption and smoking status, or aerobic physical activity. The results of the health examination data analysis are presented in Table 2. The VSSD group had higher mean BMI (P = 0.022), WC (P = 0.040), and HbA1c (P = 0.022) levels than the ASD and SSD groups. The mean HDL-chol was higher in the VSSD and SSD groups than in the ASD group (P = 0.030), whereas the mean LDL-chol was significantly lower in the order of the LSD, VSSD, ASD, and SSD groups (P = 0.014). No significant differences were observed among the four groups in the mean SBP, DBP, FBG, total cholesterol, and TG levels.

General characteristics according to sleep duration categories

Health indicators according to sleep duration categories
2. Meal skipping rates and energy intake comparison according to sleep duration
The distribution of meal skipping rates by meal type among the four groups according to sleep duration is presented in Table 3. The skipping of lunch meals showed no statistically significant differences among the four groups according to sleep duration, whereas skipping breakfast and dinner meals showed differences. Breakfast skipping rates were 15.5%, 16.6%, and 19.1% in the ASD, SSD, and VSSD groups, respectively, and 32.1% in the LSD group (P = 0.006). Dinner skipping rates were 5.2% and 5.3% in the ASD and SSD groups, respectively, and 7.9% and 10.7% in the VSSD and LSD groups, respectively (P = 0.013). The comparison results of energy intake through each meal and snack among the four groups are presented in Table 4. In model 1 without variable adjustment, energy intake through breakfast was lower in the VSSD group than in the ASD group (P = 0.014), and energy intake through dinner was lower in the VSSD group than in the ASD and SSD groups (P = 0.046). In model 2, with variable adjustment, no significant differences were observed among the four groups in energy intake through each meal (breakfast, lunch, and dinner) except snacks, while energy intake through snacks was higher in the VSSD group than in the ASD group (P = 0.033). The LSD group did not significantly differ from the other three groups in energy intake through all meals and snacks in models 1 and 2.

Meal skipping according to sleep duration categories

Energy intake by meal according to sleep duration categories
3. Nutrient and food group intake comparison according to sleep duration
The results of the comparison of energy and nutrient intake among the four groups according to sleep duration are presented in Table 5. In model 1, the total daily energy intake was lower in the VSSD group than in the ASD and SSD groups (P = 0.008). In model 2, the total daily energy intake remained lower in the VSSD group than in the ASD group (P = 0.037). Regarding the energy intake ratios of macronutrients (carbohydrates, protein, and fat), in model 1, the carbohydrate energy intake ratio was significantly higher in the VSSD group than in the ASD and SSD groups (P = 0.005). In contrast, the fat energy intake ratio was lower (P = 0.001). However, in model 2, no significant differences were observed. In model 1, the daily intakes of protein (P = 0.017), fat (P < 0.001), SFA (P = 0.003), MUFA (P < 0.001), PUFA (P = 0.015), and n-6 fatty acids (P = 0.013) were lower in the VSSD group than in the ASD and SSD groups. In model 2, the daily MUFA intake was lower in the VSSD group than in the ASD group (P = 0.017). In contrast, the daily potassium intake was higher in the VSSD group than in the ASD group (P = 0.045). The LSD group showed no significant differences from the other three groups in terms of total daily energy and nutrient intake in models 1 and 2. The results of the food group intake comparison among the four groups according to sleep duration are presented in Table 6. In model 1, daily nut and seed intake was lower in the SSD and VSSD groups than in the ASD group (P = 0.020). Meanwhile, daily meat intake was lower in the VSSD group than in the ASD group (P = 0.044). In model 2, the intakes of nuts and seeds and meat, which showed significant differences in model 1, showed no significant differences among the four groups. Daily potato and starch intake was higher in the VSSD group than in the ASD and LSD groups (P = 0.046), and daily vegetable intake was lower in the LSD group than in the SSD and VSSD groups (P = 0.038).

Energy and nutrient intake according to sleep duration categories

Food group intake by sleep duration category
4. Associations between sleep duration and nutrient and food group intake according to postmenopausal duration
The variables showing significant associations in the multinomial logistic regression analysis between nutrient and food group intake and sleep duration in the early and late postmenopausal groups are presented in Table 7. In the early postmenopausal group, higher intakes of sugars (P = 0.039), cholesterol (P < 0.001), and phosphorus (P = 0.023) were associated with a higher risk of LSD. Conversely, higher vitamin A intake was associated with a lower LSD risk (P = 0.020), and folate intake was associated with a lower VSSD risk (P = 0.010). In the late postmenopausal group, higher intakes of cholesterol (P = 0.004), vitamin A (P = 0.011), cereal grains (P < 0.001), fish and shellfish (P < 0.001), and beverages (P = 0.005) were associated with a higher LSD risk. In particular, a higher riboflavin intake was associated with a 4.776-fold higher LSD risk (P = 0.004). Conversely, higher intakes of water (P < 0.001) and eggs (P = 0.046) were associated with a lower LSD risk. The results of the polynomial regression analysis of the associations between nutrient and food group intakes and sleep duration in the early and late postmenopausal groups are presented in Table 8. In the early postmenopausal group, PUFA (β2 = –0.0006068, P = 0.049) and riboflavin (β2 = –0.1009126, P = 0.032) intake showed negative nonlinear relationships with sleep duration above 19.86 g/day and 1.76 mg/day, respectively, while linear relationships were not significant. Sleep durations at respective inflection points were 7.19 and 7.08 hours. Water (β1 = 0.0008693, P = 0.001; β2 = –0.0000004, P < 0.001) and alcoholic beverage (β1 = 0.0013586, P = 0.001; β2 = –0.0000008, P = 0.001) intake showed positive linear relationships with sleep duration below 1,086.63 and 849.13 g/day, respectively, and negative nonlinear relationships above these levels. Sleep durations at respective inflection points were 7.19 and 7.52 hours. In the late postmenopausal group, sugar (β1 = 0.0056061, P < 0.001; β2 = –0.0000222, P < 0.001) and beverage (β1 = 0.0006865, P = 0.011; β2 = –0.0000007, P < 0.001) intake showed positive linear relationships with sleep duration below 126.33 and 490.36 g/day, respectively, and negative nonlinear relationships above these levels. The sleep duration at the respective inflection points was 7.01 and 6.98 hours. Fruit intake (β2 = –0.0000002, P < 0.001) showed a negative nonlinear relationship with sleep duration above 804.50 g/day, while the linear relationship was not significant. The sleep duration at the corresponding inflection point was 6.90 hours. Sodium showed a negative linear relationship (β1 = –0.0001268, P = 0.014) and a positive nonlinear relationship (β2 = 0.0000000, P = 0.046) with sleep duration. However, since the β₂ value converged to 0, the inflection point and corresponding sleep duration could not be calculated.

Associations of dietary intake with categories of sleep duration by postmenopausal period

Associations of dietary intake with sleep duration by postmenopausal period
DISCUSSION
This study was conducted to identify the dietary factors associated with sleep duration in postmenopausal middle-aged women by integrating five years of raw data from the KNHANES. The intake of specific food groups and nutrients was associated with sleep duration, with characteristic results emerging according to the time since menopause. In addition, meal-skipping patterns and energy intake from snacks differed according to sleep duration.
The proportion of short sleepers (46.5%) was higher than in premenopausal women (31.9%) but slightly lower than in the general postmenopausal population (50.1%) [21], indicating that insufficient sleep is prevalent among Korean postmenopausal middle-aged women. The VSSD and LSD groups had low education levels and household income. Populations with low socioeconomic status characteristically exhibit poor sleep quality and quantity and SSD due to unhealthy lifestyles, high stress levels, and psychological factors [7, 22]. Furthermore, low education and household income are observed not only in short-sleep groups but also in long-sleep groups, as unemployed populations tend to have lower education levels, income, and assets and sleep longer [7, 23, 24].
Previous studies on the relationship between sleep duration and obesity have shown that SSD is associated with obesity, including increased visceral fat [25] and a higher risk of abdominal obesity [26]. In this study, the VSSD group exhibited high average BMI and WC and blood HbA1c levels, whereas energy intake levels were lower. This finding suggests that the association between sleep deprivation and obesity is due to complex interactions in the endocrine system. Experimental sleep restriction studies have reported disruptions in energy metabolism and endocrine function, including decreased physical activity [27] and reduced energy expenditure due to increased cortisol secretion [28]. The association between VSSD and high HbA1c levels observed in the Fukuoka Diabetes Registry study [29] and the Nurses’ Health Study [30] also suggests that insulin resistance due to sleep deprivation leads to increased body fat mass. The VSSD group exhibited elevated snack energy intake, frequent skipping of breakfast and dinner, and greater consumption of potatoes and starchy foods, which is consistent with research showing that repeated bedtime restriction has an appetite-enhancing effect on high-carbohydrate foods, such as snacks, without significantly affecting overall energy intake [14]. Additionally, sleep-deprived individuals are more likely to deviate from traditional three-meals-a-day patterns, have more irregular eating patterns, and consume snacks more frequently, while adopting nocturnal lifestyles that replace regular meals with snacks consumed in the late evening and at night [4, 14]. As snacks are generally nutritionally unbalanced and have a high energy content, snack-dependent eating patterns may lead to nutritional imbalances [31].
The Mediterranean diet includes fresh vegetables, fruits, whole grains, olive oil, fish, and nuts. It is relatively high in fat, with MUFAs accounting for over 20% of total energy intake [17]. In women, who experience sleep disorders more frequently than men, the abundant PUFA and high MUFA intake from the Mediterranean diet may help improve sleep quality, and nuts, having high melatonin content among plant foods, may positively influence sleep regulation [17, 32]. The low MUFA and nut intake observed in the VSSD group indirectly support these research findings; however, well-designed intervention studies are needed to determine their independent effects on improving sleep quality.
In this study, a high potassium intake was observed in the VSSD group, which is presumed to be due to the high intake of potatoes and starchy foods that contribute significantly to potassium intake. However, previous studies on the relationship between sleep and potassium have shown opposite results. In women, potassium intake was positively correlated with sleep duration and quality improvement, while low potassium intake was associated with poor sleep quality [33]. Additionally, it was shown in patients with diabetes that magnesium and potassium supplementation affected serum cortisol and melatonin levels, which were associated with increased sleep duration [34]. To clarify the relationship between sleep duration and potassium, it is necessary to comprehensively consider the interactions with micronutrients such as magnesium, calcium, and vitamin D, which have positive effects on improving sleep quality, and components such as caffeine, sodium, and benzodiazepines, which have negative effects. Meanwhile, the low vegetable intake observed in the LSD group showed a similar trend to the low vegetable intake frequency in long-sleep groups reported in an observational study of older Chinese individuals [35].
Based on accumulated data on follicle-stimulating hormone and estrogen concentrations, women’s reproductive age can be classified into a 10-stage change system [20]. Sleep patterns and characteristics vary according to the stage of reproductive change. Vasomotor symptoms such as hot flashes, a physiological change occurring during menopause, are presumed to be primarily caused by estrogen decrease and continue to impair sleep quality during the menopausal transition period and for some time thereafter [36]. During perimenopause, which includes the menopausal transition period and some early postmenopause, insomnia prevalence increases significantly owing to rapid estrogen decline [8]. However, in late postmenopause, prolonged low estrogen states in the nervous system can cause sleep disorders independently of aging through physical pain, bruxism, anxiety, and depression [13]. These changes are associated with nutrient metabolism, nervous system reactivity, and sleep-wake regulation mechanisms, as well as various factors such as chronic disease morbidity and dietary habit changes, making the relationship between sleep and dietary factors more complex according to the duration since menopause [37]. Among studies investigating the relationship between nutrient and food intake according to sleep duration using the KNHANES, some have shown no significant associations in postmenopausal women, unlike in premenopausal women [19, 21]. All these studies share the common feature of not considering the duration since menopause. As physical and physiological changes continue even after menopause, studies targeting menopausal women must consider the duration since menopause to ensure analytical accuracy. The postmenopausal period can be broadly divided into two stages: early (< 6 years) and late (thereafter) [20]. In this study, targeting postmenopausal middle-aged women, the relationship between sleep duration and nutrient and food intake appeared characteristically according to the duration since menopause. In the late postmenopausal group, cholesterol, riboflavin, and intake of cereal grains, fish and shellfish, and beverages were associated with a high LSD risk. In contrast, in the early postmenopausal group, cholesterol intake was significantly associated with a high LSD risk, and folate intake was associated with a low VSSD risk.
In a previous study of 459 postmenopausal women, cholesterol intake was found to be negatively correlated with sleep duration [38]. High cholesterol intake was also observed in studies of patients with obesity and social jetlag [39], with the relationship between cholesterol and sleep presented multiple times. Systematic literature reviews on sleep duration have shown that short and long sleep are associated with an increased risk of mortality and chronic diseases such as cardiovascular disease, stroke, diabetes, and obesity [1, 5]. This finding suggests that dietary factors such as cholesterol interact with the correlation between long sleep and chronic diseases. The risk of hypertension is highest 5–9 years after menopause, the risk of hypertriglyceridemia increases 10–14 years after menopause, and the risk of metabolic syndrome continues to increase up to 14 years after menopause [40], making these results meaningful.
In the early postmenopausal group, when insomnia significantly increases [8], riboflavin intake of ≥ 1.76 mg/day had a significant negative nonlinear relationship with sleep duration, with the corresponding sleep duration being 7.08 hours, which is at the lower boundary level of normal sleep. Given that the riboflavin intake of women aged 50–64 years reported in the 2022 KNHANES [41] was 1.37 ± 0.03 mg/day and the recommended intake of riboflavin [42] is 1.2 mg/day, this corresponds to a level higher than typical intake. Therefore, increased riboflavin intake in the high-level range may be associated with sleep reduction to levels shorter than the normal sleep duration, suggesting a nonlinear relationship due to the action of other variables. Riboflavin acts directly on the central nervous system and functions as a precursor to the brain cell electron transport chain and as a coenzyme in energy metabolism processes. It is used clinically for the prevention and treatment of migraines and pediatric neuropathy [43]. Thus, riboflavin may be involved in sleep processes that result from complex physiological interactions in the nervous system.
The range of PUFA intake showing a significant negative nonlinear relationship with sleep duration in the early postmenopausal group was ≥ 19.86 g/day, corresponding to a higher level than the average PUFA intake (10.4 ± 0.28 g/day) for women aged 50–64 years. This finding suggests that increased PUFA intake is not significantly associated with sleep duration reduction in the typical intake range. PUFA are a component of cell membranes involved in various physiological functions such as nerve transmission, inflammatory responses, and circadian rhythm regulation, and n-3 fatty acid intake affects sleep duration through melatonin and serotonin synthesis [44]. Meanwhile, systematic literature reviews on the relationship between alcohol intake and sleep duration have shown that low alcohol intake is associated with increased sleep duration, emphasizing the importance of dosage [45]. However, in the early postmenopausal group in this study, alcohol intake was positively and linearly related to sleep duration at levels below 849.13 g/day, which is more than 20 times higher than the average alcohol intake of 32.5 g/day for women aged 50-64 years reported by the 2022 KNHANES [41].
In the late postmenopausal group, the intake levels of sugars and beverages that became inflection points for positive linear and negative nonlinear relationships with sleep duration were 126.33 g/day and 490.36 g/day, respectively. These levels are twice or more than the average intake of 58.0 ± 1.8 and 212.8 ± 17.1 g/day for women aged 50–64 years reported in the 2022 KNHANES [41]. Blood sugar increases the bioavailability of serotonin, which has important effects on sleep initiation, maintenance, and cycles, while directly affecting sleep centers. Furthermore, it is reported to have a positive linear relationship with sleep duration [46], which may be related to the results of this study showing a positive linear relationship between sugar intake and sleep duration in the typical range.
Analysis of the relationship between sleep duration and dietary factors in postmenopausal women aged 40–64 years revealed that the VSSD group had higher energy intake from snacks and more frequent skipping of breakfast and dinner, despite relatively low total energy intake levels. In the early postmenopausal group, above-average PUFA and riboflavin intakes showed negative nonlinear associations with sleep duration, and in the late postmenopausal group, riboflavin intake was strongly associated with an increased risk of LSD. Cholesterol intake was associated with a higher LSD risk in both early and late postmenopausal groups.
Limitations
This study has several limitations. First, as a cross-sectional study using KNHANES data, causal relationships could not be established; only associations could be interpreted. Second, the LSD group with only 56 participants may still pose a risk of low estimation reliability owing to sampling errors despite weight application. Third, survey methods differed. The 8th KNHANES collected food intake information from the day before the survey regardless of the day of the week, whereas the 9th KNHANES collected intake information from two days before the survey during weekdays, referring to photos or meal records. Additionally, the 24-hour recall method has limitations in terms of recall bias and representativeness of daily meals. Fourth, sleep duration was self-reported data with concerns regarding response and recall bias. Sleep deprivation due to sleep disorders such as insomnia and insufficient sleep due to busy schedules were not distinguished. Moreover, several factors that may influence sleep duration—such as medical conditions, pain, stress, depression, sleep environment, caffeine intake, hormonal status, and medications (e.g., antidepressants or drugs for insomnia and obstructive sleep apnea)—were not included as covariates in the analysis. Fifth, data on fasting time before sleep and total daily physical activity time, which are vital meal-related factors related to sleep, were not analyzed as variables. Additionally, water intake, which showed a significant association with sleep duration, was excluded from the interpretation because the KNHANES data included water content retained in foods, not including drinking water or water added during cooking.
Conclusion
Dietary factors associated with sleep duration in postmenopausal middle-aged women aged 40–64 years varied according to the duration since menopause. Moreover, specific nutrients or food groups demonstrated different positive or negative associations with sleep duration at levels higher than the average intake. These results suggest that differentiated nutritional strategies considering the duration since menopause are needed to improve sleep quality in menopausal women who commonly experience sleep deficiencies.
Notes
CONFLICT OF INTEREST
There are no financial or other issues that might lead to conflict of interest.
FUNDING
This research was supported by a 2023 Academic Research Grant of Soongeui Women’s University.
DATA AVAILABILITY
Data supporting the findings of this study are openly available in the KNHANES at https://knhanes.kdca.go.kr/knhanes/main.do.