Warning: mkdir(): Permission denied in /home/virtual/lib/view_data.php on line 81

Warning: fopen(upload/ip_log/ip_log_2024-09.txt): failed to open stream: No such file or directory in /home/virtual/lib/view_data.php on line 83

Warning: fwrite() expects parameter 1 to be resource, boolean given in /home/virtual/lib/view_data.php on line 84
Evaluation of the Quality Attribute and Satisfaction on School Foodservice in 2010

Evaluation of the Quality Attribute and Satisfaction on School Foodservice in 2010

Article information

Korean J Community Nutr. 2013;18(5):491-504
Publication date (electronic) : 2013 October 31
doi : https://doi.org/10.5720/kjcn.2013.18.5.491
Department of Food & Nutrition, Yonsei University, Seoul, Korea.
1Department of Foodservice Industry, Hanyang Woman's University, Seoul, Korea.
2Department of Food & Nutrition, Shingu University, Kyeonggi, Korea.
3Research Center for Food, Nutrition and Foodservice Management, Yonsei University, Seoul, Korea.
Corresponding author: Hye-Young Kim, Research Center for Food, Nutrition and Foodservice Management, Yonsei University, 50 Yonsei-ro, Seodaemun-gu, Seoul 120-749, Korea. Tel: (02) 2123-4276, Fax: (02) 363-3430, tilooc@chol.com
Received 2013 August 30; Revised 2013 October 17; Accepted 2013 October 28.

Abstract

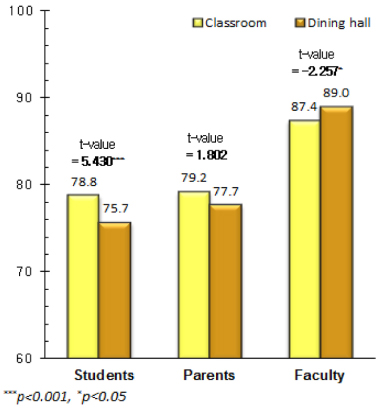
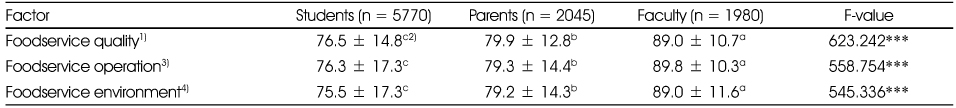
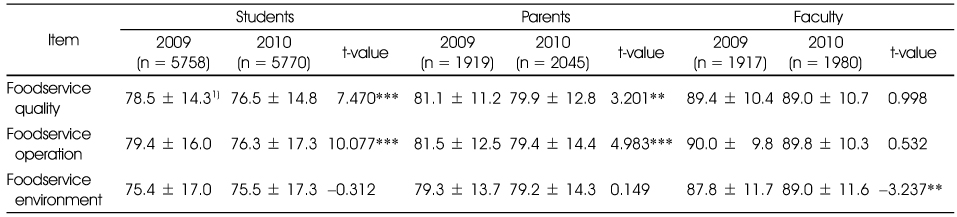
The purposes of this study were to analyze the quality attributes, quality factors and customer satisfaction in school foodservice and to provide suggestions for improving school foodservice environments. The survey was distributed to different respondents (5,771 students, 2,045 parents, and 1,981 faculty members) at different types of schools (elementary school, middle school, and high school) on September 2010 in 16 cities and provinces. The data were analyzed using SPSS for descriptive analysis, one-way ANOVA, t-test and multiple linear regression analysis. First, all foodservice quality attributes were significant different by respondents and the faculty had higher scores than parents and students. A comparison of scores by respondents and distribution place demonstrated that classroom of student and parents had a higher score for quality attributes. The overall satisfaction with school foodservice was significant different by respondents and higher for classroom than for dining hall for student and parents. In comparison of annual data, there was decreased overall satisfaction and quality attributes in student and parents. Second, in the regression results, which showed the effects of the foodservice quality attributes on overall satisfaction by respondents and distribution place, improvements of 'food taste', 'pleasant foodservice environment', and 'kindness of employee' would increase satisfaction in most of the respondents. Third, the overall satisfaction with school foodservice was higher for nutrition teachers than dietitians for students and faculty. Therefore, the operators will need to make different efforts based on each customer needs to improve the overall satisfaction on school foodservice.

Notes

This research was supported by a Ministry of Education and Science Technology.

References

1. Choo YJ, Ryu SH, Yoon JH. Dietitian's job satisfaction and perception of foodservice quality in elementary schools. Korean J Nutr 2006;39(2):192–200.
2. Jang HR, Kim HYL. Survey on the satisfaction degree for school lunch program of elementary school students in Yongin. Korean J Food Nutr 2005a;18(2):155–160.
3. Jang MR, Kim JY. Comparison of importance and performance to the school lunch service according of male and female middle school students in the Gangwon province. J Korean Diet Assoc 2005b;11(1):95–104.
4. Kim KA, Kim SJ, Jung LH, Jeon ER. Degree of satisfaction on the school foodservice among the middle school students in Gwangju and Chonnam area. Korean J Soc Food Cookery Sci 2002;18(6):579–585.
5. Yi BS. Comparative analysis of the quality attributes affecting students' satisfaction on school lunch service of middle school by year. Korean J Community Nutr 2012;17(4):479–493.
6. Lee HS, Jang MH. Survey of students satisfaction with school food-service programs in Gangwon province. Korean J Food Nutr 2005;18(3):175–191.
7. Lee KH, Park ES. School foodservice satisfaction and menu preferences of high school students: Focused on Iksan, Cheonbuk. Korean J Community Nutr 2010;15(1):108–123.
8. Ministry of Education, Science and Technology. Survey on satisfaction with school foodservice 2009. p. 6–8.
9. Ministry of Education, Science and Technology. School meals hygiene guidelines 2010. p. 27–41.
10. Mo SJ, Suh JS, Lyu ES. The evaluation of the perception of students and employees for foodservice characteristics of in high schools in the Busan area. Korean J Food Cookery Sci 2005;21(2):250–262.
11. Oh YM, Kim MH, Chung JS. The study of satisfaction, meal preference and improvement on school lunch program of middle school boys and girls in Jeonju. J Korean Diet Assoc 2006;12(4):358–368.
12. Parasuraman A, Zeothmal VA, Berry LL. SERVQUAL: A multiple-item scale for measuring consumer perceptions of service quality. J Retailing 1985;64(1):12–40.
13. Park MK, Yang IS, Yi BS, Kim YS. Analysis of the quality attributes and the customer satisfaction in school foodservice by school type and distribution place. J Korean Diet Assoc 2010;16(2):83–99.
14. Park KJ, Jang MR. Survey on satisfaction of fifth and sixth grade students from elementary school foodservice in Won-ju. J Korean Diet Assoc 2008;14(1):13–22.
15. Song HJ, Moon HK. Comparing school lunch program served at dining room with program at classroom for sanitation and contentment at one middle school. Korean J Community Nutr 2010;15(3):369–378.
16. Teas RK. Expectation, performance evaluation, and consumers' perception of quality. J Market 1993;57(4):18–34.
17. Yang IS, Park MK. Identifying the quality attributes affecting customers satisfaction of school foodservice by city and province: student, parents, and faculty. J Korean Diet Assoc 2008;14(3):302–318.
18. Yang IS, Yi BS, Cha JA, Han KS, Chae IS, Lee JM. Foodservice in institution Paju: Kyomunsa; 2010. p. 39–40.
19. Yi BS, Yang IS, Park MK. Annual analysis on quality attributes and customer satisfaction in school foodservice. Korean J Nutr 2009;42(8):770–783.
20. Yoon J, Choo YJ, Chung SJ, Ryu SH. Satisfaction of elementary students earing school lunch; Association with level of involvement in school lunch service. Korean J Community Nutr 2005;10(5):668–676.

Article information Continued

Funded by : Ministry of Education and Science Technology

Fig. 1

Comparison of overall satisfaction by respondents and distribution place.

Fig. 2

Comparison of overall satisfaction by respondents.

Fig. 3

Comparison of overall satisfaction by foodservice competent type : dietitians vs nutrition teachers.

Table 1

Comparison of the quality attributes by respondents

Table 1

1) Mean ± SD

abc: Duncan's multiple comparison, ***: p < 0.001

Table 2

Comparison of the quality attributes by respondents and distribution place

Table 2

1) Mean ± SD

*: p < 0.05, **: p < 0.01, ***: p < 0.001

Table 3

Comparison of the quality factors by respondents

Table 3

1) Foodservice quality: food taste, proper food temperature, adequate food quantity, menu variety, nutritional foods, food sanitation, quality of food ingredients

2) Mean ± SD

3) Foodservice operation: teacher's guidance on foodservice behavior, entertains suggestions offered to foodservice, providing information on foodservice

4) Foodservice environment: steady distribution, pleasant foodservice environment, kindness of employees

abc: Duncan's multiple comparison

***: p < 0.001

Table 4

Comparison of the quality factors by respondents and distribution place

Table 4

1) Foodservice quality: food taste, proper food temperature, adequate food quantity, menu variety, nutritional food, food sanitation, quality of food ingredients

2) Mean ± SD

3) Foodservice operation: teacher's guidance on foodservice behavior, entertains suggestions offered to foodservice, providing information on foodservice

4) Foodservice environment: steady distribution, pleasant foodservice environment, kindness of employees

** p < 0.01, ***: p < 0.001

Table 5

Comparison of overall satisfaction by respondents

Table 5

1) Mean ± SD

abc: Duncan's multiple comparison, ***: p < 0.001

Table 6

Comparison of annual quality attributes by respondents

Table 6

1) Mean ± SD

*: p < 0.05, **: p < 0.01, ***: p < 0.001

Table 7

Comparison of annual quality factors by respondents

Table 7

1) Mean ± SD

**: p < 0.01, ***: p < 0.001

Table 8

The effect of quality attributes on students' overall satisfaction in school foodservice

Table 8

Independent variable: Quality attributes, Dependent variable: Overall satisfaction

β1: Unstandardized coefficient β / β2: Standardized coefficient β

*: p < 0.05, **: p < 0.01, ***: p < 0.001

Table 9

The effect of quality factors on overall satisfaction in school foodservice by distribution place

Table 9

Independent variable: Quality attributes, Dependent variable: Overall satisfaction

β1: Unstandardized coefficient β / β2: Standardized coefficient β

*: p < 0.05, **: p < 0.01, ***: p < 0.001

Table 10

Comparison of quality attributes by foodservice competent type: dietitians vs. nutrition teachers

Table 10

1) Mean ± SD

abc: Duncan's multiple comparison

**: p < 0.01, ***: p < 0.001