Warning: mkdir(): Permission denied in /home/virtual/lib/view_data.php on line 81

Warning: fopen(upload/ip_log/ip_log_2024-09.txt): failed to open stream: No such file or directory in /home/virtual/lib/view_data.php on line 83

Warning: fwrite() expects parameter 1 to be resource, boolean given in /home/virtual/lib/view_data.php on line 84
Association of Whole Grain Consumption with Socio-Demographic and Eating Behavior Factors in a Korean Population: Based on 2007-2008 Korea National Health and Nutrition Examination Survey

Association of Whole Grain Consumption with Socio-Demographic and Eating Behavior Factors in a Korean Population: Based on 2007-2008 Korea National Health and Nutrition Examination Survey

Article information

Korean J Community Nutr. 2011;16(3):353-363
Publication date (electronic) : 2011 June 30
doi : https://doi.org/10.5720/kjcn.2011.16.3.353
Department of Food & Nutrition, Sungshin Women's University, Seoul, Korea.
Corresponding author: Seungmin Lee, Department of Food & Nutrition, Sungshin Women's University, 147 Mia-dong, Kangbuk-gu, Seoul 142-100, Korea. Tel: (02) 920-7671, Fax: (02) 920-2076, smlee@sungshin.ac.kr
Received 2011 June 09; Revised 2011 June 13; Accepted 2011 June 16.

Abstract

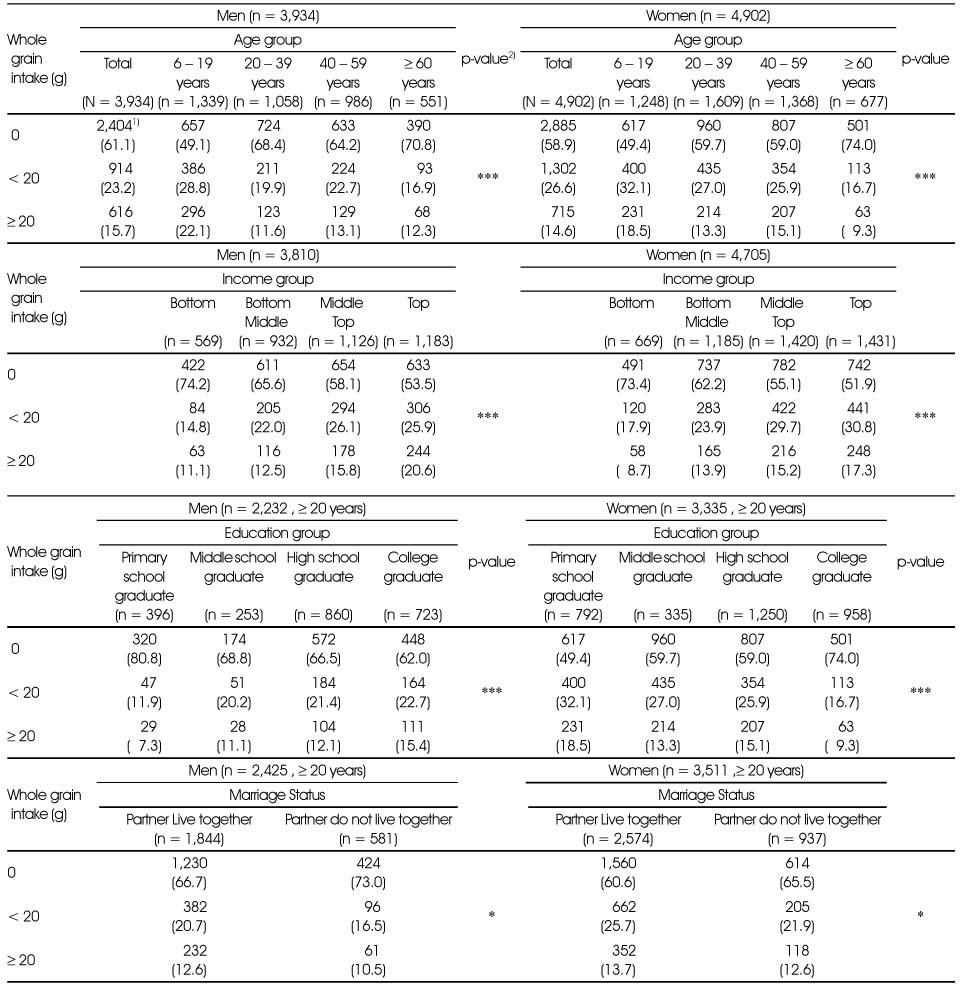
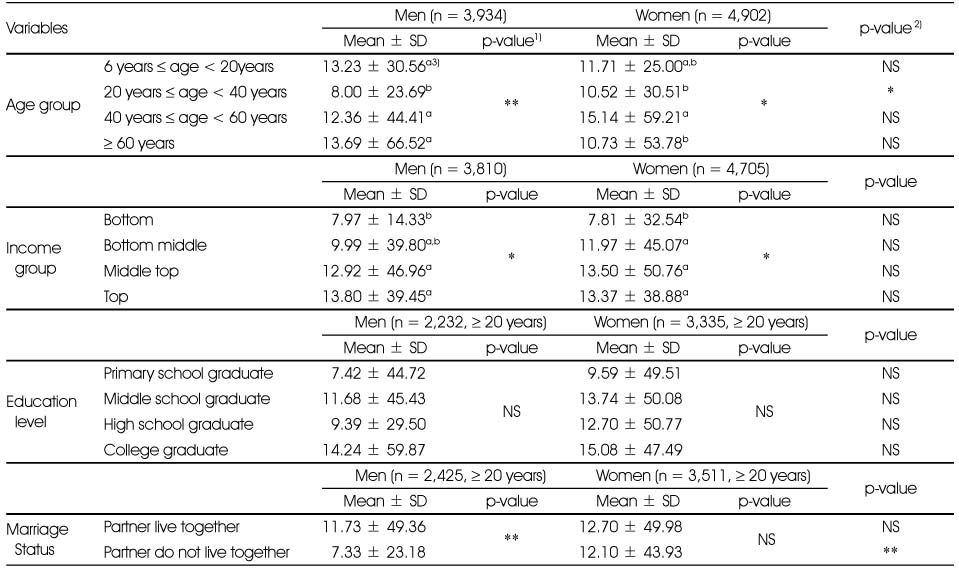
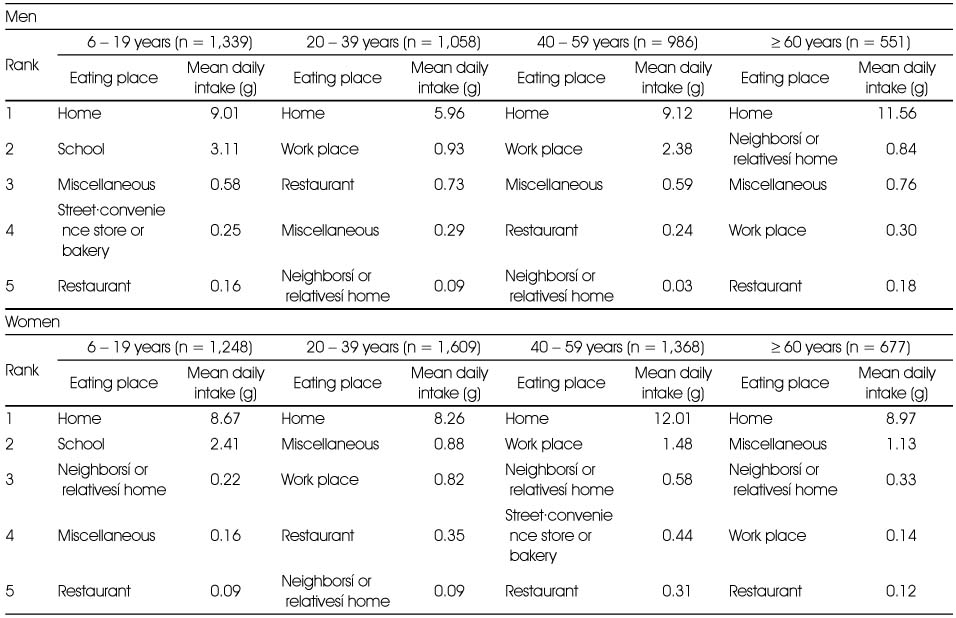
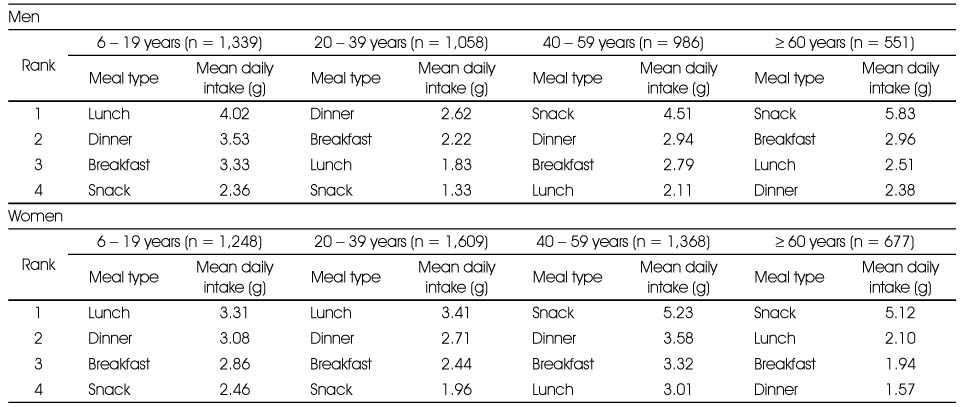
The objective of the current study was to examine associations of whole grain consumption with socio-demographic (i.e.: sex, age, household income, education, marriage status) and certain eating behavior factors (i.e.: dish source, eating place, meal type) among a generally healthy Korean population. Using twenty-four hour recall data from the 2007-2008 National Health and Nutrition Examination Surveys, whole grain intake (g/day) was calculated for a total of 8,836 generally healthy Koreans aged 6 years and higher. The study subjects had very low whole grain intake. Specifically approximately 60% of the subjects reported no whole grain consumption on the survey day, and mean daily intake ranged from 8.0 g to 15.1 g in different gender and age groups. Living with a spouse was found to be a positive environment factor for whole grain consumption, especially among men. As household income levels increased, whole grain consumption status also improved. The proportion of non-consumer was lowest in a 6-19 year group, and mean intake amount was highest in middle-aged adults. Major dish sources for whole grain consumption included boiled rice with mixed grains, corn, boiled rice with brown rice, cereal products, and other types of boiled rice. It was found that whole grain consumption was highly affected by eating places rather than meal types. The best contributing eating place was home in each age and gender group. The study findings may be useful in planning nutrition education strategy and formulating dietary behavior guidelines for whole grain consumption improvement.

Notes

This research was conducted by the generous financial support of the Youlchon Foundation (Nongshim Corporation and its affiliated companies) in Korea.

References

1. Anderson JW, Hanna TJ, Peng X, Kryscio RJ. Whole grain foods and heart disease risk. J Am Coll Nutr 2000. 193 Suppl. 291S–299S.
2. Albertson AM, Tobelmann RC. Consumption of grain and whole grain foods by an American population during the years 1990-92. J Am Diet Assoc 1995. 95(6)703–704.
3. Bakke A, Vickers Z. Consumer liking of refined and whole wheat breads. J Food Sci 2007. 72(7)S473–S480.
4. Burgess-Champoux TL, Rosen R, Marguart L, Reicks M. The development of psychosocial measures for whole-grain intakeamong children and their parents. J Am Diet Assoc 2008. 108(4)714–717.
5. Chase K, Reicks M, Jones JM. Applying the theory of planned behavior to promotion of whole-grain foods by dietitians. J Am Diet Assoc 2003. 103(12)1639–1642.
6. Chase K, Reicks M, Smith C, Henry H, Reimer K. Use of the think-aloud method to identify factors influencing purchase of bread and cereals by low-income African American women and implications for whole-grain education. J Am Diet Assoc 2003. 103(4)501–504.
7. Cleveland LE, Moshfegh AJ, Albertson AM, Goldman JD. Dietary intake of whole grains. J Am Coll Nutr 2000. 193 Suppl. 331S–338S.
8. de Munter JS, Hu FB, Spiegelman D, Franz M, van Dam RM. Whole grain, bran, and germ intake and risk of type 2 diabetes: a prospective cohort study and systematic review. PLoS Med 2007. 4(8)e261.
9. Flint AJ, Hu FB, Glynn RJ, Jensen MK, Franz M, Sampson L, Rimm EB. Whole grains and incident hypertension in men. Am J Clin Nutr 2009. 90(3)493–498.
10. Fung TT, Hu FB, Pereira MA, Liu S, Stampfer MJ, Colditz GA, Willett WC. Whole-grain intake and the risk of type 2diabetes: a prospective study in men. Am J Clin Nutr 2002. 76(3)535–540.
11. Gellar L, Rovner AJ, Nansel TR. Whole grain and legume acceptability among youths with type 1 diabetes. Diabetes Educ 2009. 35(3)422–427.
12. Jacobs DR Jr, Marquart L, Slavin J, Kushi LH. Whole-grain intake and cancer: an expanded review and meta analysis. Nutr Cancer 1998. 30(2)85–96.
13. Jones JM, Reicks M, Adams J, Fulcher G, Weaver G, Kanter M, Marquart L. The importance of promoting a whole grain food message. J Am Coll Nutr 2002. 21(4)293–297.
14. Lacey JM. Enhancing students' understanding of whole cereal grains in a university experimental foods course. J Nutr Educ Behav 2007. 39(4)235–236.
15. Liu S, Stampfer MJ, Hu FB, Giovannucci E, Rimm E, Manson JE, Hennekens CH, Willett WC. Whole-grain consumption and risk of coronary heart disease: result from the Nurses Health Study. Am J Clin Nutr 1999. 70(3)412–429.
16. Marquart L, Pham AT, Lautenschlager L, Croy M, Sobal J. Beliefs about whole-grain foods by food and nutrition professionals, health club members, and special supplemental nutrition program for women, infants, and children participants/state fair attendees. J Am Diet Assoc 2006. 106(11)1856–1860.
17. Meyer KA, Kushi LH, Jacobs DR Jr, Slavin J, Sellers TA, Folsom AR. Carbohydrates, dietary fiber, and incident type 2 diabetes in older women. Am J Clin Nutr 2000. 71(4)921–930.
18. Content of Korea National Health & Nutrition Examination Survey. Ministry for Health, Welfare and Family Affairs & Center for Disease Control and Prevention 2011. cited 2011 April 20. Available from http://knhanes.cdc.go.kr/.
19. Montonen J, Knekt P, järvinen R, Aromaa A, Reunanen A. Whole grain and fiber intake and the incidence of type 2 diabetes. Am J Clin Nutr 2003. 77(3)622–629.
20. O'Neil CE, Nicklas TA, Zänovec M, Cho S. Whole-grain consumption is associated with diet quality and nutrient intake in adults: the National Health and Nutrition Examination Survey, 1999-2004. J Am Diet Assoc 2010. 110(10)1461–1468.
21. Eating well with Canada's food guide. The Minister of Health Canada 2007. cited 2009 September 25. Available from http://www.hc-sc.gc.ca/fn-an/food-guide-aliment/index-eng.php.
22. The eatwell plate. U.K. Food Standards Agency 2007. cited 2009 September 25. Available from http://www.eatwell.gov.uk/healthydiet/eatwellplate.
23. U.S. Department of Health and Human Services & U.S. Department of Agriculture. Dietary guidelines for American 2005. 6th edth ed. Washington, DC: Government Printing Office; 52–55.

Article information Continued

Table 1

Distribution of whole grain intake levels by socio-demographic factors

Table 1

1) N (%)

*: p < 0.05, ***: p < 0.001 by chi-square test for difference between socio-demographic status within gender

Table 2

Mean whole grain intake (g/day) by socio-demographic factors

Table 2

1) NS: not significant, *: p < 0.05, **: p < 0.01 by ANOVA or t test for difference between socio-demographic status within gender

2) NS: not significant, *: p < 0.05, **: p < 0.01 by t test for difference between gender within a row

3) Different letters represent statistical difference by Duncanís multiple comparison test

Table 3

Top 5 dish items for whole grain intake by gender and age group

Table 3

Table 4

Eating places for whole grain intake by gender and age group

Table 4

Table 5

Meal type for whole grain intake by gender and age group

Table 5