Warning: mkdir(): Permission denied in /home/virtual/lib/view_data.php on line 81

Warning: fopen(upload/ip_log/ip_log_2024-11.txt): failed to open stream: No such file or directory in /home/virtual/lib/view_data.php on line 83

Warning: fwrite() expects parameter 1 to be resource, boolean given in /home/virtual/lib/view_data.php on line 84
A Study on the Health and Nutritional Characteristics according to Household Income and Obesity in Korean Adults Aged over 50 -Based on 2005 KNHANES-

A Study on the Health and Nutritional Characteristics according to Household Income and Obesity in Korean Adults Aged over 50 -Based on 2005 KNHANES-

Article information

Korean J Community Nutr. 2012;17(4):463-478
Publication date (electronic) : 2012 August 31
doi : https://doi.org/10.5720/kjcn.2012.17.4.463
Department of Food Science & Nutrition, The Catholic University of Korea, Bucheon, Korea.
Corresponding author: Hye-Kyeong Kim, Department of Food Science & Nutrition, The Catholic University of Korea, 43-1 Yeokgok 2-dong, Wonmi-gu, Bucheon, Gyeonggi-do 420-743, Korea. Tel: (02) 2164-4314, Fax: (02) 2164-4314, hkyeong@catholic.ac.kr
Received 2012 May 25; Revised 2012 July 21; Accepted 2012 July 30.

Abstract

This study investigated the health and nutritional characteristics according to household income level and obesity in Koreans aged over 50 years based on the 2005 National Health and Nutrition Examination Survey. Subjects were classified into 3 groups by average household income with reference to the minimum monthly living expenses (MLE): low (n = 319, < 100% MLE), middle (n = 222, < 200% MLE), high (n = 411, ≥ 200% MLE) and each group was compared by BMI index. With increasing income level, the prevalence of systolic hypertension and hyperlipidemia was increased. In the low income group, serum total cholesterol, triglycerides, and fasting glucose were higher in the obese compared with the normal. In the middle and high income groups, the prevalence of hyperlipidemia and diastolic hypertension were higher in the obese. Subjects had nutritional imbalance, such as inadequate intake of calcium and potassium. With increasing income level, the percentages of protein and fat to total calorie were increased in addition to the intakes and density of nutrients. The obese in the low income group had higher intakes of energy, protein, phosphorus and higher consumption frequency of cereals and potatoes compared with the normal. It was shown that the obese of the middle and high income groups tended to have lower consumption frequency of Korean cabbage and higher frequency of fruits. The obese of high income group also had binge drinking habit. Therefore, this study suggests that specific approaches based on economic status should be considered in developing nutrition education program for the elderly.

References

1. Choi J, Moon HK. Comparison of dietary patterns by sex and urbanization in different economic status. Korean J Community Nutr 2008. 13(3)346–358.
2. Choi Y, Kim C, Park YS. The effect of nutrition education program in physical health, nutritional status and health-related quality of life of the elderly in Seoul. Korean J Nutr 2007. 40(3)270–280.
3. Dietz WH. Birth weight, socioeconomic class, and adultadiposity among African Americans. Am J Clin Nutr 2000. 72(2)335–336.
4. Drewnowski A, Darmon N. Food choices and diet costs: an economic analysis. J Nutr 2005. 135(4)900–904.
5. Drewnowski A, Specter SE. Poverty and obesity : The role of energy density and energy cost. Am J Clin Nutr 2004. 79(1)6–16.
6. Friedewald WT, Levy RI, Fredrickson DS. Estimation of the concentration of low density lipoprotein cholesterol without use of the preoperative ultra centrifuge. Clin Chem 1972. 18(6)499–502.
7. Guh DP, Zhang W, Bansback N, Amarsi Z, Birmingham CL, Anis AH. The incidence of co-morbidities related to obesity and overweight: a systematic review and meta-analysis. BMC Public Health 2009. 988–107.
8. Gyeonggi Research Institute. An analysis on the actual conditions of the low-income and strategies to overcome their poverty in GyeongGi-Province 2008.
9. Hwang JY, Ru SY, Ryu HK, Park HJ, Kim WY. Socioeconomic factors relating to obesity and inadequate nutrient intake in women in low income families residing in Seoul. Korean J Nutr 2009. 42(2)171–182.
10. Jelliffe DB. The assessment of the nutritional status of the community 1966. Geneva: WHO;
11. Jeon HS. Analysis of obesity factors in Korean middle aged men and women : 2001 Korean National Health and Nutrition Examination Survey 2005. Catholic University of Korea; 11–16. Dissertation.
12. Kang Y, Kim M, Lee E. The relationship of perceived health status, activities of daily living and nutrition status in the community-dwelling Korean elderly. Taehan Kanho Hakhoe Chi 2008. 38(1)122–130.
13. Kim BH, Lee JW, Lee Y, Lee HS, Jang YA, Kim CI. Food nutrient consumption patterns of the Korean adult population by income level-2001 National Health and Nutrition Survey. Korean J Community Nutr 2005. 10(6)952–962.
14. Kim KM, Kwon JS. Nutritional and health status of the elderly living in Songnam-II. Dietary habits and nutrient intake-. Korean J Food Nutr 2004. 17(4)420–428.
15. Kook SR, Park YS, Ko WK, Kim SM, Lee DJ, Kang HC, Yoon BB. Relationship of body fat, lipid, blood pressure, glucose in serum to waist-hip ratio between obese and normal body mass index group. J Korean Acad Fam Med 1997. 18(3)317–327.
16. Korea Health Industry Development Institute. 2010 Elderly Statistics 2009.
17. Korea National Statistical Office. Dependency ratios & aged-child ratio. population projections 2010 2010.
18. Kwon JH, Yoon HJ, Lee JM, Lee SK. Dietary behavior and nutritional status of the elderly women attending at the health promotion program in an urban community. Korean J Community Nutr 2002. 7(6)814–823.
19. Lee Y, Lee HS, Jang YA, Lee HJ, Kim BH, Kim CI. Dietary intake pattern of the Korean adult population by weight status -2001 National Health and Nutrition Survey-. Korean J Community Nutr 2006. 11(3)317–326.
20. Ministry of Health & Welfare. The minimum cost of living for household - Notification No. 2004-77 of Ministry of Health & Welfare in 2005 2006.
21. Ministry of Health & Welfare, Korea Centers for Disease Control & Prevention. Guidelines of The 3rd National Health and Nutritional Examination Survey 2007.
22. Ministry of Health & Welfare, Korea Centers for Disease Control & Prevention. 2009 National Health Statics, Korea National Health and Nutrition Examination Survey (KNHANES IV-3) 2010.
23. Moon HK, Kim EG. Food intake of Koreans by economic status using 1998 Korean National Health Examination Nutrition Survey. Proceedings of 2004 Fall Symposium of the Korean Nutrition Society of Community Nutrition 2004. 228.
24. Moon HK, Kong JE. Assessment of nutrient intake for middle aged with and without metabolic syndrome using 2005 and 2007 Korean National Health and Nutrition Survey. Korean J Nutr 2010. 43(1)69–78.
25. Nord M, Andrews M, Carison S. Measuring food security in the United States: household food security in the United Status, 2005. U.S. Department of Agriculture, Economic Research Service, Economic Research Report No. 29 2006.
26. Park HA, Cho JJ. Economic activities and socioeconomic status of morbidly obese Korean adults. Korean J Obes 2011. 20(4)210–218.
27. Park JA, Yoon JS. Dietary behaviors and status of nutrient intakes by the obesity levels of housewives in Daegu. Korean J Community Nutr 2005. 10(5)623–632.
28. Park JH. Measuring BMI cutoff points of Korean adults using morbidity of BMI-related diseases. Korean J Obes 2011. 20(1)36–43.
29. Park JK, Son SM. The dietary behaviors, depression rates and nutrient intakes of the elderly females living alone. Korean J Community Nutr 2003. 8(5)716–725.
30. Park MJ, Yun KE, Lee GE, Cho HJ, Park HS. The relationship between socioeconomic status and metabolic syndrome among Korean adults. Korean J Obes 2006. 15(1)10–17.
31. Park YJ, Shin NM, Yoon JW, Choi J, Lee SJ. Comparison of cardiovascular health status and health behaviors in Korean women based on household income. J Korean Acad Nurs 2010. 40(6)831–843.
32. Savage DB, Petersen KF, Shulman GI. Disordered lipid metabolism and the pathogenesis of insulin resistance. Physiol Rev 2007. 87(2)507–520.
33. US Department of Health and Human Services. Healthy people 2010. Understanding and improving health and objectives for improving health 2000. 2 Vols2nd edth ed. Washington CD: US Goverment Printing Office; 1–1244.
34. Woo J, Cheung B, Ho S, Shan A, Lam TH. Influence of dietary pattern on the development of overweight in a Chinese population. Eur J Clin Nutr 2008. 62(4)480–487.
35. Yang DJ, Kim WY. Nutritional status of Korean elderly. Korean J Gerontol 2005. 15(1)1–10.
36. Yoon JS, Jang H. Diet quality and food patterns of obese adult women from low income classes -based on 2005 KNHANES-. Korean J Community Nutr 2011. 16(6)706–715.
37. Zhang C, Rexrode KM, van Dam RM, LI TY, Hu FB. Abdominal obesity and the risk of all-cause, cardiovascular, and cancer mortality: sixteen years of follow-up in US women. Circulation 2008. 117(13)1658–1667.
38. Zhao G, Ford ES, Li C, Tsai J, Dhingra S, Balluz LS. Waist circumference, abdominal obesity, and depression among overweight and obese US adults: National Health and Nutrition Examination Survey 2005-2006. BMC Psychiatry 2011. 11130.
Article information Continued

Table 1

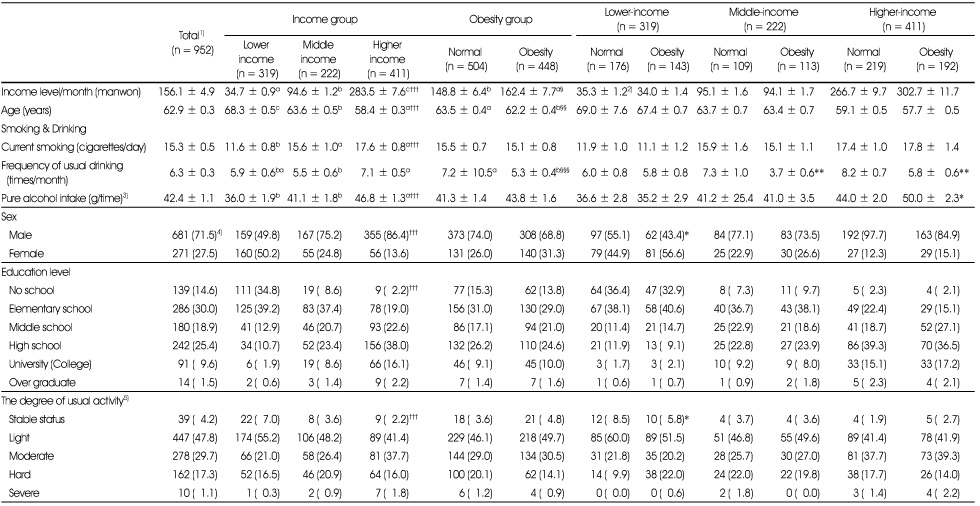
General characteristics of subjects

Table 1

1) By two-way analysis, Mean ± SE: Mean values are significantly different among the income groups by DUNCAN's multiple range test (: p < 0.05, ††: p < 0.01, †††: p < 0.001), Mean ± SE: Mean values are significantly different between normal group and obesity group (§: p < 0.05, §§: p < 0.01, §§§: p < 0.001)

2) Mean ± SE: Mean values are significantly different between normal and obesity in each income group by t-test or χ2-test (*: p < 0.05, **: p < 0.01, ***: p < 0.001)

3) Pure alcohol intake (g/time) : a glass of Soju = 45 g, alcohol concentration in a glass of soju-20%, quantity of pure alcohol in a glass of Soju = 45 × 0.2 = 9 g

4) N (%)

5) The degree of usual activity

  1. Stable status : almost lying down or spending a sedentary life

  2. Light : a white-collar worker, a office manager, a technical worker, a housewife do light household cores or a worker in a similar position

  3. Moderate : a housewife doing heavy household chores

  4. Hard : who works in farming, fishing, civil engineering, building industry or something like this

  5. Severe : a very heavy blue-collar worker such as transporting wooden or an athlete and so on.

Means without a common letter (a, b, c) differ significantly among income groups.

Table 2

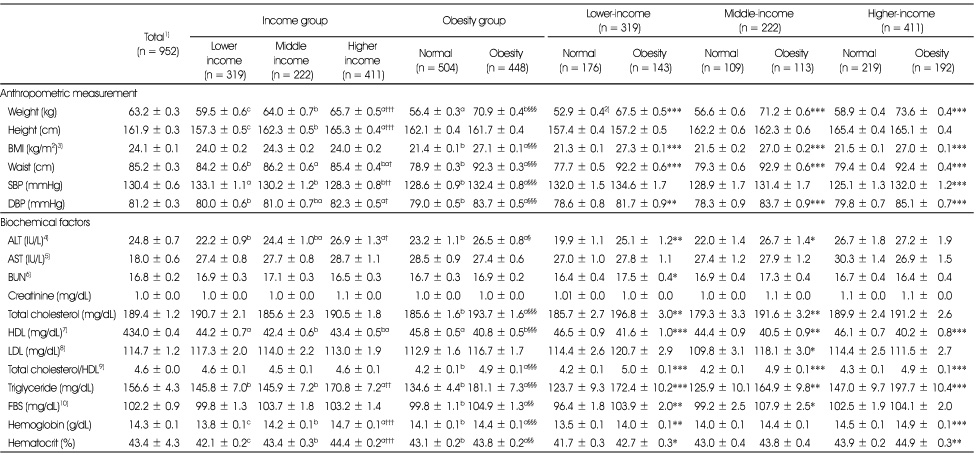
Anthropometric measurement and biochemical factors of subjects

Table 2

1) By two-way analysis, Mean ± SE: Mean values are significantly different among the income groups by DUNCAN's multiple range test (: p < 0.05, ††: p < 0.01, †††: p < 0.001), Mean ± SE: Mean values are significantly different between normal group and obesity group (§: p < 0.05, §§: p < 0.01, §§§: p < 0.001)

2) Mean ± SE: Mean values adjusted by age and sex are significantly different between normal and obesity in each income group by t-test or χ2-test, (*: p < 0.05, **: p < 0.01, ***: p < 0.001)

3) BMI (kg/m2) = weight (kg)/height (m2), 4) ALT = Alanine aminotransferase (IU/L), GPT, 5) AST = Aspartate transminase, GOT (IU/L), 6) BUN = Blood urea nitrogen (mg/dL), 7) HDL = low density lipoprotein, 8) LDL (low density lipoprotein) = Total cholesterol-HDL-cholesterol-Triglyceride/5, 9) Total cholesterol/HDL = Total cholesterol/HDL-cholesterol ratio, 10)

FBS = Fasting blood sugar (mg/dL)

Means without a common letter (a, b, c) differ significantly among income groups.

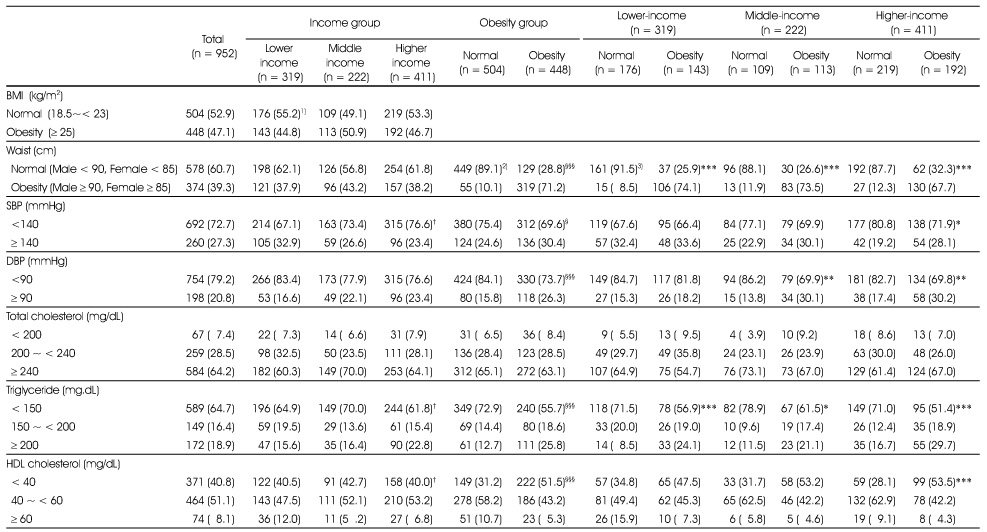
Table 3

Distribution of the subjects according to anthropometric measurement and biochemical factors of subjects

Table 3

1) N (%): by χ2-test among the income groups (: p < 0.05, ††: p < 0.01, †††: p < 0.001)

2) N (%): by χ2-test between normal group and obesity group (§: p < 0.05, §§: p < 0.01, §§§: p < 0.001)

3) N (%): by χ2-test between normal and obesity in each income group (*: p < 0.05, **: p < 0.01, ***: p < 0.001)

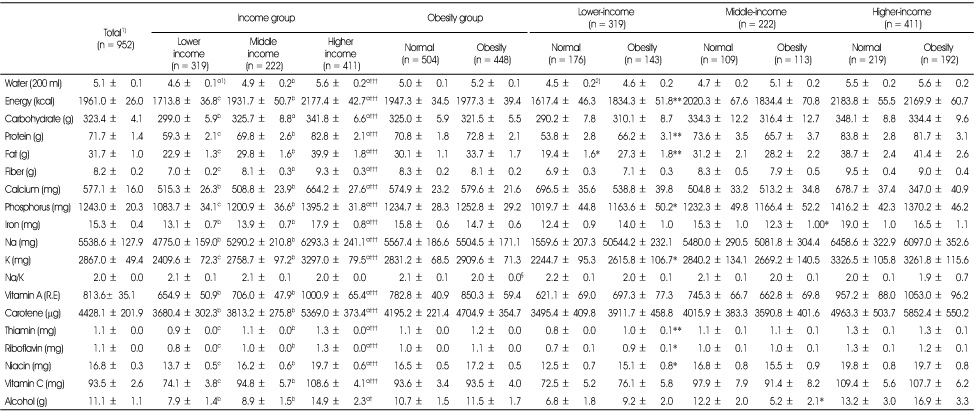
Table 4

Nutrient intakes of subjects

Table 4

1) By two-way analysis, Mean ± SE: Mean values are significantly different among the income groups by DUNCAN's multiple range test (: p < 0.05, ††: p < 0.01, †††: p < 0.001), Mean ± SE: There were no significance between normal group and obesity group.

2) Mean ± SE: Mean values adjusted by age and sex are significantly different between normal and obesity in each income group by t-test or χ2-test, (*: p < 0.05, **: p < 0.01, ***: p < 0.001)

Means without a common letter (a, b, c) differ significantly among income groups.

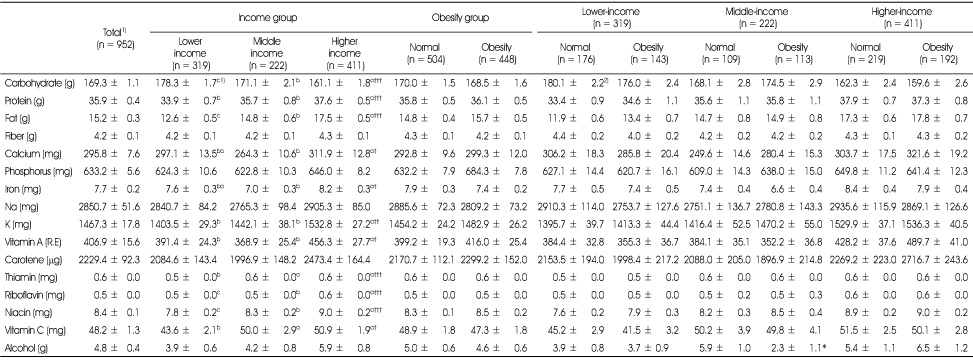
Table 5

Nutrient intakes per 1000kcal of subjects

Table 5

1) By two-way analysis, Mean ± SE: Mean values are significantly different among the income groups by DUNCAN's multiple range test (: p < 0.05, ††: p < 0.01, †††: p < 0.001), Mean ± SE: There were no significance between normal group and obesity group.

2) Mean ± SE: Mean values adjusted by age and sex are significantly different between normal and obesity in each income group by t-test or χ2-test, (*: p < 0.05, **: p < 0.01, ***: p < 0.001)

Means without a common letter (a, b, c) differ significantly among income groups.

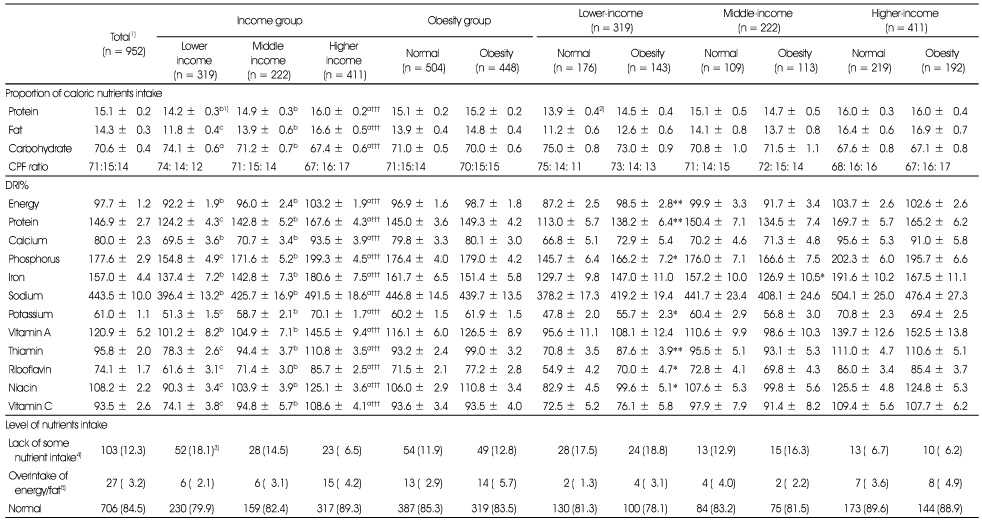
Table 6

Proportion of nutrients intake of subjects

Table 6

1) By two-way analysis, Mean ± SE: Mean values are significantly different among the income groups by DUNCAN's multiple range test (: p < 0.05, ††: p < 0.01, †††: p < 0.001), Mean ± SE: There were no significance between normal group and obesity group.

2) Mean ± SE: Mean values adjusted by age and sex are significantly different between normal and obesity in each income group by t-test or χ2-test, (*: p < 0.05, **: p < 0.01, ***: p < 0.001)

3) N (%): : p < 0.05, ††: p < 0.01, †††: p < 0.001, χ2-test

4) The subjects consuming below 75% EER (estimated energy requirement) and below EAR (estimated average requirement) in Ca, Fe, Vit A, riboflavin.

5) The subjects consuming over 125% EER and beyond optimal proportion of fat to energy.

Means without a common letter (a, b, c) differ significantly among income groups.

Table 7

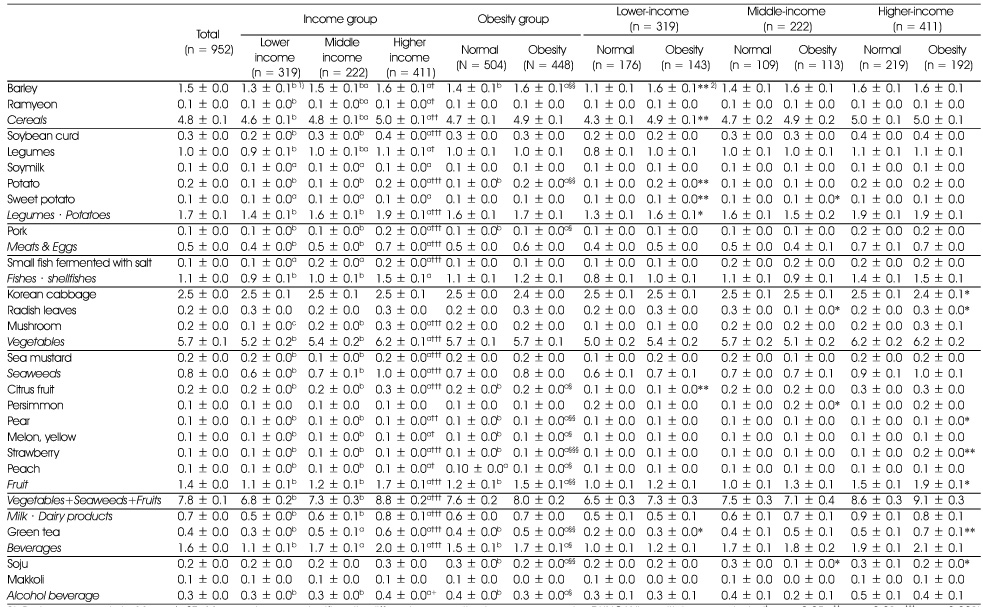
Food consumption frequency of subjects

Table 7

1) By two-way analysis, Mean ± SE: Mean values are significantly different among the income groups by DUNCAN's multiple range test (: p < 0.05, ††: p < 0.01, †††: p < 0.001), Mean ± SE: Mean values are significantly different between normal group and obesity group (§: p < 0.05, §§: p < 0.01, §§§: p < 0.001)

2) Mean ± SE: Mean values adjusted by age and sex are significantly different between normal and obesity in each income group by t-test or χ2-test, (*: p < 0.05, **: p < 0.01, ***: p < 0.001)

Score: 3 times/day = 3.0, 2 times/day = 2.0, 1 time/day = 1.0, 4-6 times/week = 0.71, 2-3 times/week = 0.36, 1 time/week = 0.14, 2-3 times/month = 0.09, 1 time/month = 0.04, 6-11 times/year = 0.02, seldom = 0

Means without a common letter (a, b, c) differ significantly among income groups.