Warning: mkdir(): Permission denied in /home/virtual/lib/view_data.php on line 81

Warning: fopen(upload/ip_log/ip_log_2024-09.txt): failed to open stream: No such file or directory in /home/virtual/lib/view_data.php on line 83

Warning: fwrite() expects parameter 1 to be resource, boolean given in /home/virtual/lib/view_data.php on line 84
Development of 9<sup xmlns="">th</sup> Revision Korean Food Composition Table and Its Major Changes

Development of 9th Revision Korean Food Composition Table and Its Major Changes

Article information

Korean J Community Nutr. 2018;23(4):352-365
Publication date (electronic) : 2018 August 31
doi : https://doi.org/10.5720/kjcn.2018.23.4.352
Department Agrofood Resources, National Institute of Agricultural Sciences, Rural Development Administration, Wanju, Korea.
Corresponding author: Youngmin Choi. Department Agrofood Resources, National Institute of Agricultural Sciences, Rural Development Administration, Wanju 55365, Korea. Tel: (063) 238-3561, Fax: (063) 238-3842, ychoi2@korea.kr
Received 2018 July 20; Revised 2018 August 31; Accepted 2018 September 04.

Abstract

Objectives

The Korean Food Composition Table (KFCT) was first published in 1970, and has since been updated every five years by the Rural Development Administration (RDA). This study was conducted to introduce the development strategies, features, and challenges of the 9th revision of the KFCT.

Methods

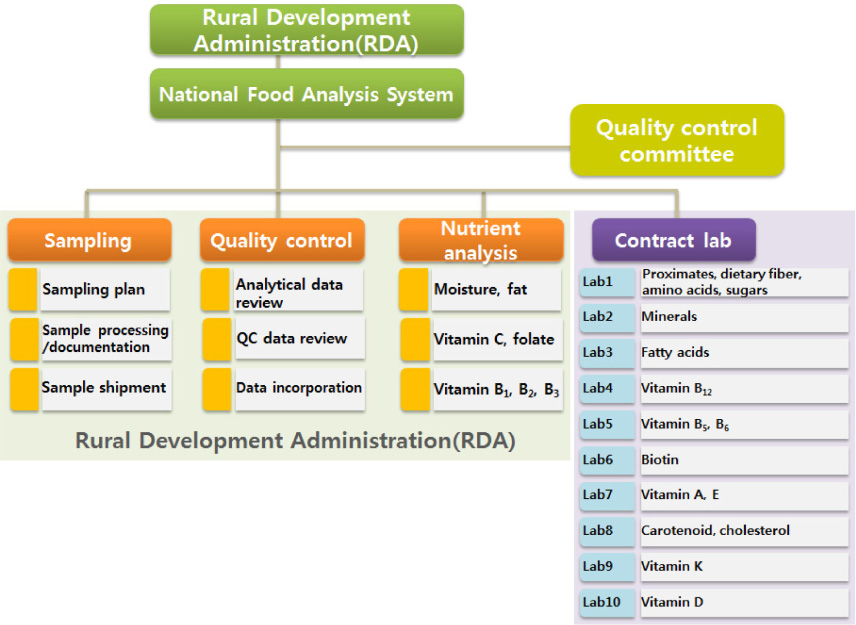
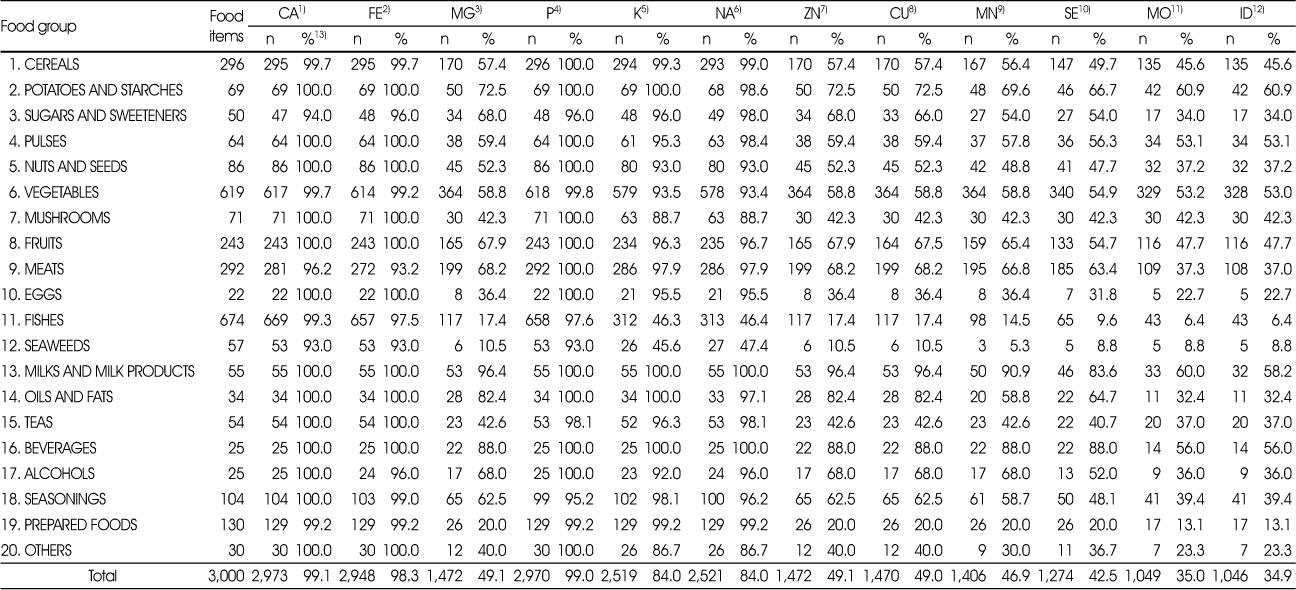
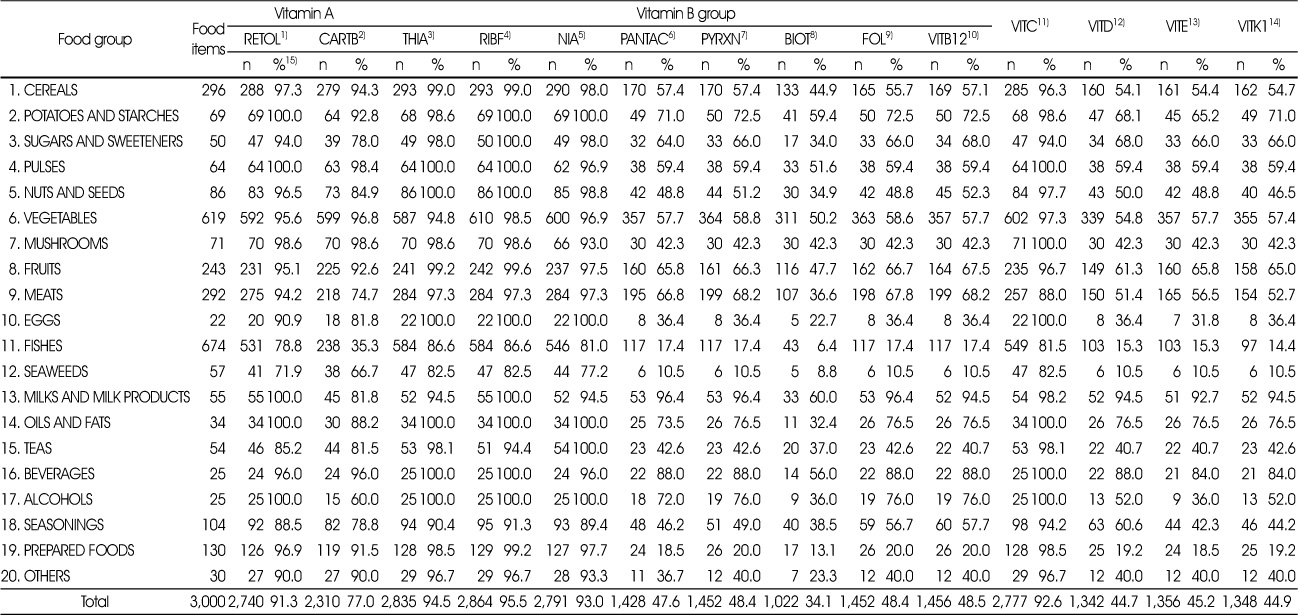
Due to the increasing demands of nutrient database users and generators, the RDA started a new research project in 2013 to improve the quantity and quality of data for the 9th revision of the KFCT. Over 1,000 food items frequently consumed in Korea were selected as key foods using the results of the Korean National Health and Nutrition Examination Survey. About 200 raw materials and processed food items were collected and analyzed every year. Target nutrients that were analyzed by collaborative labs, such as, sugars, selenium, iodine, and biotin, were increased from 22 to 43. Analytical sample handling procedures and data quality evaluation systems were also established in collaboration with 10 contracted labs. Data were evaluated for data quality according to the FAO/INFOODS, CODEX, and AOAC guidelines.

Results

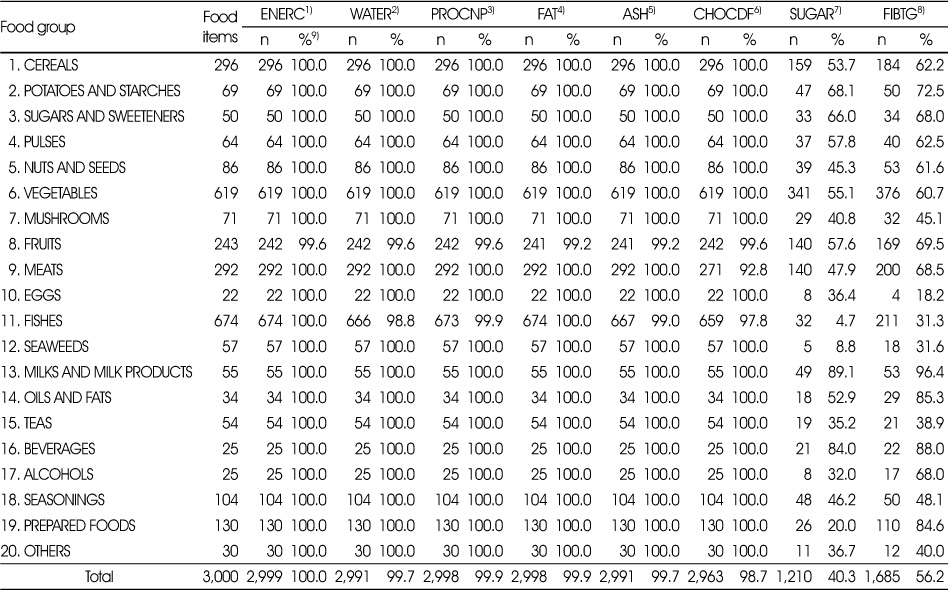
The 9th revision contains data on 3,000 food items and up to 43 and 140 food nutrients for the printed table and the excel database file, respectively. Overall, 1,485 data items were newly added, 973 of which were provided by the RDA and 512 were cited from foreign nutrient databases. The remaining 1,515 food items were maintained as in the 8th revision.

Conclusions

The KFCT provides the basic infrastructure for food and nutrition policy, research, and dietary practice in South Korea. The use of the KFCT has increased exponentially in the past few years in both public and private sectors; accordingly, increased efforts should be paid to the preparation, improvement, and maintenance of KFCT.

Acknowledgments

This study was supported by 2017 the RDA Fellowship Program (Project No.PJ01261801) of National Institute of Agricultural Sciences, Rural Development Administration, Republic of Korea.

References

1. Kim SY, Kang MS, Kim SN, Kim JB, Cho YS, Park HJ, et al. Food composition tables and national information network for food nutrition in Korea. Food Sci Ind 2011;44(1):2–20.
2. Lim SH, Kim JB, Cho YS, Choi YM, Park HJ, Kim SN. National standard food composition tables provide the infrastructure for food and nutrition research according to policy and industry. Korean J Food Nutr 2013;26(4):886–894.
3. FAO/INFOODS. FAO/INFOODS Guidelines for checking food composition data prior to the publication of a user table/database. version 1.0 Rome: FAO; 2012. p. 1–40.
4. United States Department of Agriculture. USDA national nutrient database for standard reference 28 [internet] United States Department of Agriculture; 2015. cited 2016 Feb 3. Available from: https://ndb.nal.usda.gov/ndb/.
5. Danish Food Informatics. SciName FinderTM [internet] Danish Food Informatics; 2013. cited 2016 Feb 3. Available from: http://www.sciname.info/.
6. Korea National Arboretum. Korea biodiversity information system [internet] Korea National Arboretum; 2016. cited 2016 Feb 3. Available from: http://www.nature.go.kr.
7. Horwitz W. AOAC guidelines for single laboratory validation of chemical methods for dietary supplements and botanicals Gaithersburg, MD, USA: AOAC International; 2002. p. 18–19. p. 21–22. p. 24–25.
8. Rural Resources Development Institute. Food Composition Table 7th revisionth ed. Suwon: Rural Resources Development Institute; 2006. p. 1–453.
9. National Academy of Agricultural Sciences. Food Composition Table 8th revisionth ed. Suwon: National Academy of Agricultural Sciences; 2011. p. 1–636.
10. Ministry of Education, Culture, Sports, Science and Technology. Standard tables of food composition in Japan -2015- (Seventh Revised Edition), Introduction [internet] Ministry of Education, Culture, Sports, Science and Technology; 2015. cited 2016 Feb 3. Available from: http://www.MEXT.go.jp/.
11. National Academy of Agricultural Sciences. Tables of Food Functional Composition 1st editionth ed. Suwon: National Academy of Agricultural Sciences; 2009. p. 1–450.
12. National Academy of Agricultural Sciences. 2010 Tables of Food Functional Composition: mineral, fatty acid Suwon: National Academy of Agricultural Sciences; 2010. p. 1–179.
13. National Academy of Agricultural Sciences. 2011 Tables of Food Functional Composition: amino acid Suwon: National Academy of Agricultural Sciences; 2011. p. 1–387.
14. National Academy of Agricultural Sciences. 2012 Tables of Food Functional Composition: fat-soluble vitamin composition table Suwon: National Academy of Agricultural Sciences; 2012. p. 1–249.
15. National Academy of Agricultural Sciences. 2012 Tables of Food Functional Composition: cholesterol edition Suwon: National Academy of Agricultural Sciences; 2012. p. 1–180.
16. Moon JH, Kim HS, Kwon DY, Yoo JY, Seo SY, Lee JM, et al. Measuring the public value of standard food composition table Rural Development Administration; 2017. 02. Report No. 1395048720.
17. Kim S, Sung JY, Foo M, Jin YS, Kim PJ. Uncovering the nutritional landscape of food. PLoS ONE 2015;10(3)e0118697.
18. Lee HS, Chang MJ, Kim HY, Shim JS, Lee JS, Kim KN. Survey on utilization and demand for national food composition database. J Nutr Health 2018;51(2):186–198.

Article information Continued

Funded by : Rural Development Administrationhttp://dx.doi.org/10.13039/501100003627
Award ID : PJ01261801

Fig. 1

National Food Analysis System

In 2013, Rural Development Administration started new research project to improve data quality and quantity for 9th revision KFCT. Over 1,000 food items have been sampled and analyzed by NFAS.

Table 1

Number of food items in each food group

Table 1

Table 2

Number of foods updated in each food group

Table 2

Table 3

The source of nutrient data in 9th revision Korean Food Composition Table

Table 3

1) Rural Development Administration, Food Composition Table

2) National Institute of Fisheries Science, Chemical Composition of Marine Products in Korea

3) Ministry of Food and Drug Safety, Food Composition Database

4) National Institute of Health, Journal of National Institute of Health

5) Research articles published in Korea

6) Ministry of Education, Culture, Sports, Science and Technology (MEXT), Standard Tables of Food Composition in Japan (Seventh Revised Edition)

7) United States Department of Agriculture. Food Composition Database, Standard Reference 28

Table 4

Number of foods in 9th revision Korean Food Composition Table by listing for each nutrients (proximates)

Table 4

1) ENERC: Energy, 2) WATER: Water, 3) PROCNP: Protein, 4) FAT: Fat, 5) ASH: Ash, 6) CHOCDF: Carbohydrate, 7) SUGAR: Total sugars, 8) FIBTG: Total Dietary Fiber, 9) The comprehensiveness (%) of the database by listing for each nutrient the number of food items that contain data

Table 5

Number of foods in 9th revision Korean Food Composition Table by listing for each nutrients (amino acids)

Table 5

1) AAT19: Sum of 19 amino acids, 2) AAE10A: Total essential amino acid, 3) AANE: Total non-essential amino acid, 4) The comprehensiveness(%) of the database by listing for each nutrient the number of food items that contain data

Table 6

Number of foods in 9th revision Korean Food Composition Table by listing for each nutrients(fatty acids and cholesterol)

Table 6

1) FAFRE: Total fatty acid, 2) FAESS: Total essential fatty acid, 3) FASAT: Saturated Fatty acid, 4) FAMS: Monounsaturated fatty acid, 5) FAPU: Polyunsaturated fatty acid, 6) CHOLE: Cholesterol, 7) The comprehensiveness(%) of the database by listing for each nutrient the number of food items that contain data

Table 7

Number of foods in 9th revision Korean Food Composition Table by listing for each nutrients (minerals)

Table 7

1) CA: Calcium, 2) FE: Iron, 3) MG: Magnesium, 4) P: Phosphorus, 5) K: Potassium, 6) NA: Sodium, 7) ZN: Zinc, 8) CU: Copper, 9) MN: Manganese, 10) SE: Selenium, 11) MO: Molybdenum, 12) ID: Iodine, 13) The comprehensiveness (%) of the database by listing for each nutrient the number of food items that contain data

Table 8

Number of foods in 9th revision Korean Food Composition Table by listing for each nutrients (vitamins)

Table 8

1) RETOL: Retinol, 2) CARTB: β-Carotene, 3) THIA: Thiamin, 4) RIBF: Total Riboflavin, 5) NIA: Total Niacin, 6) PANTAC: Pantothenic acid, 7) PYRXN: Pyridoxine, 8) BIOT: Biotin, 9) FOL: Dietary Folate Equivalent, 10) VITB12: Cyanocobalamin, 11) VITC: Total Ascorbic Acid, 12) VITD: Vitamin D (Ergocalciferol + Cholecalciferol), 13) VITE: Total Vitamin E, 14) VITK1: Phylloquinone, 15) The comprehensiveness (%) of the database by listing for each nutrient the number of food items that contain data

Table 9

Summary of number of food items in 8th and 9th revision Korean Food Composition Table

Table 9

1) Tables of Food Functional Composition – Mineral/Fatty acid, 2010

2) Tables of Food Functional Composition – 1st edition, 2009

3) Tables of Food Functional Composition – Fat-soluble vitamin, 2012

4) Tables of Food Functional Composition – Amino acid, 2011

5) Tables of Food Functional Composition – Cholesterol, 2012