Warning: mkdir(): Permission denied in /home/virtual/lib/view_data.php on line 81

Warning: fopen(upload/ip_log/ip_log_2024-11.txt): failed to open stream: No such file or directory in /home/virtual/lib/view_data.php on line 83

Warning: fwrite() expects parameter 1 to be resource, boolean given in /home/virtual/lib/view_data.php on line 84
Changes in Food and Nutrient Intakes of College Students between 1999 and 2009

Changes in Food and Nutrient Intakes of College Students between 1999 and 2009

Article information

Korean J Community Nutr. 2011;16(3):324-336
Publication date (electronic) : 2011 June 30
doi : https://doi.org/10.5720/kjcn.2011.16.3.324
Department of Food and Nutrition, Chungbuk National University, Cheongju, Korea.
Corresponding author: Taisun Hyun, Department of Food and Nutrition, Chungbuk National University, Cheongju 361-763, Korea. Tel:(043) 261-2790, Fax:(043) 267-2742, taisun@chungbuk.ac.kr
Received 2011 May 25; Revised 2011 June 07; Accepted 2011 June 22.

Abstract

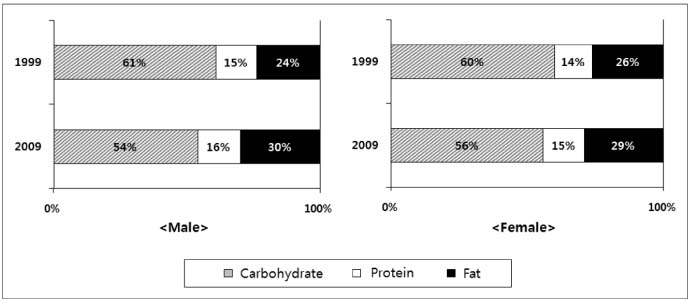
The purpose of the study was to examine the changes of food and nutrient intakes of college students between 1999 and 2009. Dietary survey of 169 college students was conducted by a 24-hour recall method for three days in 2009. Food and nutrient intakes in 2009 were compared with the data from 106 students collected by the same methods in 1999. The intakes of cereals & grain products and vegetables in 2009 were lower than those of 1999, but the intakes of meats, eggs, milk & milk products, and manufactured food were higher. The intake of rice per person decreased greatly from 452.2 g in 1999 to 351.4 g in 2009 in males, and from 306.9 g to 237.2 g in females. While the intakes of protein, fat, thiamin, niacin, vitamin B6, phosphorus, potassium, zinc, and cholesterol were significantly higher, the intakes of dietary fiber were significantly lower in 2009 compared to 1999 both in males and females. The nutrients consumed less than the Recommended Intakes were vitamin A, riboflavin, vitamin C, and calcium in males and additionally folate, iron, and zinc in females in both 1999 and 2009. The ratio of carbohydrate, protein and fat as energy was 61 : 15 : 24 and 60 : 14 : 26 in 1999, and 54 : 16 : 30 and 56 : 15 : 29 in 2009 in males and females respectively, showing that carbohydrate intake decreased and fat intake increased greatly. Our data suggest that nutrition education is necessary for college students to help them consume more vegetables and fruits and less fat and cholesterol.

Notes

This work was supported by the research grant of the Chungbuk National University in 2009.

References

1. Cheong SH, Chang KJ. Anthropometric measurement, dietary behavior and nutrient intake of the nation-wide college students attending a nutrition education via internet. J Korean Soc Food Sci Nutr 2006. 35(5)565–571.
2. Choi MJ, Jo HJ. Studies on nutrient intake and food habit of college students in Taegu. Korean J Nutr 1999. 32(8)918–926.
3. Choi SN, Chung NY, Song CH, Kim SR. Bone density and nutrient intake of university students. Korean J Food Cult 2007. 22(6)841–847.
4. Chung HJ, Chang KJ. A study on correlations between dietary nutrients and body composition of college students. J Korean Soc Food Sci Nutr 2006. 35(10)1378–1384.
5. Han YH, Yon MY, Hyun TS. Effect of prune supplementation on dietary fiber intake and constipation relief. Korean J Community Nutr 2008. 13(3)426–438.
6. Hyun TS, Han YH. Comparison of folate intake and food sources in college students using the 6th vs. 7th nutrient database. Korean J Nutr 2001. 34(7)797–808.
7. Kim HY, Jeon DW. Relationships among personality preferences, dietary habit and nutrient intake of university students. Korean J Food Cult 2003. 18(5)418–427.
8. Kim KH. A study of the dietary habits, the nutritional knowledge and the consumption patterns of convenience foods of university students in the Gwangju area. Korean J Community Nutr 2003. 8(2)181–191.
9. Kim WS, Kim MJ, Hyun TS. Differences in characteristics and dietary habits between volunteers and selected subjects in nutrition survey. Korean J Community Nutr 2004. 9(4)511–518.
10. Koh MS, Kim SE. A study of the dietary habits, diversity of food intake and nutrient intake of Silla university students. J Nat Sci 2006. 1531–44.
11. Korea Health Industry Development Institute. Development of nutrient database - 5. Dietary Fiber Composition of Foods - 2005.
12. Korean Nutrition Society. Recommended Dietary Allowances For Koreans 1995. 6th Revisionth ed.
13. Korean Nutrition Society. Recommended Dietary Allowances For Koreans 2000. 7th Revisionth ed.
14. Korean Nutrition Society. Dietary Recommended Intakes for Koreans 2005.
15. Korean Nutrition Society. Food values 2009.
16. Korean Nutrition Society. Dietary Recommended Intakes for Koreans 2010.
17. Lee MS, Kwak CS. The comparison in daily intake of nutrients, quality of diets and dietary habits between male and female college students in Daejeon. Korean J Community Nutr 2006. 11(1)39–51.
18. Lee YS. A study on the eating behavior, nutrient intake and health condition of college students attempting weight control in the Daegu Area. J East Asian Soc Diet Life 2003. 13(6)577–585.
19. Ministry of Health & Welfare. Korean National Health and Nutrition Examination Survey 1999.
20. Ministry of Health & Welfare, Center for Disease Control and Prevention. Korea Helath Statistics 2008, Korea National Health and Nutrition Examination Survey 2008.
21. Sung MJ, Chang KJ. Correlations among life stress, sleep, anthropometric measurement and nutrient intakes of college students. J Korean Soc Food Sci Nutr 2007. 36(7)840–848.
22. Yon MY, Hyun TS. Dietary habits, food frequency and dietary attitudes by gender and nutrition knowledge level in upper-grade school children. Korean J Community Nutr 2008. 13(3)307–322.
23. You JS, Chin JH, Chang KJ. Prevalence of constipation, bowel habits and nutrient intakes of college students in Incheon area. Korean J Nutr 2009. 42(8)702–713.
24. You JS, Chin JH, Kim MJ, Chang KJ. College students' dietary behavior, health-related lifestyles and nutrient intake status by physical activity levels using International Physical Activity Questionnaire (IPAQ) in Incheon Area. Korean J Nutr 2008. 41(8)818–831.
25. Yu JY, Ro HK. Gender differences in obesity rates, nutrient intakes, and dietary behaviors among college students. J East Asian Soc Diet Life 2009. 19(6)846–855.
Article information Continued

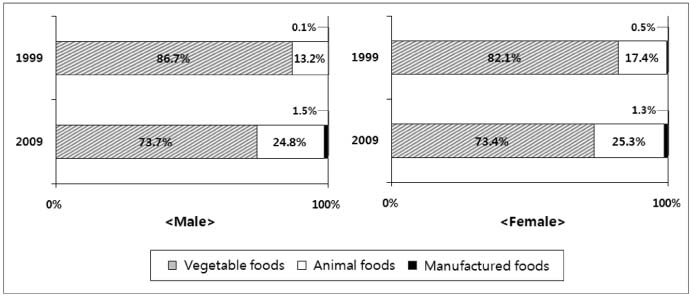
Fig. 1

Comparison of food source consumed by the subjects

Fig. 2

Percentages of energy from carbohydrate, protein, and fat.

Fig. 3

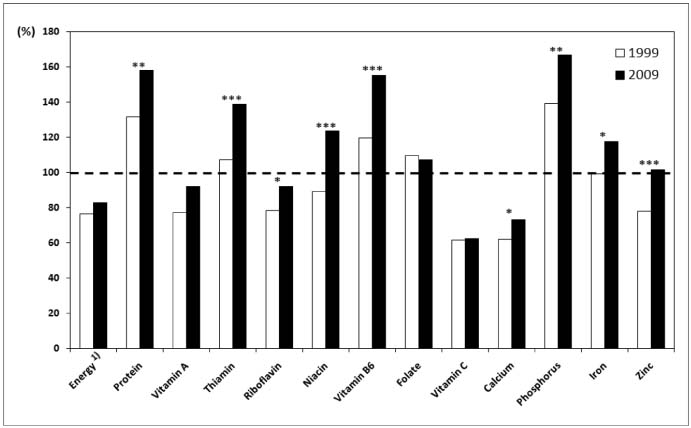
Nutrient intakes of male students as percentages of Recommend Intakes.

1) Energy intake was compared with Estimated Energy Requirement.

*: p < 0.05, **: p < 0.01, ***: p < 0.001 Significantly different between 1999 and 2009 by t-test

Fig. 4

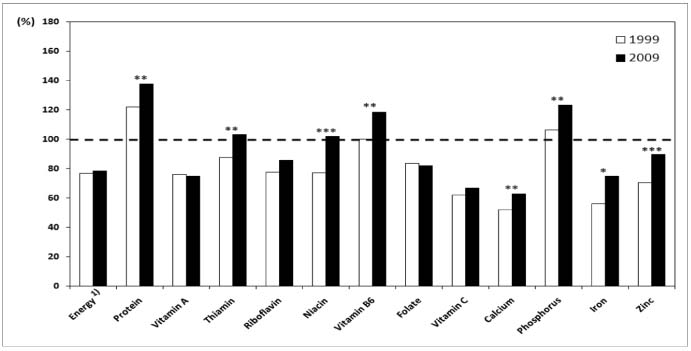
Nutrient intakes of female students as percentage of Recommend Intakes.

1) Energy intake was compared with Estimated Energy Requirement

*: p < 0.05, **: p < 0.01, ***: p < 0.001 Significantly different between 1999 and 2009 by t-test

Fig. 5

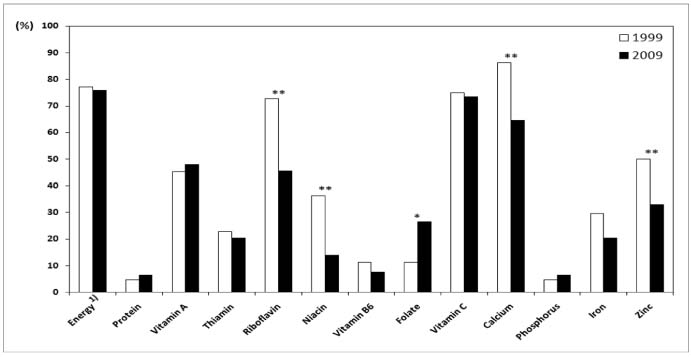
Percentages of male students whose intake of selected nutrient was less than Estimated Average Requirement.

1) Estimated Energy Requirement was used for energy

*: p < 0.05, **: p < 0.01: Significantly different by χ2-test

Fig. 6

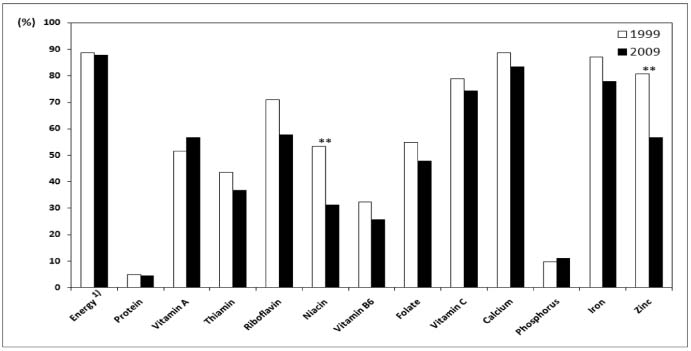
Percentages of female students whose intake of selected nutrient was less than Estimated Average Requirement.

1) Estimated Energy Requirement was used for energy

**: p < 0.01: Significantly different by χ2-test

Table 1

Age and anthropometric data of the subjects

Table 1

1) Mean±SD

*: p < 0.05, **: p < 0.01 Significantly different from the data in 2009 by t-test

Table 2

Body mass index (BMI) distribution of the subjects

Table 2

1) N (%)

Table 3

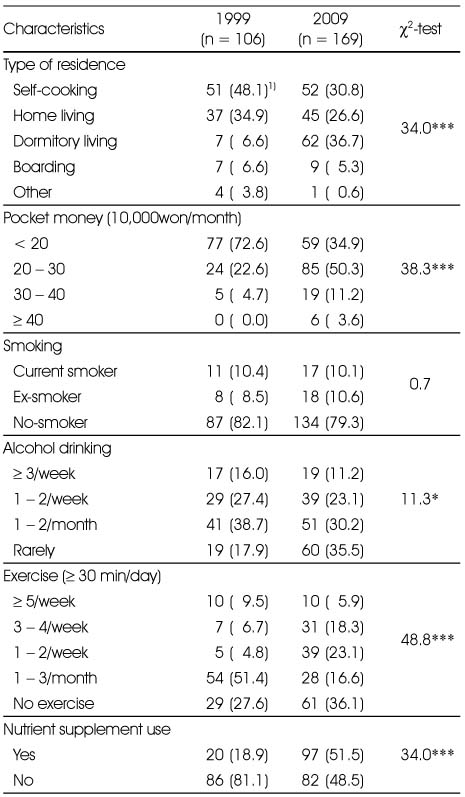
General characteristics of the subjects

Table 3

1) N (%)

*: p < 0.05, ***: p < 0.001 Significantly different by χ2-test

Table 4

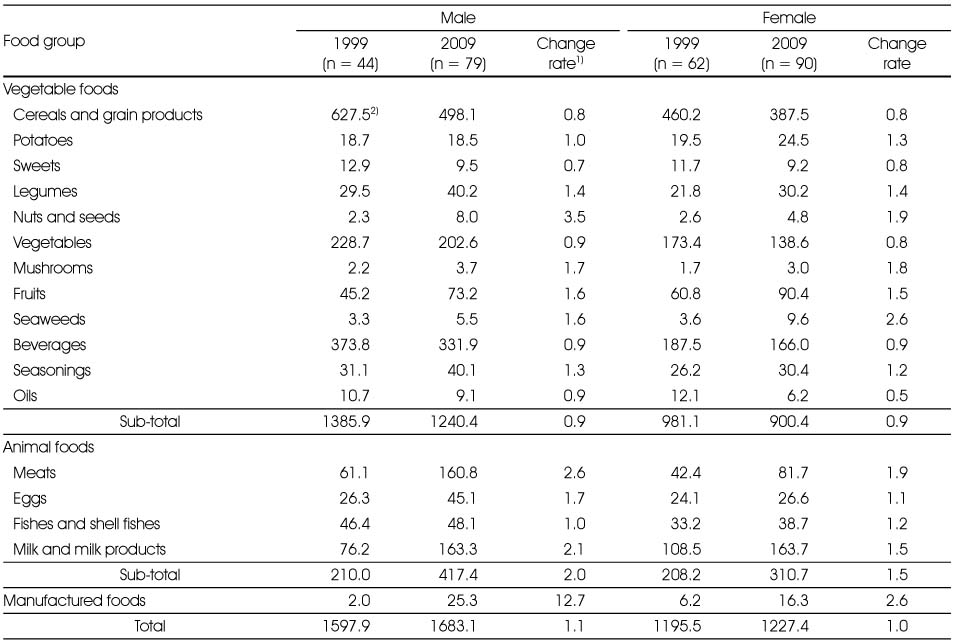
Mean intakes of food groups

Table 4

1) Change rate = intake in 2009/intake in 1999

2) unit: g

Table 5

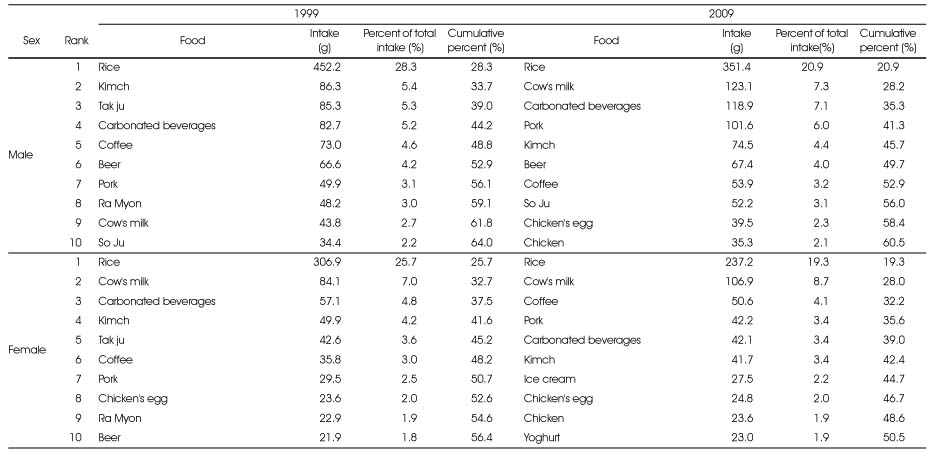
Top 10 most consumed foods in 1999 and 2009

Table 5

Table 6

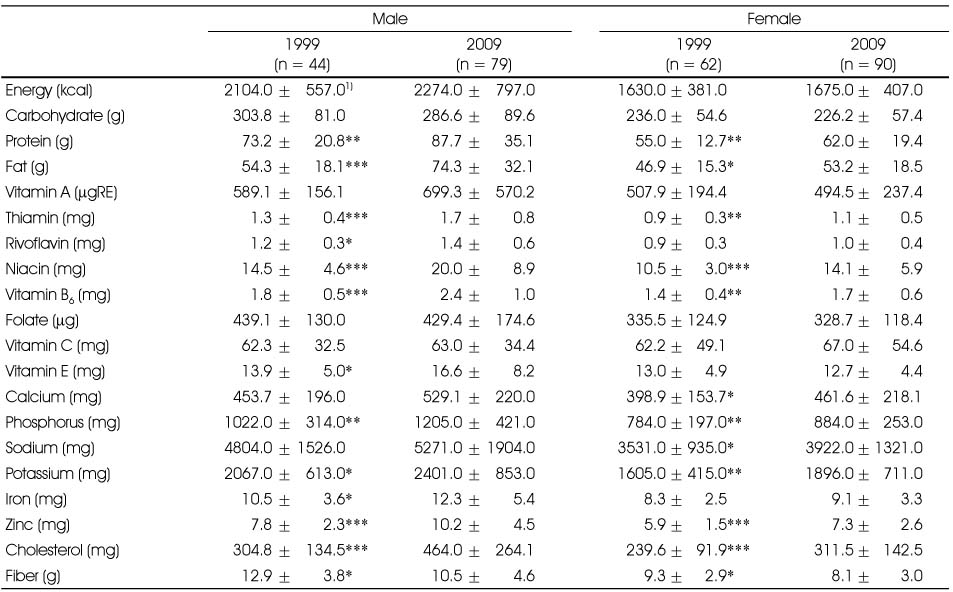
Mean daily nutrient intakes of the subjects

Table 6

1) Mean ± SD

*: p < 0.05, **: p < 0.01, ***: p < 0.001: Significantly different from the intakes in 2009 by t-test