Analysis of Relative Importance of Key Performance Indicators for Center for Child-Care Foodservice Management through Analytic Hierarchy Process (AHP)
Article information
Abstract
The objectives of this study were to assign reasonability to importance of weight selection issue in key performance indicator for performance evaluation of Centers for Child-care Foodservice Management (CCFSM) developed by using Balanced Scorecard (BSC), to draw key performance indicator (KPI) by perspective and to analyze differences in recognition on importance. From September 25 to October 9, 2012, we conducted a questionnaire-based study via e-mail, targeting chiefs and team leaders of nationwide 21 CCFSMs (43 persons), officials of local governments where CCFSM was established (21 persons), officials of Korea Food and Drug Administration (2 persons) and foodservice management experts (27 persons) in order to estimate the relative importance on 4 perspectives and 14 KPIs and analyzed its results by using 61 collected data. The results showed that relative importance of perspectives was estimated in order of importance as follows: business performance (0.3519), customer (0.3393), resource (0.1557), learning and growth (0.1531). Relative importance of KPIs was in order of importance as follows: Evaluation of sanitary management level in childcare foodservice facilities (0.1327), Level of customer recognition and behavior improvement (0.1153), performances of round visiting inspection on foodservice, sanitary, safety management, and foodservice consulting (0.0913). Our results showed that the recognition differences exist on the relative importance of perspectives and KPIs between officials of CCFSM, KFDA, local government and foodservice management experts. These observations will form the basis for developing evaluation systems, and it is considered that performance indicators developed on this basis will suggest direction of operation which CCFSM will have to perform.

The hierarchical diagram for the performance evaluation of operation in Centers for Child-care Foodservice Management (CCFSM).
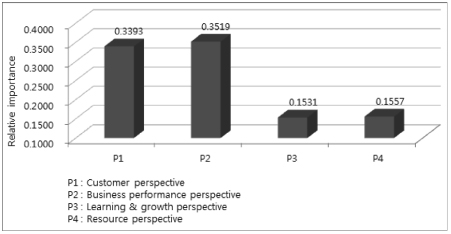
The relative importance of perspectives.
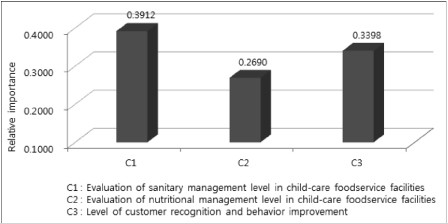
The relative importance of key performance indicator in customer perspective.
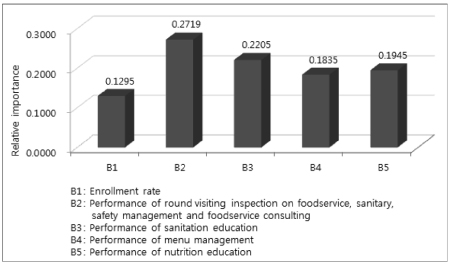
The relative importance of key performance indicator in business performance perspective.
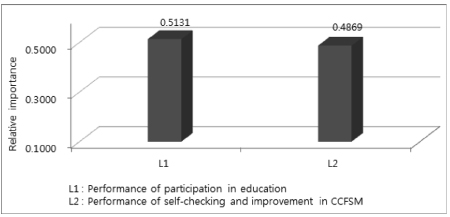
The relative importance of key performance indicator in learning & growth perspective.

The relative importance of key performance indicator in resource perspective.
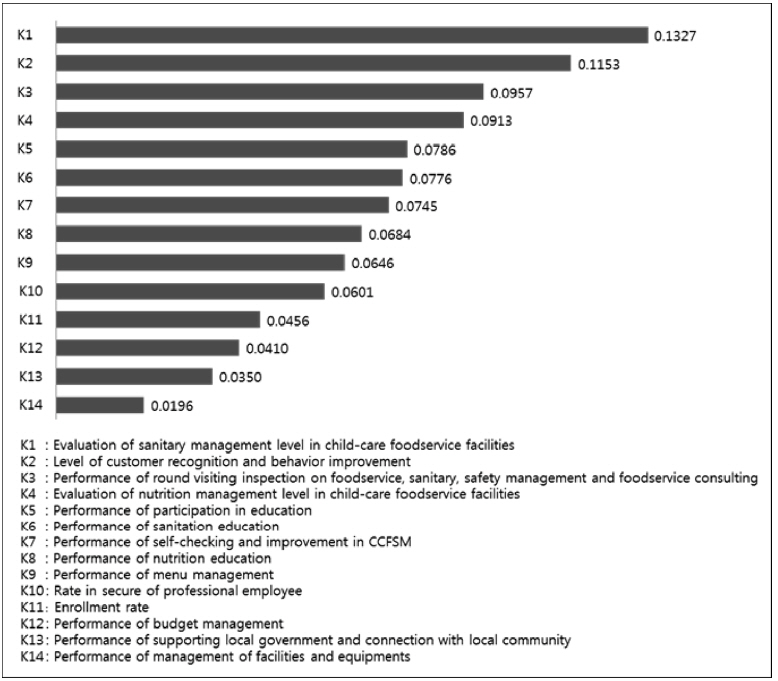
Compound relative importance of key performance indicators.

Random Indicator (RI)

General characteristics of the subjects

Difference in perception on the relative importance of perspectives

Difference in perception on the relative importance of key performance indicators according to perspective