Articles
- Page Path
- HOME > Korean J Community Nutr > Volume 18(6); 2013 > Article
-
Original Article
- Effects of Nutrition Education for Chinese College Students in Korea: Focused on Personalized Daily Energy Requirement and Food Exchange Units
- Jia-Li Guo, Soon-Kyung Kim, Jeong-Weon Kim, Mi-Hyun Kim, Se-Na Kim, Sook-Bae Kim
-
Korean Journal of Community Nutrition 2013;18(6):565-576.
DOI: https://doi.org/10.5720/kjcn.2013.18.6.565
Published online: December 31, 2013
Graduate School of Chonbuk National University, Jeonju, Korea.
1Department of Food Sciences and Nutrition, Soonchunhyang University, Asan, Korea.
2Department of Science & Technology Education for Life, Seoul National University of Education, Seoul, Korea.
3Department of Food and Nutrition, Korean National University of Transportation, Jeungpyeong, Korea.
4Department of Agrofood Resources, NAAS, RDA, Suwon, Korea.
5Department of Food Science & Human Nutrition, Research Institute of Human Ecology, Chonbuk National University, Jeonju, Korea.
- Corresponding author: Sook-Bae Kim, Chonbuk National University, 664-14, Duk-Jin Dong 1-Ga, Duk-Jin Gu, Jeonju 561-756, Korea. Tel: (063) 270-3823, Fax: (063) 270-3854, sbkim@jbnu.ac.kr
Copyright © 2013 The Korean Society of Community Nutrition
This is an Open-Access article distributed under the terms of the Creative Commons Attribution Non-Commercial License (http://creativecommons.org/licenses/by-nc/3.0/) which permits unrestricted non-commercial use, distribution, and reproduction in any medium, provided the original work is properly cited.
- 462 Views
- 1 Download
- 6 Crossref
Abstract
- The purpose of this study was to investigate the effects of nutrition education on nutrition knowledge, dietary attitude and dietary intake of Chinese college students in Korea. The subjects were 64 Chinese college students in Korea (educated group, 32 students vs. non-educated group, 32 students). Educated group was lessoned as group and/or individual. Nutrition education program consisted of four lessons (40min / lesson), '6 major nutrients & function (group lesson)', '6 food group and sources (group lesson)', 'personalized daily needed energy and food exchange units using Food Exchange System (individual lesson)', and 'smart choice of snacks and eating-out foods (group lesson)'. We examined the differences between educated group and non-educated group in nutrition knowledge, dietary attitudes and nutrients intake. After education, there were positive improvements on nutrition knowledge: 'function and foods of 6 nutrients', on dietary attitudes: 'type of breakfast' in educated group. In the evaluation of nutrient intakes according to Dietary Reference Intakes for Korean (KDRI), there were positive improvements on intake levels of riboflavin, fiber, vitamin B6, vitamin C, folate, Ca and K in the educated group. In the index of nutrition quality (INQ), nutrition adequacy ratio (NAR) and mean nutrition adequacy ratio (MAR) were significantly increased in the educated group. In conclusion, it is possible to improve nutrition knowledge, dietary attitude and dietary intake of Chinese college students in Korea through the nutrition education focused on personalized daily needed energy and food exchange units.
-
This study was carried out with the support of "Cooperative Research Program for Agricultural Science & Technology Development (PJ008237)", Rural Development Administration, Republic of Korea.
NOTES
- 1. Bea MS. Related factors with health behaviors of foreign students studying in Korea. Yeungnam University; 2009; Dissertation.
- 2. Chang YK, Chung YJ, Moon HK, Yoon JS, Park HR. Nutritional assessment. Seoul: Shingwang publishing Co.; 2001.
- 3. Choi HM, Kim JH, Lee ZH. Nutrition. Paju: Kyomunsa; 2009. p. 304-305.
- 4. Choi HM, Kim JH, Lee ZH. Nutrition. Paju: Kyomunsa; 2009. p. 268-270.
- 5. Eom HS, Jeong MJ, Kim SB. A study on nutrition knowlege, dietary attitude, food habit of middle school students in Chonbuk area. Korean J Community Nutr 2005; 10(5): 574-581.
- 6. Guo R. Relationship between perceived university environment and adjustment of university life by Chinese students in Korea. Woosuk University; 2011; MS thesis.
- 7. Hong SY. Basic statistics. Seoul: Hakjisa; 2004.
- 8. Kim BR. A study on nutrition knowledge, dietary habits, health-related life style and health condition of college student in Chunchen. J Korean Soc Food Sci Nutr 2006; 39(9): 1215-1223.
- 9. Kim BR, Han YB, Chang UJ. A study on the attitude toward weight control, diet behavior and food habits of college students. Korean J Community Nutr 1997; 2(4): 530-538.
- 10. Kim HK, Kim JH, Jung HK. A comparison of health related habits, nutrition knowledge, dietary habits, and blood composition according to gender and weight status of college students in Ulsan. Korean J Nutr 2012; 45(4): 336-346.Article
- 11. Kim KH. A study on the dietary habits, the nutritional knowledge and the consumption pattern of university students in the Gwangju area. Korean J Community Nutr 2003; 8(2): 181-191.
- 12. Kim SB, Choi JH. Effects of nutrition education using food exchange system: changes in elementary students' nutrition knowledge, dietary attitude and nutrients intake. Korean J Community Nutr 2008; 13(6): 922-933.
- 13. Korean Diabetes Association. Diabetes and diet. 2012; cited 2012 May 4]. Available from http://www.diabetes.or.kr.
- 14. Koung SY. The effect of accumulative stress on depression and drinking problems among Chinese students in Korea. CheongJu University; 2010; MS thesis.
- 15. Ku BS. Study on the current status and the application plan of nutrition education related websites. Sungshin Women's University; 2007; MS thesis.
- 16. Lee EJ. A study on the accessibility and practical use of food and nutrition information from the internet. KyungHee University; 2009; MS thesis.
- 17. Lee KS, Kim KN. Effects of nutrition education on nutrition knowledge, dietary attitudes, and food behavior of college students. Korean J Community Nutr 1997; 2(1): 86-93.
- 18. Lee MS, Chung KS. The comparison in daily intake of nutrients, quality of diets and dietary habits between male and female college students in Daejeon. Korean J Community Nutr 2006; 11(1): 39-51.
- 19. Lee NY, Han JY. Health status of international students in Korea. J East West Nurs Res 2011; 17(1): 48-56.
- 20. Lim ES, Cho YS, Kim SN, Kim SB. Development and effects' analysis of nutrition education pamphlet for the higher grades elementary students. Korean J Community Nutr 2012; 17(6): 689-706.
- 21. Merkus MP, Mathus-Vliegen LM, Broekhoff C, Heijnen AM. Extreme obesity: Sociodemographic, familial and behavioural correlates in the netherlands. J Epidemiol Community Health 1995; 49(1): 22-27.
- 22. Mei B. Related factors of acculturation and acculturative stress of Chinese student's studying in Korea. Yeungnam University; 2010; MS thesis.
- 23. Ministry of Education. Foreign student statistics. 2010; cited 2011 November 4]. Available from http://www.mest.go.kr.
- 24. Oh JY, Kim SB. Development and effects' analysis of nutrition education program for diabetes mellitus at community health center -Focused on individual daily energy requirementsand food exchange units-. Korean J Community Nutr 2010; 15(4): 485-497.
- 25. Shi MD, Kim DY, Kim JW. A study on eating habits, exercise habits and body perception according to body mass index among Chinese international students in Korea. J Leis Wellness 2012; 3(1): 31-42.
- 26. Son MJ, Cho YS, Kim SN, Seo HJ, Kim SB. Development and effects' analysis of nutrition education pamphlet for the lower grades elementary students. Korean J Community Nutr 2011; 16(6): 647-660.
- 27. The Korean Nutrition Society. Dietary reference intakes for Korean. Seoul: Han-Arum Publishing Co.; 2010.
- 28. Tsugane S. Salt, salted food intake, and risk of gastric cancer: Epidemiologic evidence. Cancer Science 2005; 96(1): 1-6.PubMedPMC
- 29. Wang Y. A study on academic adjustment of Chinese college students in Korea. Myongji University; 2008; MS thesis.
- 30. Wu YF, Ma GS, Hu YH, Li YP. The current prevalence status of body overweight and obesity in China. Zhonghua Yu Fang Yi Xue Za Zhi 2005; 39(5): 316-320.PubMed
- 31. You JS, Chin JH, Kim MJ, Chang KJ. College students' dietary behavior, health-related lifestyles and nutrient intake status by physical activity levels using international physical activity questionnaire (IPAQ) in Incheon area. Korean J Nutr 2008; 41(8): 818-831.
- 32. Zhang JL, Liu XY, Lu HL, Li SY. An analysis and evaluation on nutrition education of college students. Chinese J Health Educ 2007; 23(8): 193-194.
- 33. 48Apps.biz. 2013; cited 2012 May 1]. Available from http://148apps.biz/app-store-metrics/?mpage=catcount.
REFERENCES
Figure & Data
REFERENCES
Citations

- Effects of Nutrition Education at a Community Health Center on Overweight and Obese Middle-aged Women in Jeonbuk Area-Focused on Personalized Daily Energy Requirement and Food Exchange Units
Se-Yeon Kim, Sook-Bae Kim
Korean Journal of Community Nutrition.2017; 22(4): 307. CrossRef - Comparisons of Health Related Lifestyle and Dietary Behaviors according to Gender, Ethnicity and Residence Type of University Students in Yanbian, China
Kyung Hee Hong, Unju Hwa Oh
The Korean Journal of Food And Nutrition.2016; 29(4): 486. CrossRef - A Study on Weight Control Behaviour, Eating Habits and Health-related Life Habits According to Obesity Degree of University Students in Jeonbuk
Hye-Soon Chang
Korean Journal of Human Ecology.2016; 25(1): 73. CrossRef - Acculturation and changes in dietary behavior and anthropometric measures among Chinese international students in South Korea
Jounghee Lee, Ran-Ran Gao, Jung-Hee Kim
Nutrition Research and Practice.2015; 9(3): 304. CrossRef - Survey on Health-related Factors, Nutrition Knowledge and Food Habits of College Students in Wonju Area
Seung Lim Lee, Sun Hee Lee
Korean Journal of Community Nutrition.2015; 20(2): 96. CrossRef - A study on hypertension relevant nutritional knowledge and dietary practices in Chinese college students studying in South Korea
Zhe Sun, Wookyoun Cho
Journal of Nutrition and Health.2015; 48(5): 441. CrossRef
Contents and tools of the nutrition education
Height, weight and body mass index of the subjects
1) Mean ± SD
2) BMI: Body Mass Index, BMI = Weight (kg) / Height (m)2
< 18.5: underweight, 18.5~22.9: normal, 23.0~24.9: overweight, ≥ 25.0: obese
3) N (%)
NS: Not Significant
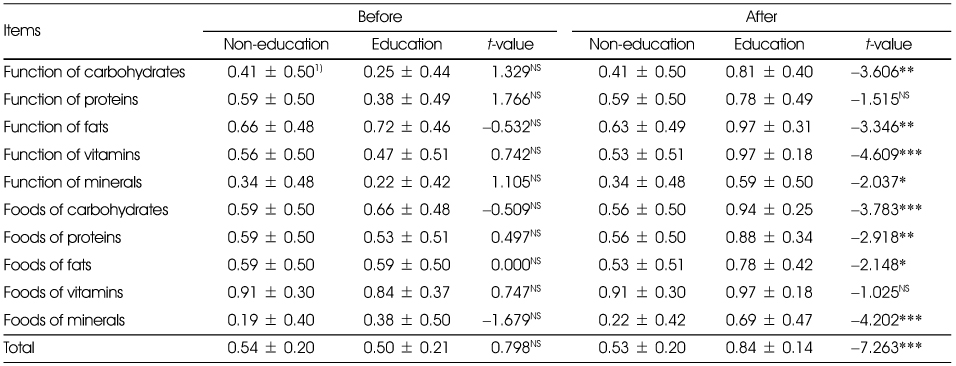
Effects on nutrition knowledge of the subjects
1) Mean ± SD (incorrect: 0, correct: 1)
NS: Not Significant
*: p < 0.05, **: p < 0.01, ***: p < 0.001 by t-test
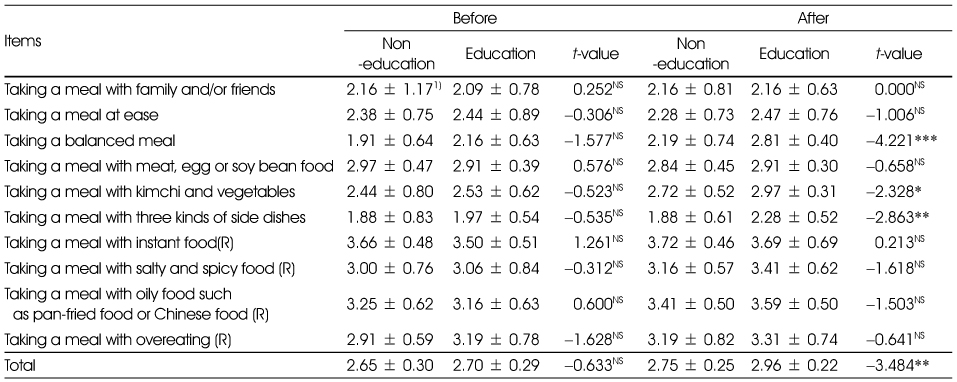
Effects on dietary attitudes of the subjects
1) Mean ± SD (Seldom : 1, often : 2, frequent : 3, always : 4)
(R) denotes a negatively phrased and reversely scored item
NS: Not Significant
*: p < 0.05, **: p < 0.01, ***: p < 0.001 by t-test
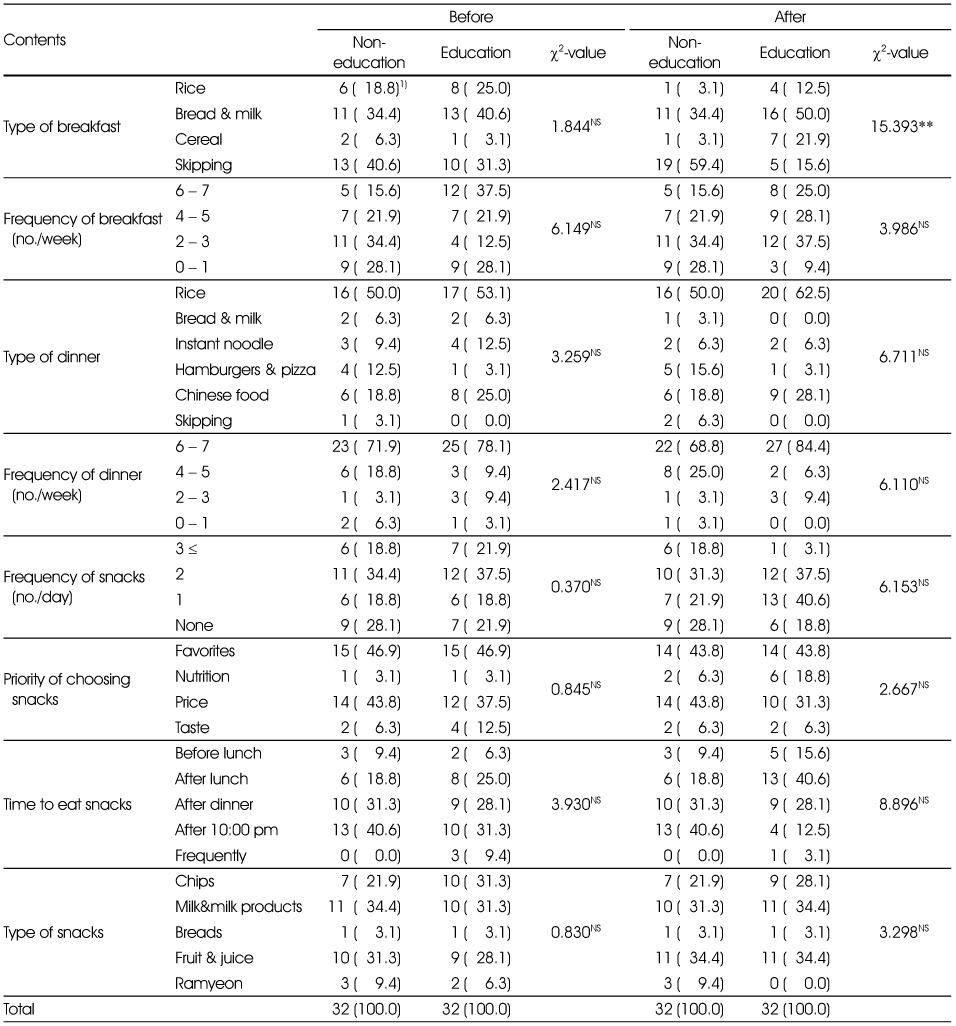
Effects on type and frequency of meals and snacks
1) N (%)
NS: Not Significant
**: p < 0.01 by chi-square test
Effects on energy, protein and fiber intake of the subjects
1) N (%)
EAR: Estimated Average Requirement, RNI: Recommended Nutrient Intake, AI: Adequate Intake
NS: Not Significant by Mann-Whitney U test
**: p<0.01 by Mann-Whitney U test
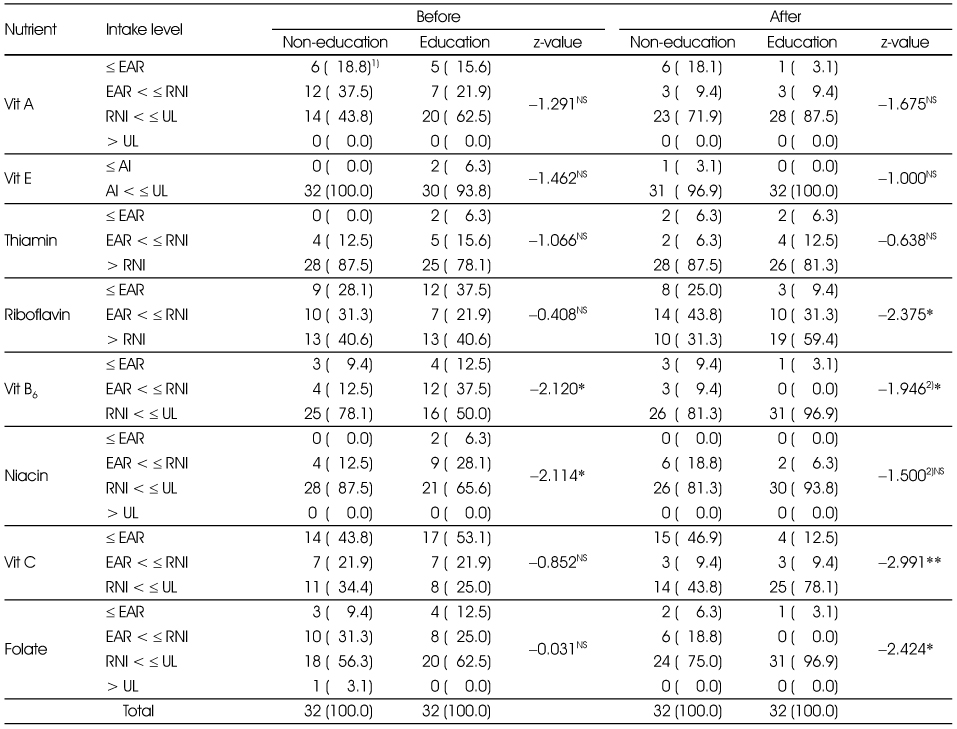
Effects on vitamin intake of the subjects
1) N (%)
2) by ANCOVA test
EAR: Estimated Average Requirement
RNI: Recommended Nutrient Intake
UL: Tolerable Upper Intake Level
AI: Adequate Intake
NS: Not Significant by Mann-Whitney U test
*: p < 0.05, **: p < 0.01 by Mann-Whitney U test
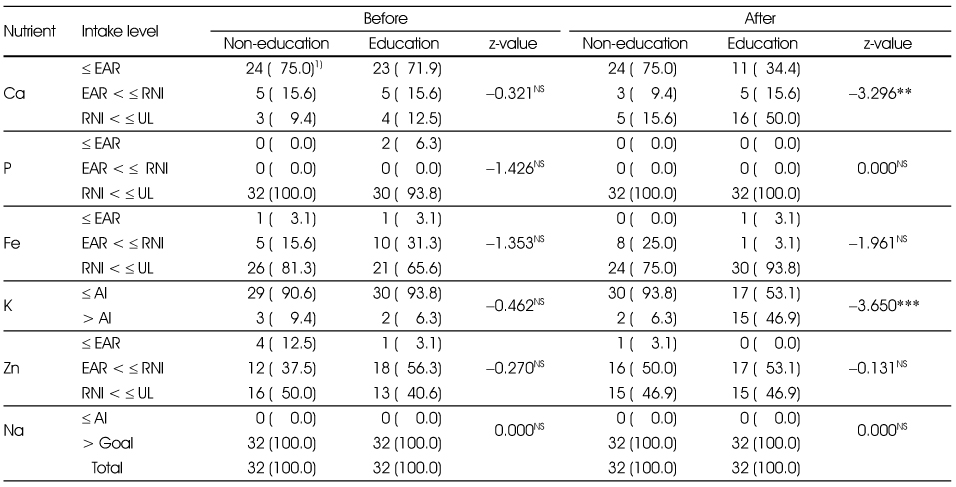
Effects on mineral intake of the subjects
1) N (%)
EAR: Estimated Average Requirement
RNI: Recommended Nutrient Intake
UL: Tolerable Upper Intake Level
AI: Adequate Intake
Goal: population nutrient intake goal
NS: Not Significant
**: p < 0.01, ***: p < 0.001 by Mann-Whitney U test
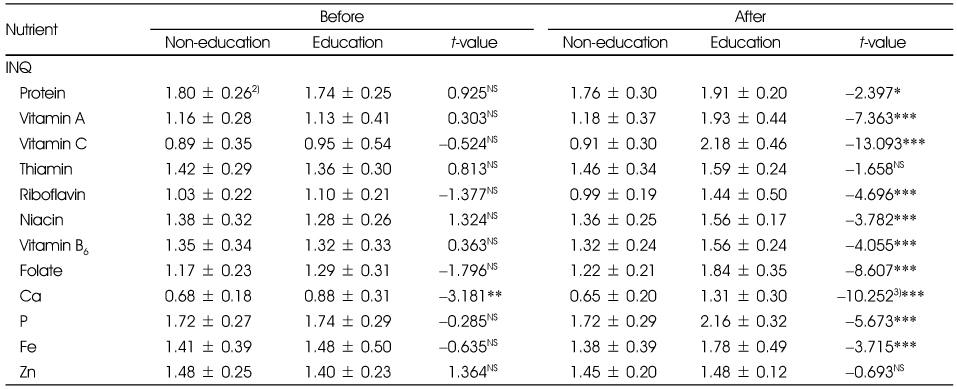
Effects on INQ1) of the subjects
1) INQ: Index of Nutrition Quality
2) Mean ± SD
3) by ANCOVA test
NS: Not Significant
*: p < 0.05, **: p < 0.01, ***: p < 0.001 by t-test
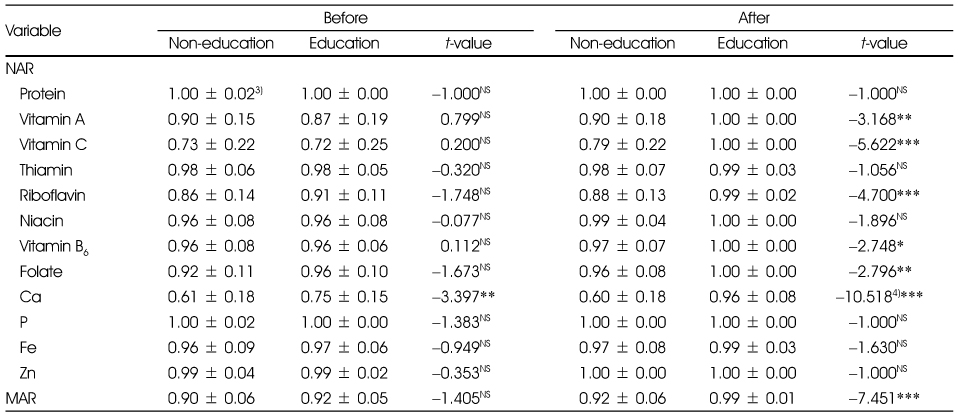
Effects on NAR1) and MAR2) of the subjects
1) NAR: Nutrition Adequacy Ratio
2) MAR: Mean Adequacy Ratio
3) Mean ± SD
4) by ANCOVA test
NS: Not Significant
*: p < 0.05, **: p < 0.01, ***: p < 0.001 by t-test
1) Mean ± SD 2) BMI: Body Mass Index, BMI = Weight (kg) / Height (m)2 < 18.5: underweight, 18.5~22.9: normal, 23.0~24.9: overweight, ≥ 25.0: obese 3) N (%) NS: Not Significant
1) Mean ± SD (incorrect: 0, correct: 1) NS: Not Significant *:
1) Mean ± SD (Seldom : 1, often : 2, frequent : 3, always : 4) (R) denotes a negatively phrased and reversely scored item NS: Not Significant *:
1) N (%) NS: Not Significant **:
1) N (%) EAR: Estimated Average Requirement, RNI: Recommended Nutrient Intake, AI: Adequate Intake NS: Not Significant by Mann-Whitney U test **:
1) N (%) 2) by ANCOVA test EAR: Estimated Average Requirement RNI: Recommended Nutrient Intake UL: Tolerable Upper Intake Level AI: Adequate Intake NS: Not Significant by Mann-Whitney U test *:
1) N (%) EAR: Estimated Average Requirement RNI: Recommended Nutrient Intake UL: Tolerable Upper Intake Level AI: Adequate Intake Goal: population nutrient intake goal NS: Not Significant **:
1) INQ: Index of Nutrition Quality 2) Mean ± SD 3) by ANCOVA test NS: Not Significant *:
1) NAR: Nutrition Adequacy Ratio 2) MAR: Mean Adequacy Ratio 3) Mean ± SD 4) by ANCOVA test NS: Not Significant *:

 KSCN
KSCN



 PubReader
 Cite
Cite


