Articles
- Page Path
- HOME > Korean J Community Nutr > Volume 22(1); 2017 > Article
-
Research Article
- Comparison of Nutritional Status and Eating Behavior of Korean and Chinese Children using the Nutrition Quotient (NQ)
-
Hua Ling, Hokyung Ryu

-
Korean Journal of Community Nutrition 2017;22(1):22-39.
DOI: https://doi.org/10.5720/kjcn.2017.22.1.22
Published online: February 28, 2017
Department of Food Science and Nutrition, Pusan National University, Busan, Korea.
- Corresponding author: Hokyung Ryu. Department of Food Science and Nutrition, Pusan National University, 2, Busandaehak-ro 63beon-gil, Geumjeong-gu, Busan 46241, Korea. Tel: (051) 510-7397, Fax: (051) 583-3648, hokryu@pusan.ac.kr
Copyright © 2017 The Korean Society of Community Nutrition
This is an Open-Access article distributed under the terms of the Creative Commons Attribution Non-Commercial License (http://creativecommons.org/licenses/by-nc/3.0/) which permits unrestricted non-commercial use, distribution, and reproduction in any medium, provided the original work is properly cited.
- 144 Views
- 0 Download
- 1 Crossref
Abstract
-
Objectives
- This study was conducted to investigate the nutritional status and dietary behavior of Korean and Chinese elementary school children using Nutritional Quotient (NQ).
-
Methods
- The survey was conducted by distributing questionnaires to the parents of the child, after selecting four elementary schools located in Pusan city of Korea and three elementary schools located in Luoyang city, Henan Province of China, from Grade 1 to Grade 6 in each school.
-
Results
- The NQ scores of Korean children and Chinese children were 64.99 and 66.57, respectively, which did not show a statistically significant difference. Korean children significantly showed higher diversity score (p<0.001) than Chinese, but Chinese children significantly showed higher moderation (p < 0.001), regularity (p < 0.001) and practice score (p < 0.01) than Korean. NQ grades showed a statistically significant difference. According to food security of the household, NQ scores of the Chinese children of secure household were significantly higher than those of food insecurity household (p < 0.01). In particular, it showed a significant difference in the practice (p < 0.001), moderation (p < 0.05) and regularity score (p < 0.05). Korean children's NQ score showed a significant correlation with the score of following the Dietary Guidelines of parents, but Chinese did not show such a correlation.
-
Conclusions
- There were differences in children's dietary behaviors and parents' impact to children's dietary attitude between Korean and Chinese. NQ developed for Korean could be successfully applied to Chinese.
- 1. Kang HL. Relationship of food frequency with emotion and cognition in healthy elementary school children [master's thesis]. Kyung Hee University; 2014.
- 2. Ministry of Health and Welfare. Korea Centers for Disease Control and Prevention. Korea Health Statistics 2014: Korea National Health and Nutrition Examination Survey (KNHANESVI-2) [Internet]. Ministry of Health and Welfare; 2015; cited 2016 Dec 15]. Available from: https://knhanes.cdc.go.kr/.
- 3. Zhang T. Effect of malnutrition on children's healthy development. Chin J Child Heal Care 2012; 20(5): 388-390.
- 4. National Health and Family Planning Commission of the People's Republic of China. Diagram : Nutritional and chronic diseases in China [Internet]. 2015; cited 2017 Jan 9]. Available from: http://www.nhfpc.gov.cn/jkj/s5879/201506/4505528e65f3460fb88685081ff158a2.shtml.
- 5. Kim HY, Kwon S, Lee JS, Choi YS, Chung HR, Kwak TK. Development of a Nutrition Quotient (NQ) equation modeling for children and the evaluation of its construct validity. Korean J Nutr 2012; 45(4): 390-399.Article
- 6. Lee JM, Park HJ, Park SM. A survey on eating behaviors of preschool children for development snack. Korean J Food Cult 2003; 18(2): 151-159.
- 7. Haines PS, Siega-Riz AM, Popkin BM. The diet quality index revised: a measurement instrument for populations. J Am Diet Assoc 1999; 99(6): 697-704.PubMed
- 8. Guenther PM, Reedy J, Krebs-Smith SM, Reeve BB, Basiotis PP. Development and evaluation of the healthy eating index-2005. Technical report [Internet]. Alexandria (VA): Center for Nutrition Policy and Promotion, U.S. Department of Agriculture; 2007; cited 2017 Jan 9]. Available from: https://vtechworks.lib.vt.edu/bitstream/handle/10919/18682/HEI-2005TechnicalReport.pdf?sequence=3&isAllowed=y.
- 9. Kang MH, Lee JS, Kim HY, Kwon SH, Choi YS, Chung HR, et al. Selecting items of a food behavior checklist for the development of Nutrition Quotient (NQ) for children. Korean J Nutr 2012; 45(4): 372-389.Article
- 10. Lim JY, Kim JH, Min SH, Lee MH, Lee MJ. Evaluation of dietary behavior among elementary school students in Seoul area using nutrition quotient for children. Korean J Food Cookery Sci 2016; 32(1): 84-95.
- 11. Park JK. Development and validation of Korean food security measures. Korea Centers For Disease Control and Prevention; 2012 02. Report No.11-1351159-000002-03.
- 12. Jun S, Hong EJ, Joung HJ. Flavonoid intake according to food security in Korean adults: Based on the Korea National Health and Nutrition Examination Survey 2007-2012. J Nutr Health 2015; 48(6): 507-518.
- 13. Hong MJ. Analyses on household food insecurity and related factors among those from low-income neighbors in urban areas [master's thesis]. Kyung Hee University; 2002.
- 14. Siefert K, Heflin CM, Corcoran ME, Williams DR. Food insufficiency and the physical and mental health of low-income women. Women Health 2001; 32(1-2): 159-177.PubMed
- 15. Siefert K, Heflin CM, Corcoran ME, Williams DR. Food insufficiency and physical and mental health in a longitudinal survey of welfare recipients. J Health Soc Behav 2004; 45(2): 171-186.PubMed
- 16. Kim JR, Lim HS. Relationships between children's Nutrition Quotient and the practice of the Dietary Guidelines of elementary school students and their mothers. J Nutr Health 2015; 48(1): 58-70.
- 17. Oh SY, Hong MJ. Food insecurity is associated with dietary intake and body size of Korean children from low-income families in urban areas. Eur J Clin Nutr 2003; 57(12): 1598-1604.
- 18. Korea Centers for Disease Control and Prevention. The Korea Pediatric Society. Korean children and adolescents growth standard [internet]. 2007; cited 2017 Jan 9]. Available from: http://www.cdc.go.kr/.
- 19. Ji CY, Zhang L, Ma J, Chen TJ, Lin M, Cheng XP, et al. Screening standard for malnutrition of school-age children and adolescents. National Health and Family Planning Commission of the People's Republic of China; 2014 01. Report No. WS/T 456-2014. ICS 13.100 C 56..
- 20. Li H, Ji CY, Zong XN, Zhang YQ. Body mass index growth curves for Chinese children and adolescents aged 0 to 18 years. Chin J Pediatr 2009; 47(7): 493-498.
- 21. Kim NH, Lee IS. Assessment of nutritional status of children in community child center by Nutrition Quotient(NQ): Gyeongiu. J East Asian Soc Diet Life 2015; 25(1): 73-86.
- 22. Choi KS, Shin KO, Jung TH, Chung KH. A study on the differences in the dietary habits, nutrient intake and health status of vegetarian (lacto-ovo vegetarian) and non-vegetarian Korean elementary school children. J Korean Soc Food Sci Nutr 2011; 40(3): 416-425.
- 23. Boo MN, Cho SK, Park K. Evaluation of dietary behavior and nutritional status of elementary school students in Jeju using nutrition quotient. J Nutr Health 2015; 48(4): 335-343.
- 24. Yoo JS, Choi YS. Evaluation of items for the food behavior checklist and nutrition quotient score on children in rural areas of Gyeongbuk. J Nutr Health 2013; 46(5): 427-439.
- 25. Huang YC, Kim HY. Assessment of dietary behavior of Chinese children using nutrition quotient for children. J Nutr Health 2014; 47(5): 342-350.
- 26. Kim KH. Food habits, eating behaviors and food frequency by gender and among Seoul and other regions in upper-grade elementary school children. Korean J Community Nutr 2010; 15(2): 180-190.
- 27. Yon MY, Han YH, Hyun TS. Dietary habits, food frequency and dietary attitudes by gender and nutrition knowledge level in upper-grade school children. Korean J Community Nutr 2008; 13(3): 307-322.
- 28. Kim EJ, Yang KM. General characteristics and eating styles by gender and nutrition knowledge level in upper-grade school children in Gyeongbuk. Fam Environ Res 2011; 49(1): 27-39.
- 29. Tingay RS, Tan CJ, Tan NC, Tang S, Teoh PF, Wong R, et al. Food insecurity and low income in an English inner city. J Public Health Med 2003; 25(2): 156-159.
- 30. Leung CW, Epel ES, Ritchie LD, Crawford PB, Laraia BA. Food insecurity is inversely associated with diet quality of lower-income adults. J Acad Nutr Diet 2014; 114(12): 1943-1953.
- 31. Kim JH, Jung YH. Evaluation of food behavior and nutritional status of preschool children in Nowon-gu of Seoul by using Nutrition Quotient (NQ). Korean J Community Nutr 2014; 19(1): 1-11.
- 32. Nam ES, Jung AY, Park SI. Survey on the intake and consumption patterns of milk and dairy products by elementary school students. Korean J Food Nutr 2011; 24(2): 191-203.
- 33. Yon M, Hyun TS. Development of an eating habit checklist for screening elementary school children at high risk of energy overintake. Korean J Nutr 2008; 41(5): 414-427.
- 34. Yoo JS. Investigation of dietary intake and nutrition quotient (NQ) by elementary school children in Gyeongbuk area [master's thesis]. Daegu University; 2012.
- 35. Na SY, Ko SY, Eom SH, Kim KW. Intakes and beliefs of vegetables and fruits, self-efficacy, nutrition knowledge, eating behavior of elementary school students in Kyunggi area. Korean J Community Nutr 2010; 15(3): 329-341.
- 36. Fan XY, Chen ZL. Children's dietary behavior and the influence of their parents. Chin J Sch Doc 2005; 19(3): 328-330.
- 37. Liu HH, Chen JJ. The formation of children's eating behavior under the influence of their parents. Chin J Child Heal Care 2014; 22(2): 161-163.
- 38. You JS, Kim SM, Chang KJ. Nutritional knowledge and dietary behavior of the 6th grade elementary school students in Daejeon area by gender and skipping breakfast. Korean J Nutr 2009; 42(3): 256-267.
REFERENCES
Democratic characteristics of the children
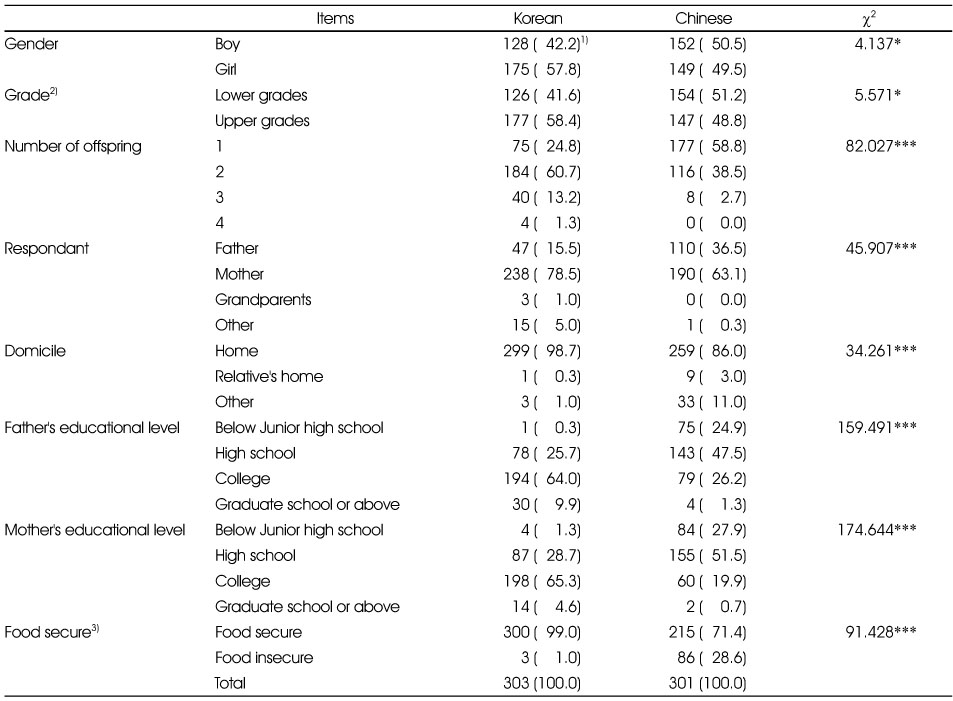
1) N (%)
2) Lower grades (1 – 3): 6 – 9 years old, Upper grades (4 – 6): 10 – 12 years old
3) Without children: Food secure 0 – 2, Food insecure without hunger 3 – 5, Food insecure with hunger (moderate) 6 – 8, Food insecure with hunger (severe) 9 – 10. With children: Food secure 0 – 2, Food insecure without hunger 3 – 7, Food insecure with hunger (moderate) 8-12, Food insecure with hunger (severe) 13 – 18.
*: p < 0.05, ***: p < 0.001
Physical status of children

1) Values are Mean±SD.
2) Korean: Based on growth charts for Korean Children and adolescents (2007), Underweight: BMI percentile < 5, Normal weight: 5 ≤ BMI percentile < 85, Overweight: 85 ≤ BMI percentile < 95, Obesity: BMI percentile ≥ 95. Chinese: Underweight: Screening standard for malnutrition of school-age children and adolescents (WS/T 456-2014). Normal weight, Overweight, Obesity: Body mass index growth curves for Chinese children and adolescents aged 0 to 18 years (H Li,CY Ji, XN Zong, YQ Zhang 2009).
3) N (%)
**: p < 0.01
NQ score and NQ grades of children between Korean and Chinese

1) Factor score = sum of [checklist item score (0 – 100) × rounded item weight within a factor], NQ score = sum of [checklist item score (0 – 100) × item weight within NQ
2) Values are Mean±SD.
3) Highest (100~80.9), High (73.8~80.8), Medium (56.5~73.7), Low (47.6~56.4), Lowest (0~47.5)
4) N (%)
*: p < 0.05, **: p < 0.01, ***: p < 0.001
NQ score and NQ grades of Chinese children by food security
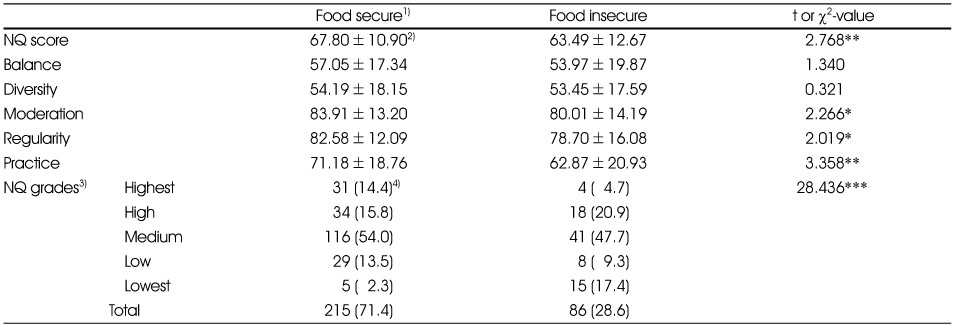
1) Without children: Food secure 0 – 2, Food insecure without hunger 3 – 5, Food insecure with hunger (moderate) 6 – 8, Food insecure with hunger (severe) 9 – 10. With children: Food secure 0 – 2, Food insecure without hunger 3 – 7, Food insecure with hunger (moderate) 8 – 12, Food insecure with hunger (severe) 13 – 18.
2) Values are Mean±SD.
3) Best (100~80.9), Excellence (73.8~80.8), Ordinary (56.5~73.7), Imperfectly (47.6~56.4), Bad (0~47.5)
4) N (%)
*: p < 0.05, **: p < 0.01, ***: p < 0.001
Figure & Data
REFERENCES
Citations

- Diet-Related Disparities and Childcare Food Environments for Vulnerable Children in South Korea: A Mixed-Methods Study
Jiyoung Park, Seolhyang Baek, Gahui Hwang, Chongwon Park, Sein Hwang
Nutrients.2023; 15(8): 1940. CrossRef
Democratic characteristics of the children
1) N (%)
2) Lower grades (1 – 3): 6 – 9 years old, Upper grades (4 – 6): 10 – 12 years old
3) Without children: Food secure 0 – 2, Food insecure without hunger 3 – 5, Food insecure with hunger (moderate) 6 – 8, Food insecure with hunger (severe) 9 – 10. With children: Food secure 0 – 2, Food insecure without hunger 3 – 7, Food insecure with hunger (moderate) 8-12, Food insecure with hunger (severe) 13 – 18.
*: p < 0.05, ***: p < 0.001
Physical status of children
1) Values are Mean±SD.
2) Korean: Based on growth charts for Korean Children and adolescents (2007), Underweight: BMI percentile < 5, Normal weight: 5 ≤ BMI percentile < 85, Overweight: 85 ≤ BMI percentile < 95, Obesity: BMI percentile ≥ 95. Chinese: Underweight: Screening standard for malnutrition of school-age children and adolescents (WS/T 456-2014). Normal weight, Overweight, Obesity: Body mass index growth curves for Chinese children and adolescents aged 0 to 18 years (H Li,CY Ji, XN Zong, YQ Zhang 2009).
3) N (%)
**: p < 0.01
NQ score and NQ grades of children between Korean and Chinese
1) Factor score = sum of [checklist item score (0 – 100) × rounded item weight within a factor], NQ score = sum of [checklist item score (0 – 100) × item weight within NQ
2) Values are Mean±SD.
3) Highest (100~80.9), High (73.8~80.8), Medium (56.5~73.7), Low (47.6~56.4), Lowest (0~47.5)
4) N (%)
*: p < 0.05, **: p < 0.01, ***: p < 0.001
NQ score and NQ grades of Chinese children by food security
1) Without children: Food secure 0 – 2, Food insecure without hunger 3 – 5, Food insecure with hunger (moderate) 6 – 8, Food insecure with hunger (severe) 9 – 10. With children: Food secure 0 – 2, Food insecure without hunger 3 – 7, Food insecure with hunger (moderate) 8 – 12, Food insecure with hunger (severe) 13 – 18.
2) Values are Mean±SD.
3) Best (100~80.9), Excellence (73.8~80.8), Ordinary (56.5~73.7), Imperfectly (47.6~56.4), Bad (0~47.5)
4) N (%)
*: p < 0.05, **: p < 0.01, ***: p < 0.001
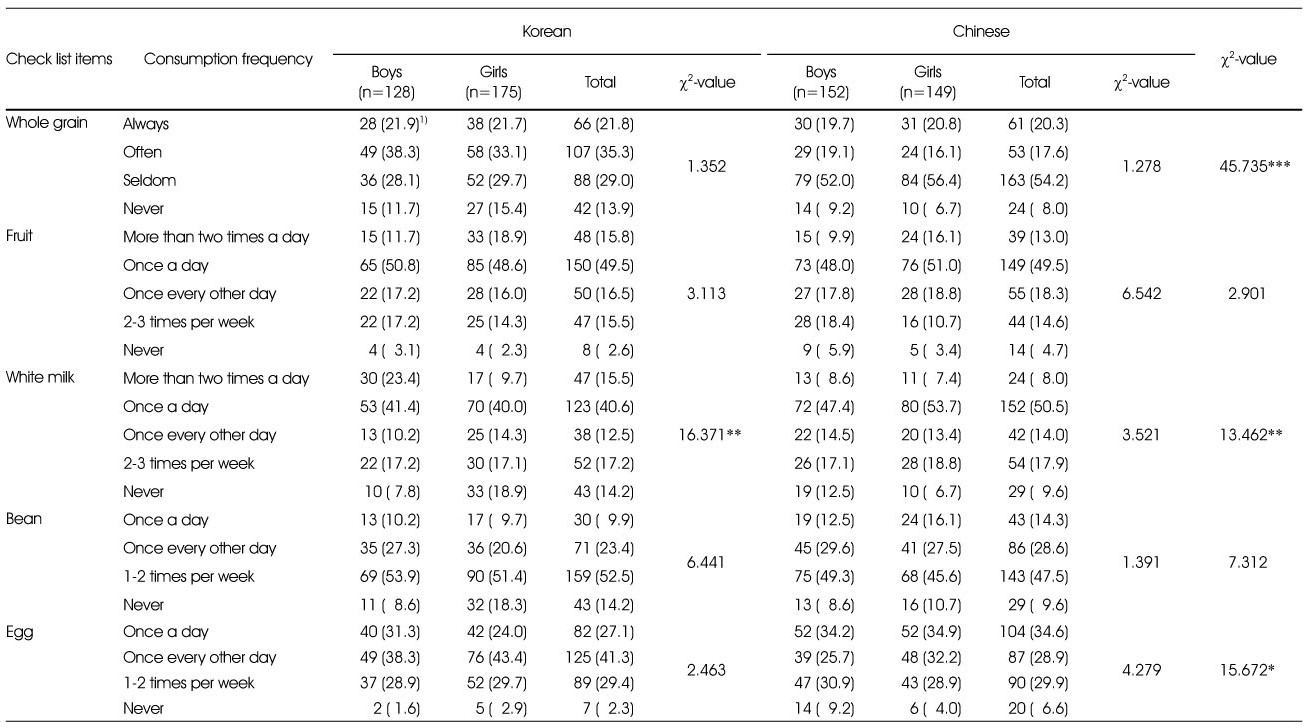
Comparison of checklist items for balance factor
1) N (%)
*: p < 0.05, **: p < 0.01, ***: p < 0.001
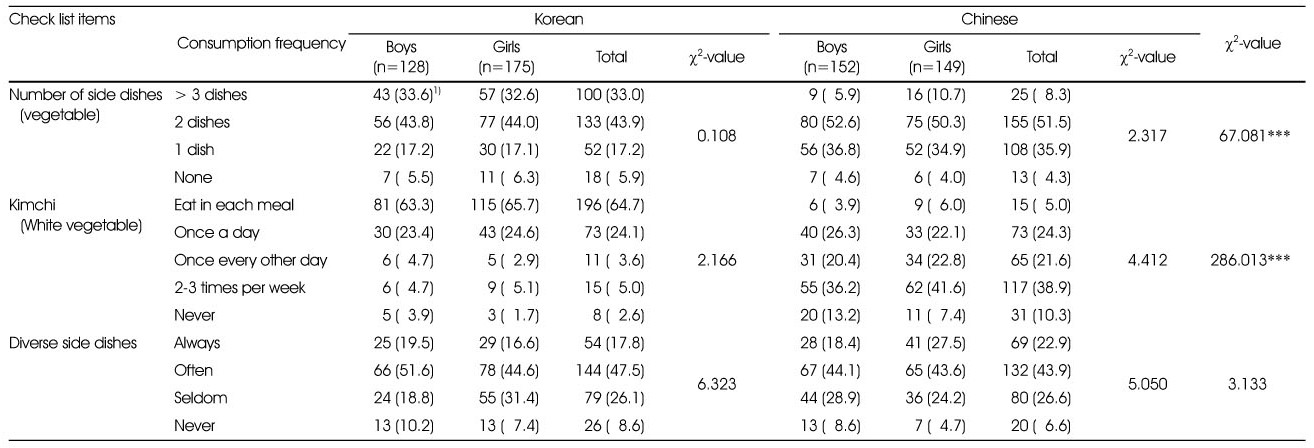
Comparison of checklist items for diversity factor
1) N (%)
***: p < 0.001
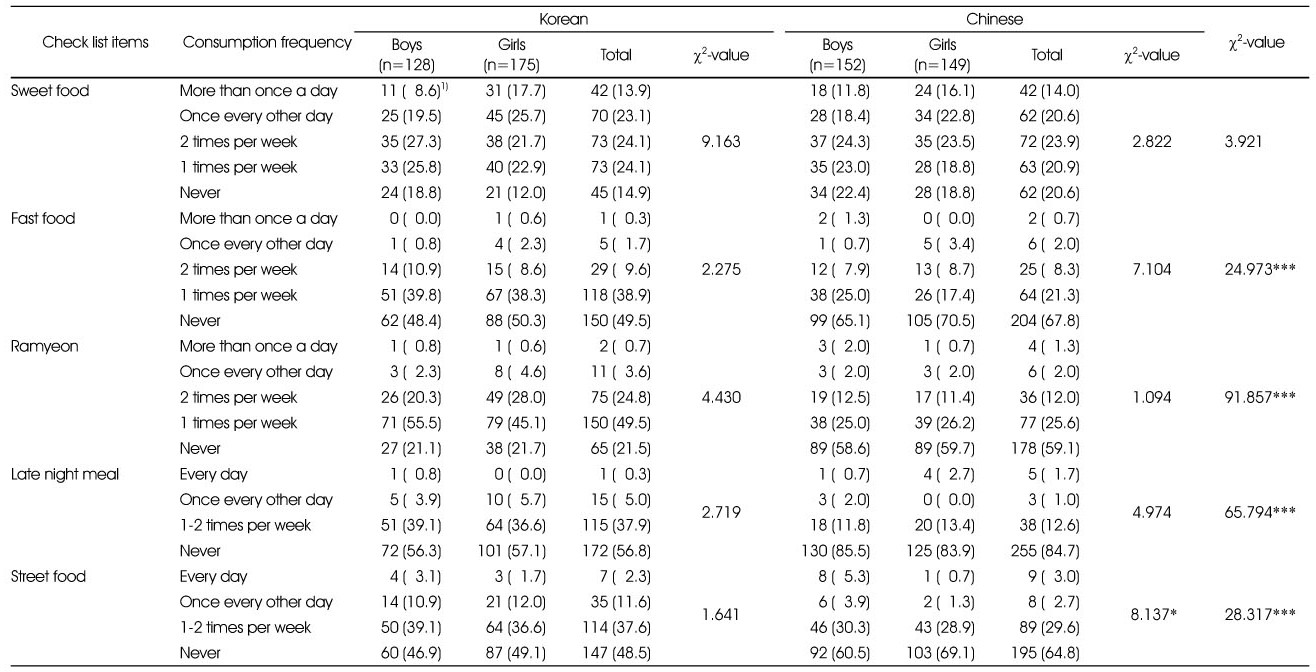
Comparison of checklist items for moderation factor
1) N (%)
*: p < 0.05, ***: p < 0.001
Comparison of checklist items for regularity factor
1) N (%), ***: p < 0.001
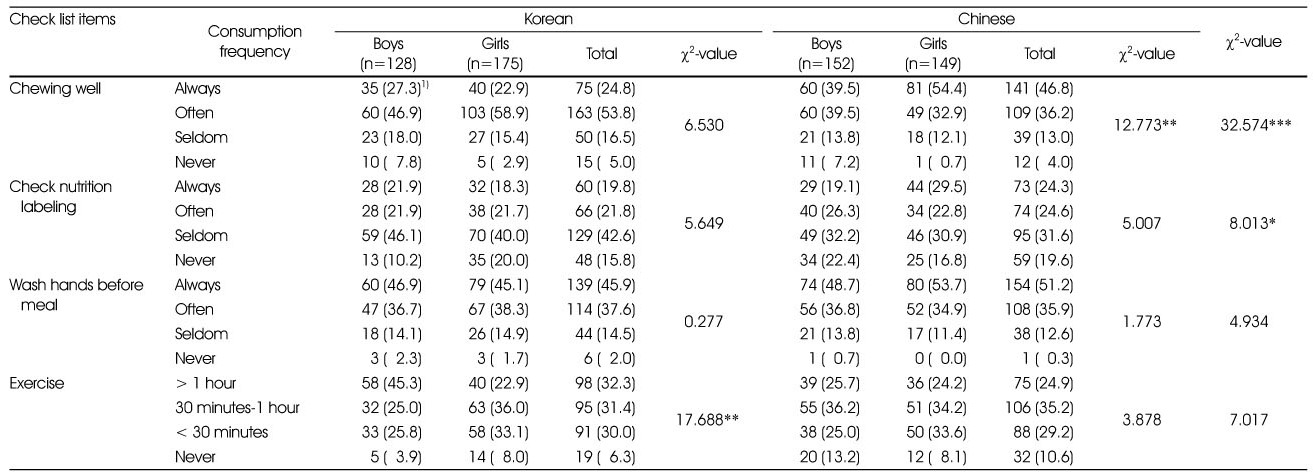
Comparison of checklist items for practice factor
1) N (%), *: p < 0.05, **: p < 0.01, ***: p < 0.001
Relationship of children's NQ score with parent's practicing score of Dietary Guidelines
Partial correlation coefficients
Adjusted for nationality, gender, grade, father's educational level, mather's educational level, food secure
*: p < 0.05, **: p < 0.01, ***: p < 0.001
1) N (%) 2) Lower grades (1 – 3): 6 – 9 years old, Upper grades (4 – 6): 10 – 12 years old 3) Without children: Food secure 0 – 2, Food insecure without hunger 3 – 5, Food insecure with hunger (moderate) 6 – 8, Food insecure with hunger (severe) 9 – 10. With children: Food secure 0 – 2, Food insecure without hunger 3 – 7, Food insecure with hunger (moderate) 8-12, Food insecure with hunger (severe) 13 – 18. *: p < 0.05, ***: p < 0.001
1) Values are Mean±SD. 2) Korean: Based on growth charts for Korean Children and adolescents (2007), Underweight: BMI percentile < 5, Normal weight: 5 ≤ BMI percentile < 85, Overweight: 85 ≤ BMI percentile < 95, Obesity: BMI percentile ≥ 95. Chinese: Underweight: Screening standard for malnutrition of school-age children and adolescents (WS/T 456-2014). Normal weight, Overweight, Obesity: Body mass index growth curves for Chinese children and adolescents aged 0 to 18 years (H Li,CY Ji, XN Zong, YQ Zhang 2009). 3) N (%) **: p < 0.01
1) Factor score = sum of [checklist item score (0 – 100) × rounded item weight within a factor], NQ score = sum of [checklist item score (0 – 100) × item weight within NQ 2) Values are Mean±SD. 3) Highest (100~80.9), High (73.8~80.8), Medium (56.5~73.7), Low (47.6~56.4), Lowest (0~47.5) 4) N (%) *: p < 0.05, **: p < 0.01, ***: p < 0.001
1) Without children: Food secure 0 – 2, Food insecure without hunger 3 – 5, Food insecure with hunger (moderate) 6 – 8, Food insecure with hunger (severe) 9 – 10. With children: Food secure 0 – 2, Food insecure without hunger 3 – 7, Food insecure with hunger (moderate) 8 – 12, Food insecure with hunger (severe) 13 – 18. 2) Values are Mean±SD. 3) Best (100~80.9), Excellence (73.8~80.8), Ordinary (56.5~73.7), Imperfectly (47.6~56.4), Bad (0~47.5) 4) N (%) *: p < 0.05, **: p < 0.01, ***: p < 0.001
1) N (%) *: p < 0.05, **: p < 0.01, ***: p < 0.001
1) N (%) ***: p < 0.001
1) N (%) *: p < 0.05, ***: p < 0.001
1) N (%), ***: p < 0.001
1) N (%), *: p < 0.05, **: p < 0.01, ***: p < 0.001
Partial correlation coefficients Adjusted for nationality, gender, grade, father's educational level, mather's educational level, food secure *: p < 0.05, **: p < 0.01, ***: p < 0.001

 KSCN
KSCN


 PubReader
 Cite
Cite


