Trends in growth and nutritional status of Korean toddlers and preschoolers: a cross-sectional study using 2010–2021 Korea National Health and Nutrition Examination Survey data
Article information

Abstract
Objectives
We aimed to analyze trends in growth and nutrient intake patterns in Korean toddlers and preschoolers and generate data for international comparisons of early childhood growth status.
Methods
Overall, 3,661 children aged 1–4 years were included. This study used the data from the 5th–8th Korea National Health and Nutrition Examination Survey. The weight-for-height, height-for-age, weight-for-age, and body mass index-for-age z-scores of the participants were calculated using the World Health Organization 2006 child growth z-score reference cutoff points. The 24-hour recall method was used to determine dietary intake, which was assessed according to the Dietary Reference Intakes for Koreans. All statistical analyses were conducted and weighted according to a complex sample design.
Results
Most Korean toddlers and preschoolers demonstrated normal growth, with an increasing trend noted over the survey period. Concurrently, the prevalence of overweight decreased. The mean intake of energy from fat exhibited an upward trend, paralleling that of protein and fat. Conversely, the intake of several essential micronutrients declined. The prevalence of nutritional inadequacy showed significant variation throughout the survey period: the proportion of inadequacy in carbohydrate intake decreased, whereas those of iron, vitamin A, thiamin, niacin, and vitamin C increased.
Conclusion
South Korea is making significant progress in supporting toddlers and preschoolers, as evidenced by consistent increases in the proportion of children with normal growth and decreases in the prevalence of malnutrition. Future research should focus on exploring dietary patterns and analyzing specific food groups that are essential for promoting optimal growth and nutritional status in children.
INTRODUCTION
Childhood is a critical period for growth and development that lays the foundation for health and well-being. Adequate nutrition during early childhood is essential for healthy growth and development [1]. In 2022, an estimated 45.0 million children aged < 5 years (6.8%) suffered from wasting, and 13.7 million (2.1%) experienced severe wasting. Additionally, in 2019, at least 340 million children under 5, or one in every two, had micronutrient deficiencies [2, 3].
Malnutrition in early childhood can have severe and long-lasting consequences. Wasting in children weakens their immune system, making them more susceptible to illnesses and death. Those who survive often face growth restrictions and long-term developmental issues. Micronutrient deficiencies adversely affect survival, growth, immunity, and brain development [4-6]. Overweight or obese children are likely to suffer from low self-esteem, poor mental health, and a higher risk of noncommunicable diseases, such as cardiovascular disease, in adulthood [7]. Currently, 37 million children aged < 5 years globally are overweight, marking an increase of almost 4 million since the year 2000 [2]. South Korea has seen a rise in childhood obesity rates due to significant socioeconomic changes over the past few decades that have altered dietary patterns and lifestyle behaviors, affecting the growth and nutritional status of children [8]. The prevalence of obesity among children aged 2–18 years increased from 8.6% in 2001 to 9.8% in 2017 [9].
Changes in the stages of the nutrition transition have exacerbated disparities in nutrient intake across the population. The Korea National Health and Nutrition Examination Survey (KNHANES) data (2009–2011) indicated that children aged 1–5 years from lower-income households were more likely to have elevated weight-for-height and faced a higher risk of inadequate intake of micronutrients such as thiamin and vitamin C compared to their higher-income counterparts [10]. A study on calcium intake among Korean children and adolescents (aged 1–18 years) revealed that 75.0% experienced inadequate intake, with the prevalence increasing significantly from toddlers (45%–55%) to adolescents (78%–86%) [11].
Undernutrition in Korea appears to have been largely resolved and is now a primary concern in developing nations. However, continuous monitoring and analysis of growth trends and nutrient intake patterns among Korean children remains essential because of the dynamic nature of their dietary habits and lifestyle behaviors. We aimed to provide an updated and comprehensive analysis of these trends in Korean toddlers and preschoolers, contributing to the generation of internationally comparable data for cross-national research and policy insights.
METHODS
Ethics statement
Written informed consent was obtained from all participants and/or their guardians for the survey. The survey procedures and protocols were approved by the Institutional Review Board (IRB No. 2010-02CON-21-C, 2011-02CON-06-C, 2012-01EXP-01-2C, 2013-07CON-03-4C, 2013-12EXP-03-5C, 2018-01-03-P-A, 2018-01-03-C-A, 2018-01-03-2C-A, 2018-01-03-5C-A). The survey was conducted in accordance with the guidelines outlined in the Declaration of Helsinki.
1. Study design
This cross-sectional study was conducted in accordance with the Strengthening the Reporting of Observational Studies in Epidemiology (STROBE) guidelines (https://www.strobe-statement.org/).
2. Study subjects
This study used nationally representative data from KNHANES for the following periods: 5th (2010–2012), 6th (2013–2015), 7th (2016–2018), and 8th (2019–2021). Conducted by the Korea Disease Control and Prevention Agency, KNHANES serves as a national surveillance system tasked with evaluating the health and nutritional status of Koreans. It gathers comprehensive data regarding participants’ demographic, social, health, and nutritional statuses through three primary surveys: a health interview, health examination, and nutrition survey [12].
The sampling plan utilized a stratified multistage clustered probability sampling design. This study concentrated on toddlers and preschoolers aged 1–4 years (n = 3,859). Participants lacking height, weight, household, or nutritional intake data (n = 162) and those with implausible energy intake (< 1st and > 99th percentile, n = 36) were excluded, yielding a final sample of 3,661 toddlers and preschoolers.
3. Anthropometric assessment
Height and weight were measured following a standardized protocol during health examinations. Participants wore light clothing without shoes, and their weight was measured to the nearest 0.1 kg using a GL-6000-20 scale (G-Tech International Co., Ltd.). The height was measured to the nearest 0.1 cm. The caregivers were asked to remove the children’s socks, shoes, and hair ornaments before the measurements. Children who could stand were measured using a seca 274 (seca), whereas those aged < 2 years were measured in the supine position using a seca 416 (seca). The World Health Organization (WHO) 2006 child growth z-score reference cutoff points were used to classify children’s growth and nutritional status [13, 14]. The weight-for-height z-scores (WHZ), height-for-age z-scores (HAZ), weight-for-age z-scores (WAZ), and body mass index (BMI)-for-age z-scores (BAZ) were calculated using the WHO Anthro software (version 3.2.2; WHO) [15]. The WHO classification is as follows:
a. Nutritional status based on WHZ
Wasted: < –2
Normal: ≥ –2 to 2
Overweight: > 2
b. Nutritional status based on HAZ
Stunted: < –2
Not stunted: ≥ –2
c. Nutritional status based on WAZ
Underweight: < –2
Normal: ≥ –2 to 2
Overweight: > 2
d. Nutritional status based on BAZ
Wasted: < –2
Normal: ≥ –2 to 2
Overweight: > 2
4. Nutritional assessment
The nutritional survey employed a 24-hour recall method. Nutrient intake was evaluated based on age-specific intake reference values from the 2020 Dietary Reference Intakes for Koreans (KDRIs) and the 2010 KDRIs for vitamin A intake during the 5th and 6th surveys [16, 17]. The prevalence of nutrient inadequacy was determined as the percentage of children whose nutrient intake fell below the estimated average requirement (EAR). The EARs used in this study are shown in Table 1.
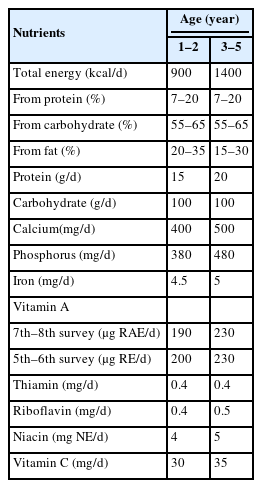
Dietary reference intakes for Korean children aged 1–4 years
5. Statistical analysis
Sample weights were derived using a complex survey design, nonresponse rate, and post-stratification, then applied to all analyses to represent the Korean population. Data are presented as weighted percentages and standard errors (SE) for categorical variables, and weighted mean and SE for continuous variables. General characteristics were analyzed using the Rao–Scott chi-square test for categorical variables and analysis of variance for continuous variables, with subsequent Bonferroni testing if significant differences were detected. Complex sample analysis employed the Rao–Scott chi-square test to compare children’s growth status distribution and nutrient intake below the EAR based on survey timing. Linear trends were analyzed using a General Linear Model for continuous variables and Logistic Regression for categorical variables to assess changes in consumption and growth status over time. All analyses were conducted using IBM SPSS software version 27 (IBM Co.). The level of statistical significance was set at α = 0.05.
RESULTS
1. Sociodemographic characteristics
Table 2 summarizes the sociodemographic characteristics of the participants. The distribution trend over the survey period was observed for household income (P < 0.001). This study included toddlers and preschoolers, with 47.4% aged 1–2 years and 52.6% aged 3–4 years. The gender distribution showed that 51.4% of the participants were boys. Based on geographical distribution, more than half of the children (85.8%) resided in urban areas, whereas 14.2% lived in rural regions. Moreover, 40.6% of participants were from lower-income households, while 59.4% belonged to upper-income households. Household income trends indicated an increase in the upper-income category and a decrease in the lower income.

Sociodemographic characteristics of Korean children aged 1–4 years across survey periods (n = 3,661)
2. Nutritional characteristics
Anthropometric data revealed significant patterns of physical growth across the survey period, as shown in Table 3. Both height (P < 0.01) and weight (P <0.05) significantly increased during the survey period. However, only height showed a consistent upward trend (P < 0.001), with an average value of 94.6 cm. Weight averaged 14.7 kg but did not show a clear upward trend. BMI analysis revealed a significant decrease (P < 0.001) over time, which was consistent with the observed decreasing trend (P < 0.001). The mean BMI was 16.3, indicating a reduction in BMI over the survey duration.

Nutritional characteristics of Korean children aged 1–4 years (n = 3,661)
Statistically significant differences were noted in nutrient intake during the survey period. These differences were marked in total energy derived from protein (P < 0.01), carbohydrate (P < 0.001), and fat (P < 0.001), as well as in the intake of protein (P < 0.01), fat (P < 0.001), calcium (P < 0.05), phosphorus (P < 0.01), iron (P < 0.001), vitamin A (P < 0.001), thiamin (P < 0.001), riboflavin (P < 0.001), niacin (P < 0.05), and vitamin C (P < 0.01). Increasing trends were noted in the intake of total energy (P < 0.05), total energy derived from fat (P < 0.001), protein (P < 0.05), and fat (P < 0.001) during the survey period. Conversely, the total energy derived from carbohydrates (P < 0.001) and most micronutrients showed declining trends over time, especially phosphorus (P < 0.001), iron (P < 0.001), vitamin A (P < 0.001), thiamine (P < 0.001), niacin (P < 0.001), and vitamin C (P < 0.001).
3. Dietary assessment
Table 4 shows notable variations in the prevalence of nutritional inadequacy for carbohydrate (P < 0.05), calcium (P < 0.05), iron (P < 0.001), vitamin A (P < 0.001), thiamin (P < 0.001), riboflavin (P < 0.01), niacin (P < 0.001), and vitamin C (P < 0.001). The prevalence of carbohydrate inadequacy decreased, whereas inadequacy in iron (P < 0.001), vitamin A (P < 0.001), thiamin (P < 0.01), niacin (P < 0.001), and vitamin C (P < 0.01) increased. The average number of micronutrients consumed below the EAR was 2.17. Among Korean children aged 1–4 years, the prevalence of micronutrient inadequacy based on EAR showed a statistically significant increasing trend over the survey periods (P < 0.001 for differences, P-trend = 0.006).

Trends in inadequate nutrient intakes based on EAR among Korean children aged 1–4 years (n = 3,661)
Trends in total energy and fat intake among Korean children aged 1–4 years were examined (Table 5). The proportion of children consuming less than the estimated energy requirement remained relatively stable over the survey period, ranging 46.1%–49.0%. However, the proportion of children consuming fat below the acceptable macronutrient distribution range (AMDR) decreased significantly from 27.1% in the 5th survey to 14.3% in the 8th survey (P < 0.001). Conversely, the proportion of children with excessive fat intake (above the AMDR) increased significantly from 11.2% in the 5th survey to 18.2% in the 8th survey (P < 0.01).

Trends in energy and fat intake relative to EER and AMDR among Korean children aged 1–4 years (n = 3,661)
4. Growth assessment
Table 6 presents the distribution of growth status among Korean children, classified by WHO z-scores throughout the survey periods. The overall average HAZ score was approximately zero (–0.01), indicating normal height-for-age growth with slight improvements in subsequent survey periods. The WAZ remained constant with minimal fluctuations, showing higher scores in the initial and final surveys. The WHZ and BAZ showed decreasing trends over time, suggesting a decline in the prevalence of overweight. This analysis underscores the generally stable growth patterns with notable reductions in overweight-related metrics (i.e., WHZ and BAZ) over time (P < 0.01).

Among the 3,661 children included in the studies, over 90% were categorized as having “Normal” growth, representing the majority of the study participants. The prevalence of wasting (WHZ < –2) ranged 0.35%–0.44%. Over time, the proportion of children with normal growth status increased, reaching its peak in the 7th survey at 94.9%. The prevalence of overweight children (WHZ > 2) exhibited a significant decreasing trend (P < 0.001), peaking at 9.1% in the 5th survey, then declining to 5.2% in the 6th survey and 4.7% in the 7th survey, before slightly increasing to 5.1% in the 8th survey.
Children with not-stunted growth status (HAZ ≥ –2) were much more frequent than those with stunted conditions, with the prevalence of stunting (HAZ < –2) decreasing from 2010 to 2021 (P < 0.001). The estimated prevalence of stunting was 1.3%, marginally higher than other undernutrition categories, which all registered below 1%: underweight (WAZ < –2) at 0.17%, and wasting (BAZ < –2) at 0.40%. Overweight children ranged 3.9%–7.0% in the overall growth analysis.
The distribution of BAZ among Korean children indicated that the proportion classified as normal condition steadily increased from the 5th survey (89.0%) to the 7th survey (94.4%), but slightly declined in the 8th survey (93.6%). The prevalence of overweight children based on the BAZ (P < 0.001) showed a decreasing trend, with a peak of 10.8% in the 5th survey, declining to 6.2% in the 6th and 5.2% in the 7th surveys, and a slight increase to 5.8% in the 8th survey.
DISCUSSION
This study utilizes the WHO child growth z-score classification and nutrient intake data to provide a comprehensive overview of growth and nutrient intake trends among Korean toddlers and preschoolers. A total of 3,661 participants aged 1–4 years were included. Most Korean children generally exhibited normal growth, with an increasing trend observed over the survey period, accompanied by a decline in the prevalence of overweight children. An increasing trend was also noted in total energy intake, energy derived from fat, and consumption of macronutrients, particularly protein and fat. Anthropometric data collected during the survey period indicated significant trends in the physical growth of the population. However, a decreasing trend in the intake of several micronutrients, along with changes in macronutrient trends, suggests a potential shift in dietary patterns among Korean children.
While both height and weight showed significant increases, the decline in BMI suggests that energy and protein intake primarily supported linear growth (height) rather than contributing to overweight prevalence. This finding aligns with that of Puentes et al. [18], who found that an increase in energy intake, especially from protein sources, was a critical factor in promoting linear growth and weight gain among children aged 6–24 months in Guatemala and the Philippines, where chronic undernutrition is prevalent. Although Korean children generally do not experience chronic undernutrition, the observed trends in their height growth suggest that protein consumption plays a significant role in promoting linear growth and mitigating the prevalence of overweight in the context of relatively adequate nutrition. A systematic review of social protection programs indicated that while income transfers could positively impact height-for-age, the effect was minor and not statistically significant unless protein intake increased significantly [19]. This finding supports the idea that higher protein intake could promote increased height in children, as observed in this study. Proteins and amino acids are crucial for linear growth, facilitating tissue development, and supporting metabolic demand. Proteins enhance the production of hormones, such as insulin and insulin-like growth factor (IGF)-I, which promote skeletal growth through endochondral ossification. Amino acids also play a vital role in the normal growth and formation of the extracellular matrix by chondrocytes, which is essential for skeletal tissue formation [20, 21]. Fat is an important energy source for normal growth, brain development, and the absorption of fat-soluble vitamins, while also influencing growth-related hormones, such as growth hormone and IGF-1 [20, 22].
This study identified several issues related to micronutrient intake among Korean toddlers and preschoolers. The number of inadequate micronutrients increased significantly during the study period. These data highlight the trend of declining micronutrient intake adequacy, particularly for iron, vitamin A, thiamine, niacin, and calcium. These findings indicate the need for targeted nutritional interventions and education to improve dietary patterns and address the increasing risk of micronutrient deficiency in Korean toddlers and preschoolers. Concurrently, the increased intake of protein and energy from fat (P < 0.001) suggests dietary shifts that may compromise the consumption of micronutrient-rich food sources. As children age, their calcium consumption increases because calcium is vital for bone development, especially during growth periods [23]. However, the declining trend in calcium intake with age appears to be linked to children's transition from a diet primarily centered on milk or formula to a more diverse diet, potentially reducing calcium-rich food sources [11].
The proportion of participants with inadequate intake of iron, vitamin A, thiamine, niacin, and vitamin C demonstrated an increasing trend. Globally, the prevalence of iron deficiency in children aged < 15 years rose by 5.52% between 1990 and 2019 [24]. Stevens et al. [5] observed that the prevalence of iron deficiency in Korean preschool children aged 6–59 months (32.1%) exceeded that in children in the UK (31%), Nepal (27%), and Mexico (18%). This study also noted deficiencies in micronutrients, such as vitamins A and C, which can impede iron absorption. Anemia, a frequent clinical outcome of iron deficiency, impairs children’s cognitive development, delays motor development, and reduces their physical functioning and quality of life [25].
In accordance with the 2018 WHO-UNICEF classification and its predefined prevalence threshold [26], the incidence of wasting in Korea is considered very low, with a threshold of < 2.5% and an observed rate of 0.2%. In this study, 0.4% of the participants were classified as having wasting conditions (WHZ < –2). Children with overweight status (WHZ > 2) accounted for 5.1% of the participants and were categorized as medium according to the prevalence threshold. Interestingly, this prevalence was slightly lower than the model estimate of 5.4% reported in the 2023 Joint Child Malnutrition Estimates (JME) [2]. The prevalence of stunting (HAZ < –2) in this study was 0.3%, which was lower than the 1.7% model estimate reported by the JME in 2023 [2].
The prevalence of wasting among Korean children aged < 5 years has remained low, ranging from 0.3% in 2010–2013 to 0.4% in 2017–2018, significantly lower than that in other Asian countries. In 2022, wasting prevalence was 5.0% in Japan, 2.3% in China (2013), 4.3% in Iran (2017), and 14.3% in Bangladesh (2014) [2, 27-29]. Korean children’s growth, measured by BAZ scores, showed changes over the survey periods. The proportion of children with normal growth increased from the 5th to the 7th survey but slightly decreased in the 8th survey, while the overweight prevalence decreased overall but rose to 5.8% in the 8th survey. In contrast, overweight rates among children have significantly risen in other countries [30, 31]: Indonesia (6.2%–16.5% between 2003–2007), Germany (2.2%–3.0% between 2013–2018), Belgium (9.0%–12.9% between 1999–2006), Cyprus (14.1%–19.9% between 1999–2016), and Italy (25.4%–37.3% between 1999–2010). However, despite these trends, its prevalence in Korea remains relatively low.
The prevalence of overweight children declined from the 5th to the 7th survey but exhibited a slight increase in the 8th survey, likely attributable to the coronavirus disease 2019 pandemic during 2019–2021. Similar trends were observed in Austrian children under 14.4 years, with the prevalence of overweight rising from 16.7% to 20.7%. The pandemic has had significant health, social, and economic impacts, including increases in sedentary lifestyles and calorie consumption. Lockdowns, the prohibition of team sports, and restrictions on physical activity have contributed to a rise in overweight [32]. The prevalence of overweight among children aged < 5 years in Korea is relatively lower than that in other countries, such as Egypt, where the prevalence is 17% [33].
While the increasing trend of children with normal growth status across survey periods in Korea indicates a generally stable baseline in terms of health and nutrition, disparities influenced by socioeconomic factors, community well-being, healthcare effectiveness, and environmental conditions remain [34]. Studies have consistently shown that higher socioeconomic status (SES) is associated with better nutritional outcomes, such as increased consumption of healthy foods and adherence to dietary recommendations. Conversely, lower SES restricts food choices and elevates the risk of nutritional inadequacy [35, 36]. For instance, a Finnish study found higher fruit consumption among children from families with higher SES [36], while research from Indonesia, Australia, and Canada demonstrated a strong correlation between household income and the prevalence of childhood overweight [37-39]. In South Korea, children from low-income families tend to be overweight and deficient in micronutrients, whereas those from higher-income families generally have lower BMI and exhibit better adherence to dietary guidelines [10, 40]. These findings underscore the critical need for in-depth research to tackle health inequities driven by socioeconomic disparities and to develop targeted interventions for vulnerable populations.
Limitations
This study encountered several limitations. Firstly, the dietary data were collected using the 24-hour recall method, which might not accurately reflect the participants’ usual intake. Additionally, since dietary information was obtained from primary caregivers, it might not fully encompass meals consumed outside the home, such as in kindergartens or daycare centers. Consequently, the data may not fully represent children’s total food intake. Moreover, in Korea, nutrient intake standards are revised every 5 years. Although this study analyzed data spanning a 12-year period to observe trends in nutrient consumption and growth, the findings were compared only with the latest KDRIs. This approach was adopted to avoid inconsistencies in the trend analysis due to variations in the survey years not explicitly addressed. However, an exception was made for vitamin A, for which dietary assessment was based on both the 2010 and 2020 KDRIs, necessitated by the update of the standard unit for vitamin A in 2015. Despite these limitations, this research is of significant importance as it utilizes nationally representative data and explores long-term trends in growth and nutritional intake among the Korean population.
Conclusion
This study underscores the necessity of ongoing monitoring and analysis of dietary patterns and growth trends in Korean children to tackle evolving dietary habits and lifestyle modifications. Although most Korean children exhibit normal growth, shifts in dietary patterns, such as increased energy intake from fat and reduced micronutrient consumption, are concerning. Future research should concentrate on detailed examinations of dietary patterns, including specific food groups and their association with SES, to pinpoint the factors that influence optimal nutrition in Korean children. Additionally, exploring the impact of micronutrient intake on growth patterns and related food behaviors can yield valuable insights. These initiatives are vital for crafting targeted interventions and policies that foster optimal nutrition and healthy growth in all children, thereby reducing disparities and combating malnutrition.
Notes
CONFLICT OF INTEREST
There are no financial or other issues that might lead to conflict of interest.
FUNDING
This research was supported by the Daejeon University Research Grants (funding number: 20240187).
DATA AVAILABILITY
The data that support the finding of this study are openly available and can be accessed at https://knhanes.kdca.go.kr/.
ACKNOWLEDGMENTS
The data that presented in this paper were previously utilized in the author’s Master thesis titled “Association between child growth pattern and nutritional well-being in South Korean young children: using 5th, 6th, 7th, 8th KNHANES data” submitted to Daejeon University in partial fulfillment of the requirements for the degree of Master of Science.