Warning: mkdir(): Permission denied in /home/virtual/lib/view_data.php on line 81

Warning: fopen(upload/ip_log/ip_log_2024-11.txt): failed to open stream: No such file or directory in /home/virtual/lib/view_data.php on line 83

Warning: fwrite() expects parameter 1 to be resource, boolean given in /home/virtual/lib/view_data.php on line 84
Lifestyle, Dietary Behavior and Snack Preference of Upper-grade Elementary School Students in Cheongju according to the Usage Time of Smartphones

Lifestyle, Dietary Behavior and Snack Preference of Upper-grade Elementary School Students in Cheongju according to the Usage Time of Smartphones

Article information

Korean J Community Nutr. 2017;22(1):40-52
Publication date (electronic) : 2017 February 28
doi : https://doi.org/10.5720/kjcn.2017.22.1.40
Department of Food and Nutrition, Chungbuk National University, Cheongju, Korea.
Corresponding author: Munkyong Pae. Department of Food and Nutrition, Chungbuk National University, 1 Chungdae-ro, Seowon-gu, Cheongju, 28644, Korea. Tel: (043) 261-2745, Fax: (043) 267-2742, mpae@chungbuk.ac.kr
Received 2017 February 06; Revised 2017 February 21; Accepted 2017 February 22.

Abstract

Objectives

This study was conducted to examine the length of exposure to smartphone and its association with dietary behavior toward snacks, lifestyle, and nutrition knowledge in elementary school students.

Methods

Subjects were 372 5th and 6th grade schoolchildren in Cheongju, Korea, and data was collected by a self-administered questionnaire. They were divided into two groups by the time spent using smartphone: moderate (< 2 hours/day) and overexposure (≥ 2 hours/day). Data was analyzed using frequency analysis, χ2-test, and independent t-test as well as analysis of covariance when necessary.

Results

Approximately half of subjects (41.4%) reported spending ≥ 2 hours/day using smartphone. That habit was more frequent among students in the 6th grade, those who received more monthly allowance, and who has a working mother. 63.4% of the subjects reported that they consumed snacks while watching television, using a computer and/or a smartphone and 48.1% said that they consumed snacks while they use a smartphone. Both situations were most prevalent among those with overexposure to smartphone (≥ 2 hours/day). We also observed that a higher percentage of subjects from the overexposure group spent more money on snack foods with the preference for ice cream, fast food, and carbonated drinks. Further, those in the overexposure group consumed more ice cream, cookies, and carbonated drinks. In addition, they had less desirable dietary behavior and health-related lifestyle (sleep duration and frequency of regular exercise) compared to those with moderate smartphone usage (< 2 hours/day). However, there was no statistical difference in nutrition knowledge among children with different degrees of smartphone usage.

Conclusions

Our results showed that longer smartphone use was associated with less desirable snack preference/consumption and other dietary behavior in elementary school students. Thus interest and positive attitudes towards healthy snacks and diet should be reinforced in nutrition education programs, especially for those who are prone to use smartphones.

Acknowledgments

This work was supported by the intramural research grant of Chungbuk National University in 2015

References

1. Ministry of Health & Welfare. Korea Centers for Disease Control and Prevention. Korea National Health and Nutrition Examination Survey (KNHANES VI-3) Korea Centers for Disease Control and Prevention; 2016. 12. Report No. 11-1351159-000027-10.
2. Paik JJ, Lee HS. Dietary behaviors, food preferences and its relationships with personality traits in sixth grader's of elementary school. Korean J Community Nutr 2004;9(2):135–141.
3. Lee SS. A study on dietary behavior of children according to the their preferences for fast food. Korean J Community Nutr 2004;9(2):204–213.
4. Jeong NY, Kim KW. Nutrition knowledge and eating behaviors of elementary school children in Seoul. Korean J Community Nutr 2009;14(1):55–66.
5. Kang SA, Lee JW, Kim KE, Koo JO, Park DY. A study of the frequency of food purchase for snacking and its related ecological factors on elementary school children. Korean J Community Nutr 2004;9(4):453–463.
6. Her ES. Interrelations among snack preference, purchasing behaviors and intake in upper grade elementary school students: compared by the gender and TV watching time. Korean J Community Nutr 2013;18(5):429–441.
7. Temple JL, Giacomelli AM, Kent KM, Roemmich JN, Epstein LH. Television watching increases motivated responding for food and energy intake in children. Am J Clin Nutr 2007;85(2):355–361.
8. Jo AR, Khil JM. Relationship of TV watching, internet usage and dietary habits of elementary in Gwangju and Jeonnam area. Korean J Food Cult 2010;25(2):160–169.
9. Kang YR, Kim AJ. A study on the change in dietary patterns of some elementary school children in Seoul: concerning the frequent use of computers. J East Asian Soc Diet Life 2003;13(4):284–292.
10. Kim HS, Lee BH. Influence of computer use hours on physical development, dietary patterns, and nutritional status of higher grade elementary school children. Korean J Nutr 2008;41(2):165–173.
11. Ahn SH, Lee EJ, Jeong KW. An analysis relationship between computer using habit and sleeping and eating habits in case of children. J Korean Assoc Comput Educ 2013;16(6):103–109.
12. Korea Information Society Development Institute. Korea media panel survey statistic report [Internet] 2016. cited 2017 Jan 4. Available from: http://www.kisdi.re.kr/kisdi/fp/kr/publication/selectResearch.do?cmd=fpSelectResearch&sMenuType=2&controlNoSer=43&controlNo=13996&langdiv=1.
13. Lee YS, Kim LS, Cho EH, Lee HS. A study on adolescents' perceptions of smart phone uses: with a focus on the FGI of middle and high school users. Korean J Youth Couns 2013;21(1):43–66.
14. Lee NN. A research on the impact of eating behavior and food intake according to the gender and smartphone addiction [master's thesis] Kyunghee University; 2014.
15. Kim EJ, Kim SY. Correlation between smartphone addiction and eating behaviors of elementary school students in Ansan area. J Korean Soc Food Sci Nutr 2015;44(7):1007–1015.
16. Cho EA, Lee SK, Heo GJ. Snack consumption behaviors and nutrition knowledge among elementary school students in Siheung-si. Korean J Community Nutr 2010;15(2):169–179.
17. Kim MH, Bae YJ, Lee HJ, Choi MK. The evaluation of nutritional knowledge and dietary habits according to sex and mother's employment status in middle school students. J East Asian Soc Diet Life 2009;19(6):921–927.
18. National Information Society Agency. Development of measuring of smartphone addiction [Internet] 2011. cited 2016 Apr 14. Available from: http://www.iapc.or.kr/dia/survey/addDiaSurveyNew.do?dia_type_cd=PAYS.
19. Korea Center for Disease Control and Prevention. 2007 Korean children and adolescents growth chart [Internet] 2008. cited 2017 Jan 3. Available from: http://www.cdc.go.kr/CDC/notice/CdcKrInfo0201.jsp?menuIds=HOME001-MNU1154-MNU0005-MNU1889&cid=1235.
20. Yon MY, Han YH, Hyun TS. Dietary habits, food frequency and dietary attitudes by gender and nutrition knowledge level in upper: grade school children. Korean J Community Nutr 2008;13(3):307–322.
21. Park HY. Research on the practice of snack intake and eating habits of elementary school students in Daegu-Gyeongbuk [master's thesis] Kyungpook National University; 2014.
22. Park OH, Lee KA. The comparisons of elementary school children's food purchasing and consumer competency for a healthier diet by their attitude toward the meal management. Korean J Nutr 2008;41(4):353–364.
23. Korean Statistical Information Service. 2014 Report on the time use survey [Internet] 2016. cited 2017 Jan 16. Available from: http://kosis.kr/ups/ups_01List.jsp.
24. Im KH. The effects of children's TV watching to materialism: focused on TV programs and advertisements [master's thesis] Daegu University; 2010.
25. Nam JH, Lee MY. The study of food habits according to obesity index in elementary school children in Yangju city, Kyeong-gi province. Korean J Food Nutr 2006;19(2):153–160.
26. Kim KH. Food habits, eating behaviors and food frequency by gender and among Seoul and other regions in upper-grade elementary school children. Korean J Community Nutr 2010;15(2):180–190.
27. Lee KW, Lee HS, Lee MJ. A study on the eating behaviors of self-purchasing snack among elementary school students. Korean J Food Cult 2005;20(5):594–602.
28. Beak YM, Jung SJ, Beak HI, Cha YS. A study on eating out and snack intake of elementary school students living in Jeonbuk province. Korean J Hum Ecol 2007;10(2):77–87.
29. Kim MH, Sung JE, Yeon JY. A study on the dietary habits and nutritional knowledge of high-grade students in elementary school. J East Asian Soc Diet Life 2014;24(5):552–563.

Article information Continued

Funded by : Chungbuk National Universityhttp://dx.doi.org/10.13039/501100002461

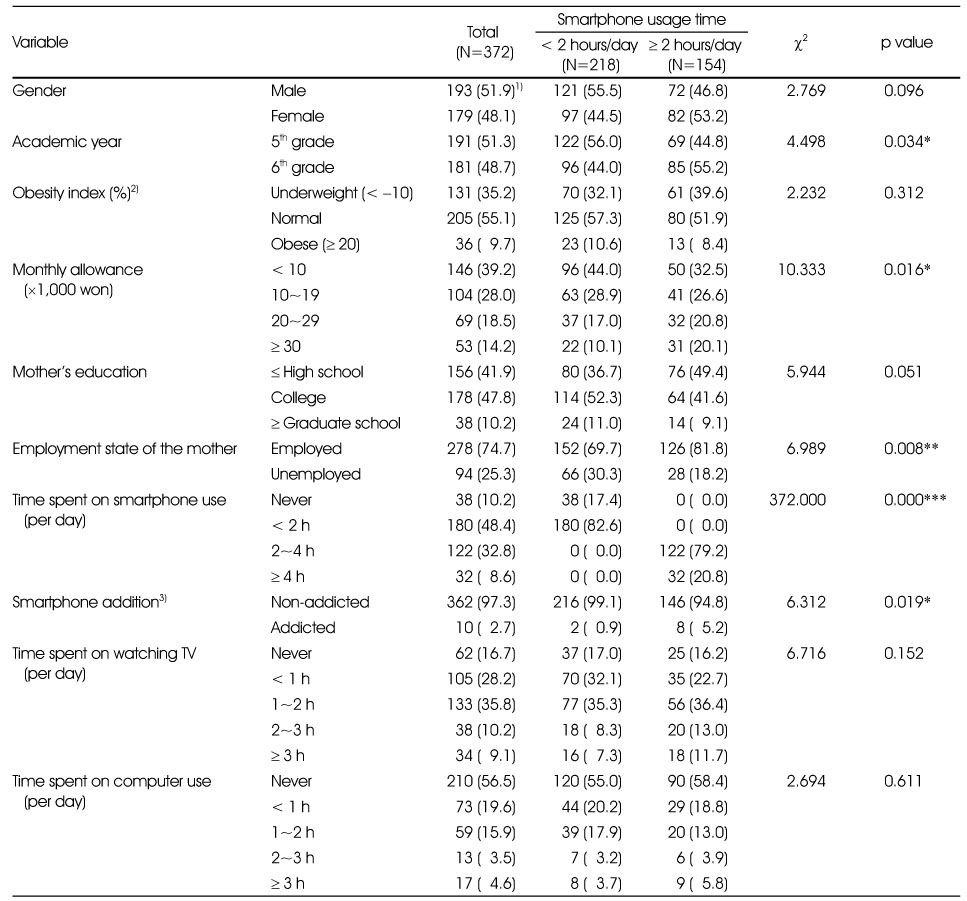
Table 1

General characteristics of the study subjects by smartphone usage time

Table 1

1) N (%)

2) Obesity index = (body weight – standard body weight) / standard body weight × 100

3) Non-addicted (S-scale score ≤ 41 pt), Addicted (S-scale score ≥ 42 pt)

*: p < 0.05, **: p < 0.01, ***: p < 0.001

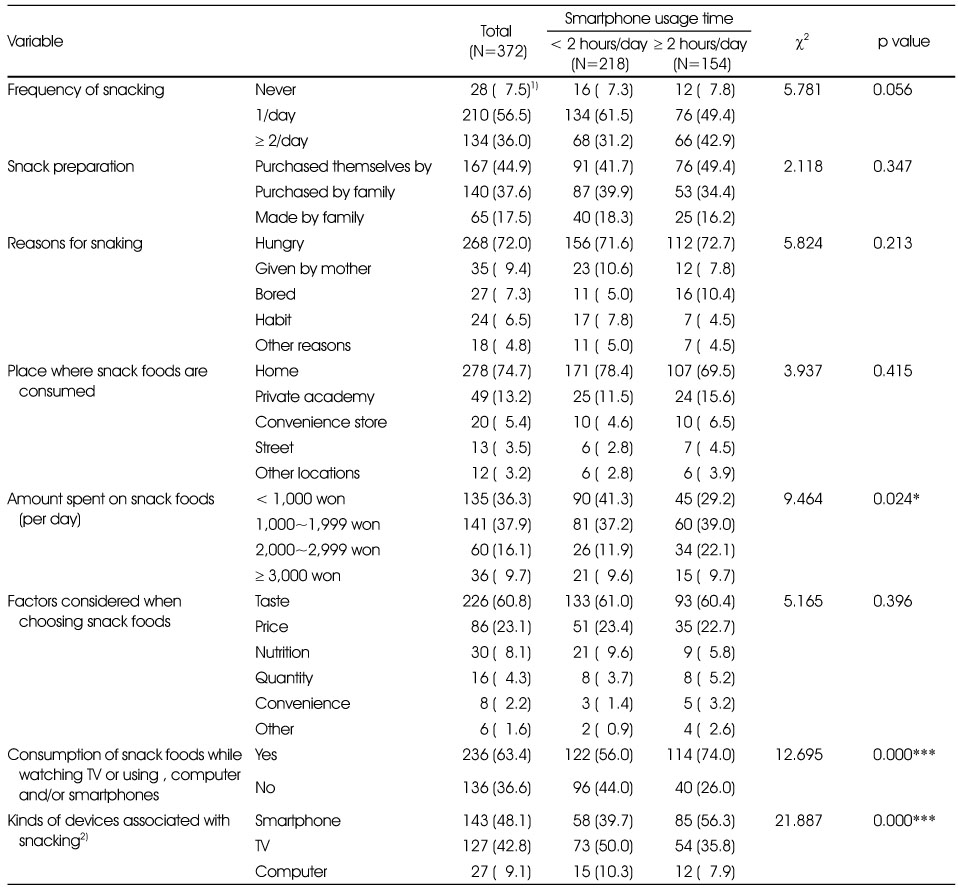
Table 2

Snacking behaviors of the study subjects by smartphone usage time

Table 2

1) N (%)

2) N = 297: Multiple responses among subjects who answered yes for consuming snack foods during TV watching, computer and/or smartphone use

*: p < 0.05, ***: p < 0.001

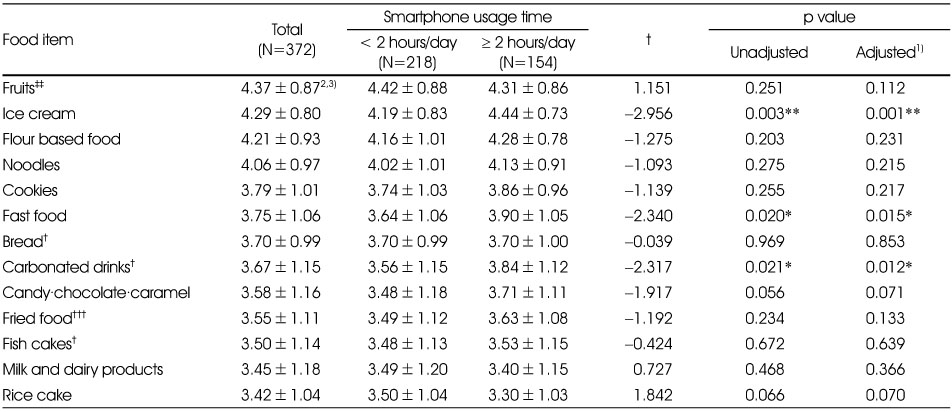
Table 3

Snack preferences by the smartphone usage time of the study subjects

Table 3

1) Adjusted by gender and grade

2) Mean±SD

3) 5-point Likert scale was used from 1 (strongly dislike) to 5 (strongly like)

‡‡: p < 0.01 (Grade difference)

†: p < 0.05, †††: p < 0.001 (Gender difference)

*: p < 0.05, **: p < 0.01

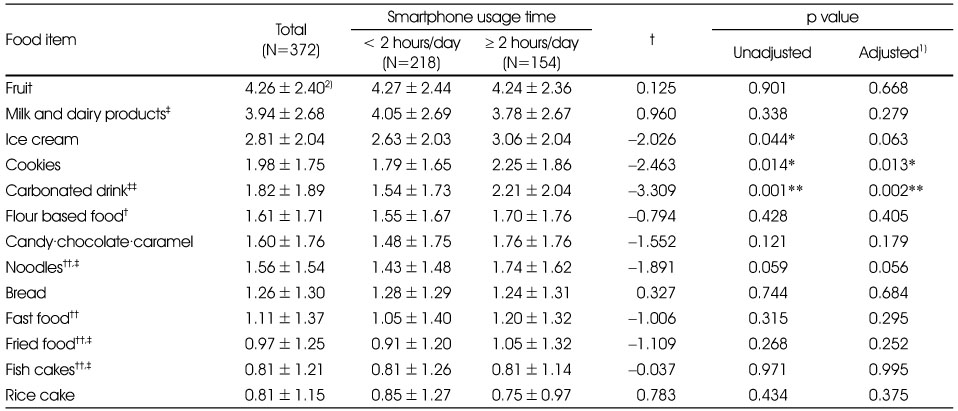
Table 4

Intake frequency of snack foods by the smartphone usage time of the study subjects

Table 4

1) Adjusted by gender and grade

2) Mean±SD: eating frequency per a week

‡: p < 0.05, ‡‡: p < 0.01 (Grade difference)

†: p < 0.05, ††: p < 0.01 (Gender difference)

*: p < 0.05, **: p < 0.01

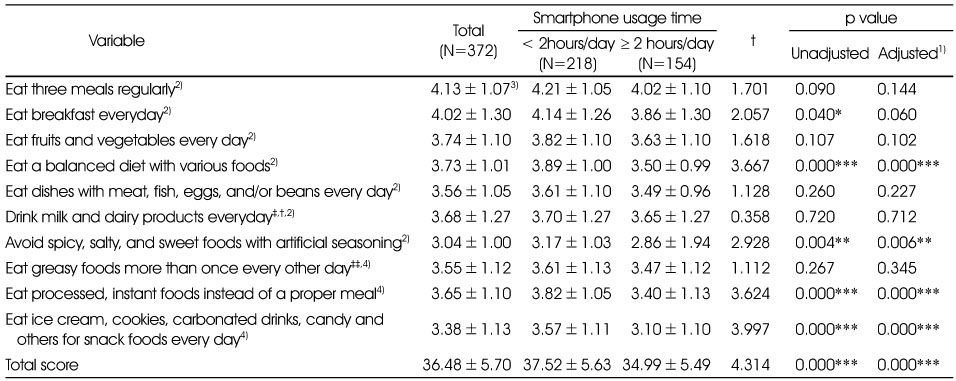
Table 5

Dietary behavior of the study subjects by smartphone usage time

Table 5

1) Adjusted by gender and grade

2) 5-point Likert scale was used from 1 (strongly disagree) to 5 (strongly agree)

3) Mean±SD

4) 5-point Likert scale was used from 1 (strongly agree) to 5 (strongly disagree)

‡: p < 0.05, ‡‡: p < 0.01 (Grade difference)

†: p < 0.05, ††: p < 0.01 (Gender difference)

*: p < 0.05, **: p < 0.01, ***: p < 0.001

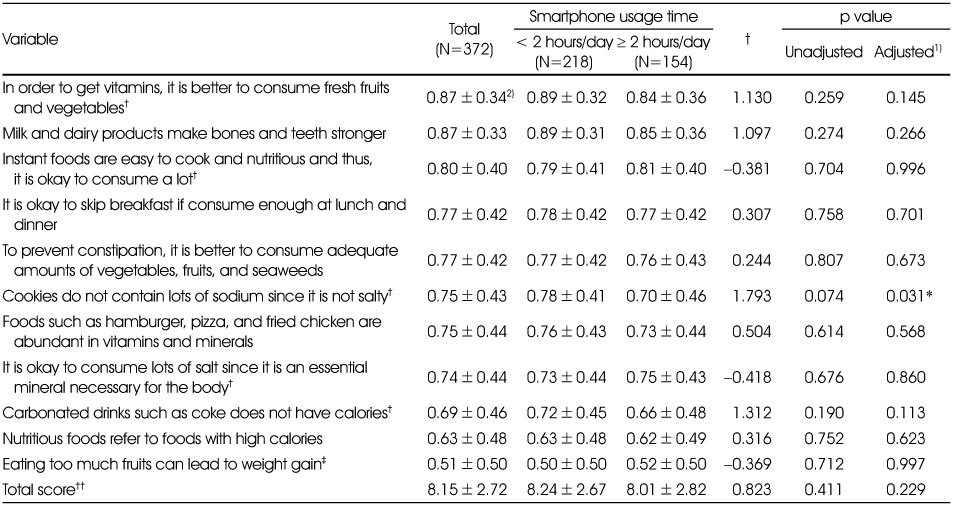
Table 6

Nutrition knowledge of the study subjects by smartphone usage time

Table 6

1) Adjusted by gender and grade

2) Score 1 for correct answer, score 0 for wrong answer or I don't know, Mean±SD

‡: p < 0.05 (Grade difference)

†: p < 0.05, ††: p < 0.01 (Gender difference)

*: p < 0.05

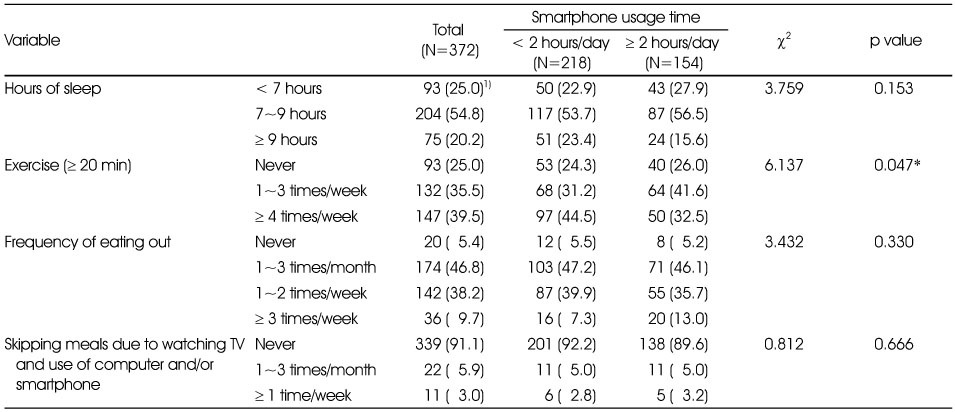
Table 7

Dietary habits and lifestyle of the study subjects by smartphone usage time

Table 7

1) N (%)

*: p < 0.05