
Articles
- Page Path
- HOME > Korean J Community Nutr > Volume 19(6); 2014 > Article
-
Research Article
- The Effects of Low-sodium Diet Education Program on Dietary Habits, Diet Quality and Obesity Index in Overweight and Obese Middle-aged Women
- Soo Bin Jeong, Seoyun Park, Sohyun Ahn, Jin Nam Kim, Hye-Kyeong Kim
-
Korean Journal of Community Nutrition 2014;19(6):513-526.
DOI: https://doi.org/10.5720/kjcn.2014.19.6.513
Published online: December 31, 2014
Department of Food Science & Nutrition, The Catholic University of Korea, Bucheon, Korea.
- Corresponding author: Hye-Kyeong Kim. Department of Food Science & Nutrition, The Catholic University of Korea, Jibongro 43, Wonmi-gu, Bucheon, Gyeonggi-do 420-743, Korea. Tel: (02) 2164-4314, Fax: (02) 2164-4314, hkyeong@catholic.ac.kr
• Received: October 27, 2014 • Revised: December 15, 2014 • Accepted: December 23, 2014
Copyright © 2014 The Korean Society of Community Nutrition
This is an Open-Access article distributed under the terms of the Creative Commons Attribution Non-Commercial License (http://creativecommons.org/licenses/by-nc/3.0/) which permits unrestricted non-commercial use, distribution, and reproduction in any medium, provided the original work is properly cited.
- 5 Views
- 0 Download
Abstract
-
Objectives
- This study was conducted to investigate the effect of low sodium diet education program on dietary habits, diet quality, and measures of obesity in overweight or obese middle-aged women.
-
Methods
- Subjects were 81 individuals aged 45 years or over, who completed an 8-week nutrition education. The subjects were divided into a normal group (N = 30) and an overweight-obese group (N = 51) according to the BMI. The effects were evaluated by anthropometric measurement, biochemical analysis, questionnaire, and diet records before and after the program.
-
Results
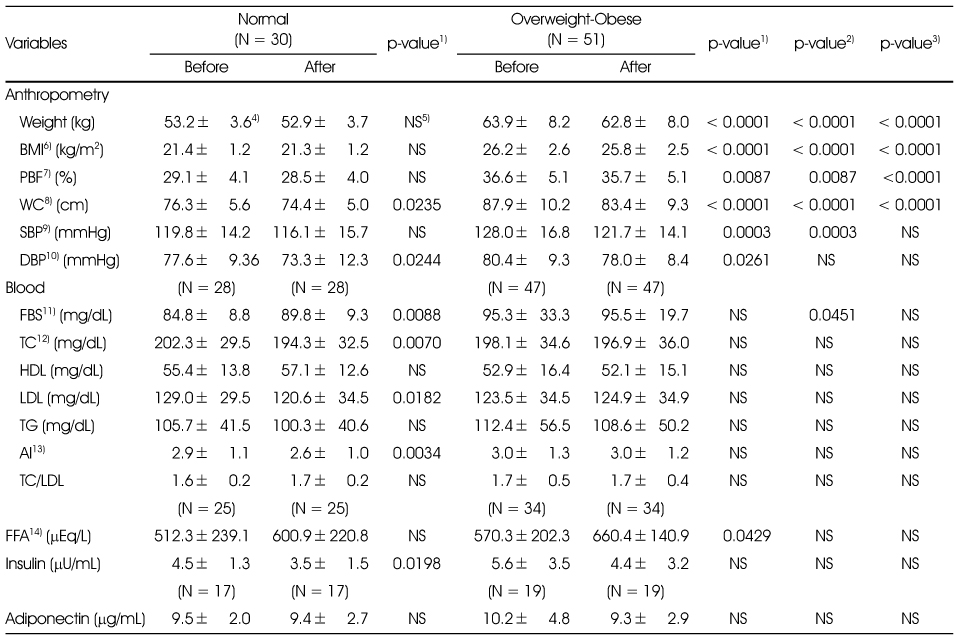
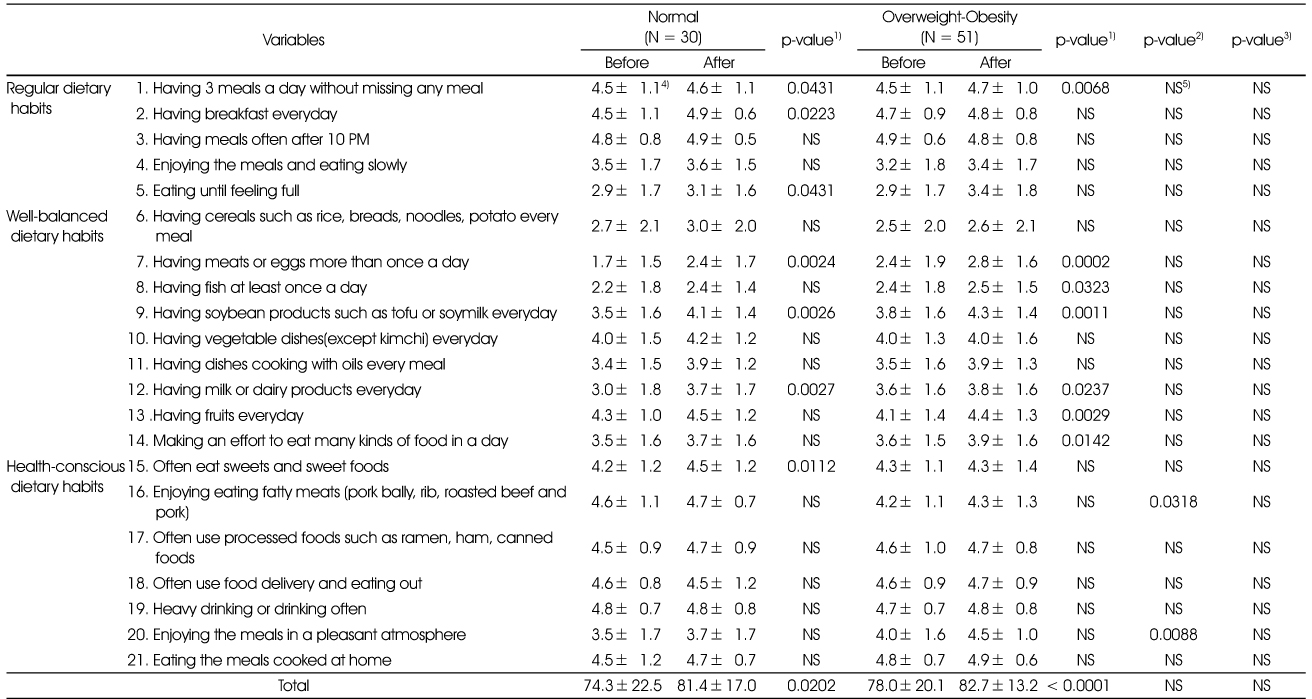
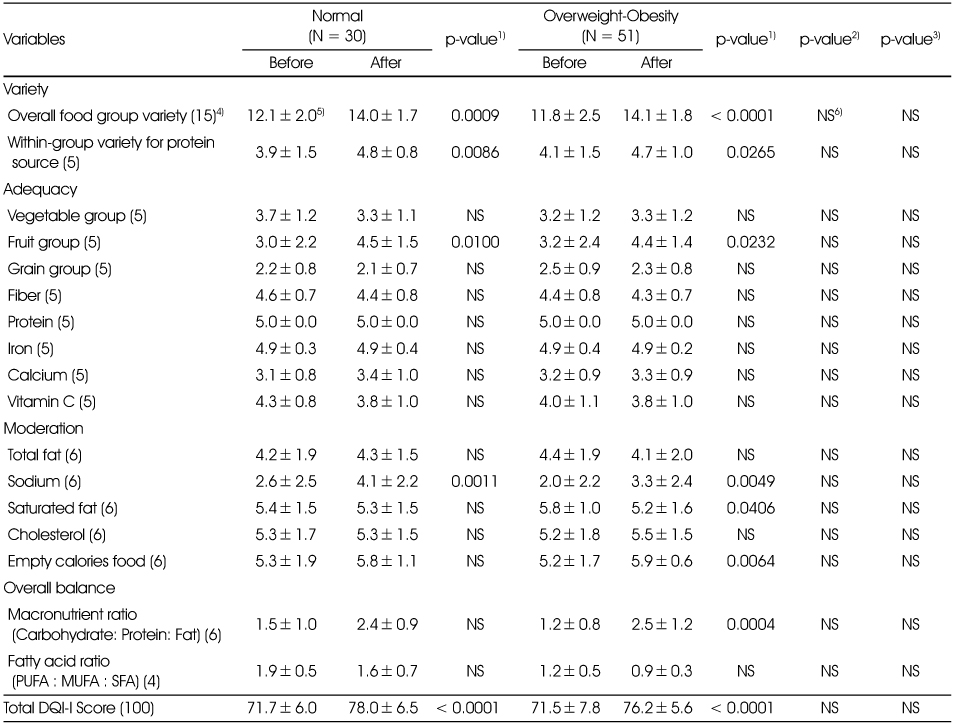
- Overweight-obese group showed significant decreases in weight (p < 0.0001), BMI (p < 0.0001), percent of body fat (p = 0.0087), waist circumference (p < 0.0001), systolic (p = 0.0003) and diastolic blood pressure (p = 0.0261). Nutrients intakes were not different between the two groups and only sodium intake was decreased after education. Total score of general dietary habits, dietary behavior related to sodium intake, dietary diversity score (DDS), diet variety score (DVS), and diet quality index-international (DQI-I) were improved in both groups compared to the baseline. Overweight-obese group showed significant improvement in 'having fruits everyday', 'having fish everyday', 'trying to eat many kinds of food', 'eating less broth when eating soup, stew, and noodles', 'eating less kimchi and salt-fermented vegetable', and 'propensity to think that dishes should be pretty seasoned'. In addition, moderation of empty calories food (p = 0.0064) and macronutrient ratio (p = 0.0004) were improved in the overweigh-obese group, but in the normal group, the results did not reach statistical significance.
-
Conclusions
- These results suggested that low sodium diet education program may contribute to obesity management by improving diet quality and dietary habits in middle-aged women.
- 1. Balliett M, Burke JR. Changes in anthropometric measurements, body composition, blood pressure, lipid profile, and testosterone in patients participating in a low-energy dietary intervention. J Chiropr Med 2013; 12(1): 3-14.
- 2. Choi HM, Kim JH, Lee JH, Kim CI, Song KH, Chang KJ. Nutrition in the 21st century. 3nd ed. Seoul: Kyomunsa; 2011. p. 9.
- 3. Choi Y, Kim C, Park YS. The effect of nutrition education program in physical health, nutritional status and health-related quality of life of the elderly in Seoul. J Nutr Health 2007; 40(3): 270-280.
- 4. Damms-Machado A, Weser G, Bischoff SC. Micronutrient deficiency in obese subjects undergoing low calorie diet. Nutr J 2012; 11(1): 34.
- 5. Ellison RC, Sosenko JM, Harper GP, Gibbons L, Pratter FE, Miettinen OS. Obesity, sodium intake, and blood pressure in adolescents. Hypertension 1980; 2(4 Pt2): 78-82.
- 6. Grimes CA, Riddell LJ, Campbell KJ, Nowson CA. Dietary salt intake, sugar-sweetened beverage consumption, and obesity risk. Pediatrics 2013; 131(1): 14-21.
- 7. He FJ, MacGregor GA. A comprehensive review on salt and health and current experience of worldwide salt reduction programmes. J Hum Hypertens 2009; 23(6): 363-384.
- 8. He J, Ogden LG, Vupputuri S, Bazzano LA, Loria C, Whelton PK. Dietary sodium intake and subsequent risk of cardiovascular disease in overweight adults. JAMA 1999; 282(21): 2027-2034.
- 9. Heller M. The DASH diet weight loss solution: 2 weeks to drop pounds, boost metabolism, and get healthy, Grand central Life & style. New York: 2012. p. 1-18.
- 10. Imayama I, Ulrich CM, Alfano CM, Wang C, Xiao L, Wener MH, Campbell KL, Duggan C, Foster-Schubert KE, Kong A, Mason CE, Wang CY, Blackburn GL, Bain CE, Thompson HJ, Mc Tiernan A. Effects of a caloric restriction weight loss diet and exercise on inflammatory biomarkers in overweight/obese postmenopausal women: a randomized controlled trial. Cancer Res 2012; 72(9): 2314-2326.
- 11. Jang JY, Kim MJ, Han JS. A study on food frequency, dietary habits and nutrition knowledge of the elderly who intake high sodium. J Korean Soc Food Sci Nutr 2009; 38(10): 1362-1372.
- 12. Jung EJ, Son SM, Kwon JS. The effect of sodium reduction education program of a public health center on the blood pressure, blood biochemical profile and sodium intake of hypertensive adults. Korean J Community Nutr 2012; 17(6): 752-771.
- 13. Kant AK, Block G, Schazkin A, Ziegler RG, Nestle M. Dietary diversity in the US population, NHANES I. J Am Diet Assoc 1987; 87(7): 897-903.
- 14. Kim MH, Bae YJ. Evaluation of diet quality of children and adolescents based on nutrient and food group intake and deit quality index-international (DQI-I). Korean J Community Nutr 2010; 15(1): 1-14.
- 15. Kim S, Haines PS, Siega-Riz AM, Popkin BM. The diet quality index-international (DQI-I) provides an effective tool for cross-national comparison of diet quality as illustrated by China and the United States. J Nutr 2003; 133(11): 3476-3484.
- 16. Korean Society for the Study of Obesity. Obesity treatment guideline. 2012; cited December 10, 2014]. Available from http://www.kosso.or.kr/general.
- 17. Krebs-Smith SM, Smiciklas-Wright H, Guthrie HA, Krebs-Smith J. The effects of variety in food choices on dietary quality. J Am Diet Assoc 1987; 87(7): 897-903.
- 18. Kuh DL, Wadsworth M, Hardy R. Women's health in midlife: the influence of the menopause, social factors and health in earlier life. Br J Obstet Gynaecol 1997; 104(8): 923-933.
- 19. Lee YA, Kim KN, Chang NS. The effect of nutrition education on weight control and diet quality in middle-aged women. Korean J Nutr 2008; 41(1): 54-64.
- 20. Ma Y, Bertone ER, Stanek EJ 3rd, Reed GW, Hebert JR, Cohen NL, Merriam PA, Ockene IS. Association between eating patterns and obesity in a free-living US adult population. Am J Epidemiol 2003; 158(1): 85-92.
- 21. Ministry of Health and Welfare, Korea Centers for Disease Control and Prevention. Korea National Health and Nutrition Examination Survey (KNHANES V-3). 2013; cited October 13, 2014]. Available from https://knhanes.cdc.go.kr/knhanes/index.do.
- 22. Moon EH, Kim KW. Evaluation of nutrition education for hypertension patients aged 50 years and over. Korean J Community Nutr 2011; 16(1): 62-74.
- 23. Moon HK, Choi SO, Kim JE. Dishes contributing to sodium intake of elderly living in rural areas. Korean J Community Nutr 2009; 14(1): 123-136.
- 24. Moroshko I, Brennan L, O'Brien P. Predictors of dropout in weight loss intervention: a systematic review of the literature. Obes rev 2011; 12(11): 912-934.
- 25. Park YS, Son SM, Lim WJ, Kim SB, Chung YS. Comparison of dietary behaviors related to sodium intake by gender and age. Korean J Community Nutr 2008; 13(1): 1-12.
- 26. Redman LM, Heilbronn LK, Martin CK, de Jonge L, Williamson DA, Delany JP, Ravussin E. Metabolic and behavioral compensations in response to caloric restriction: implications for the maintenance of weight loss. PLoS One 2009; 4(2): e4377.
- 27. Ruppert M, Diehl J, Kolloch R, Overlack A, Kraft K, Göbel B, Hitte N, Stumpe KO. Short term dietary sodium restriction increases serum lipids and insulin in salt-sensitive and saltresistant normotensive adults. Klin Wochenschr 1991; 69(25): 51-57.
- 28. Scagliusi FB, Ferriolli E, Pfrimer K, Laureano C, Cunha CS, Gualano B, Lourenco BH, Lancha AH. Characteristics of women who frequently under report their energy intake: a doubly labelled water study. Eur J Clin Nutr 2009; 63(10): 1192-1199.
- 29. Son SM, Huh GY. Dietary risk factors associated with hypertension in patients. Korean J Community Nutr 2006; 11(5): 661-672.
- 30. Tomiyama AJ, Mann T, Vinas D, Hunger JM, Dejager J, Taylor SE. Low calorie dieting increases cortisol. Psychosom Med 2010; 72(4): 357-364.
- 31. World Health Organization. Obesity: preventing and managing the global epidemic. Report of a WHO consultation. Geneva: 2004. p. 39-53.
- 32. Yim KS. Evaluation of the effectiveness of a nutrition education program for hypertensive patients at the community level. Korean J Community Nutr 2000; 5(4): 654-661.
- 33. Yoon YS, Oh SW. Sodium density and obesity; the Korea National Health and Nutrition Examination Survey 2007-2010. Eur J Clin Nutr 2013; 67(2): 141-146.
- 34. Yun HK, Kim HS, Chang N. Diet quality index-international score is correlated with weight loss in female college students on a weight management program. Korean J Nutr 2009; 42(5): 453-463.
REFERENCES
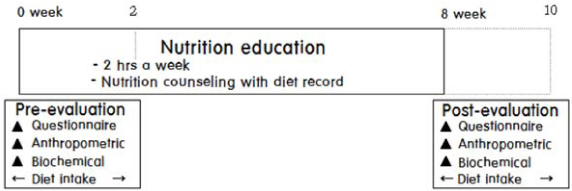
Table 1Components of the Diet Quality Index-International (DQI-I)
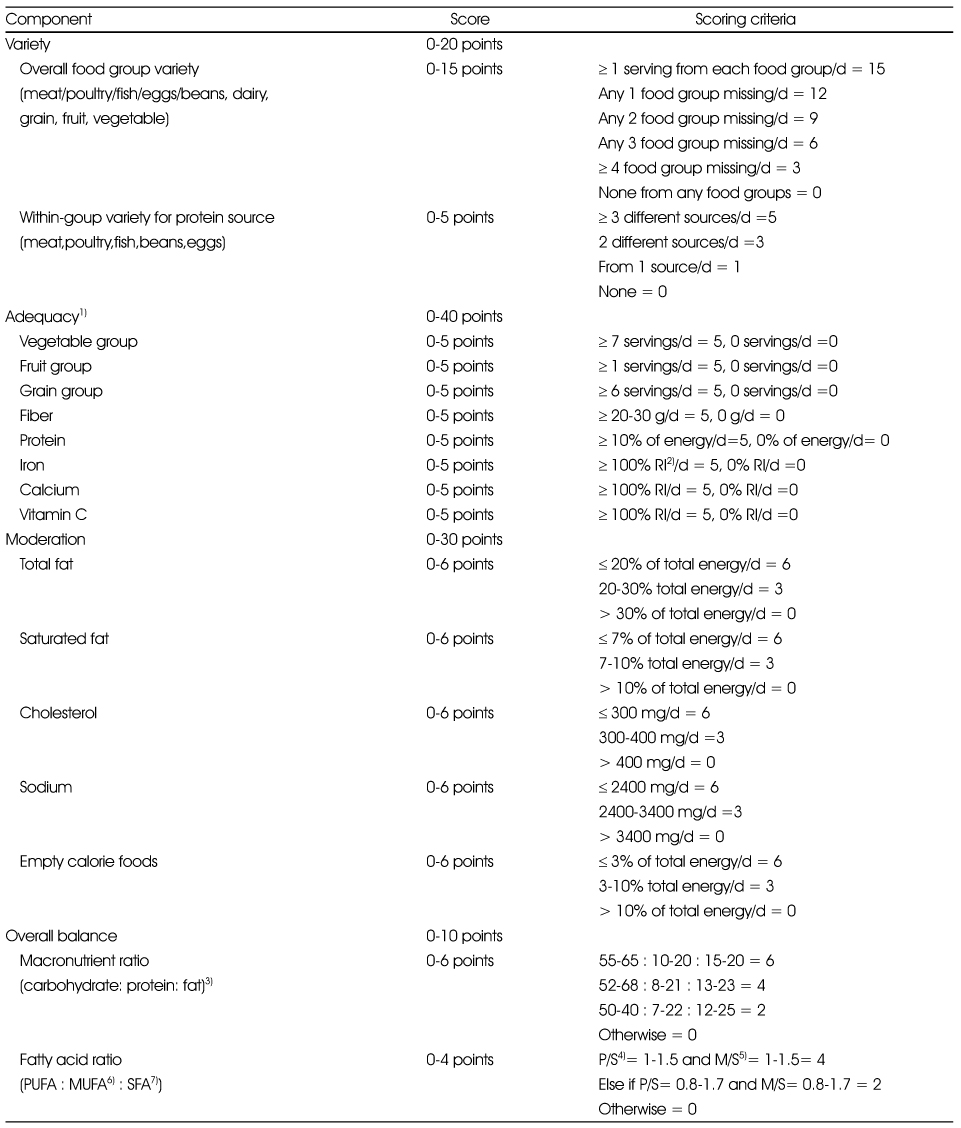
Adapted from Yun et al. (2009)
1) The criteria of score is based on the RI value for Korean
2) RI: recommended intakes
3) Ratio of energy from carbohydrate to protein to fat following DRIs for Korean
4) P/S: ratio of PUFA to SFA intake
5) M/S: ratio of MUFA to SFA intake
6) MUFA: monounsaturated fatty acids
7) SFA: saturated fatty acids
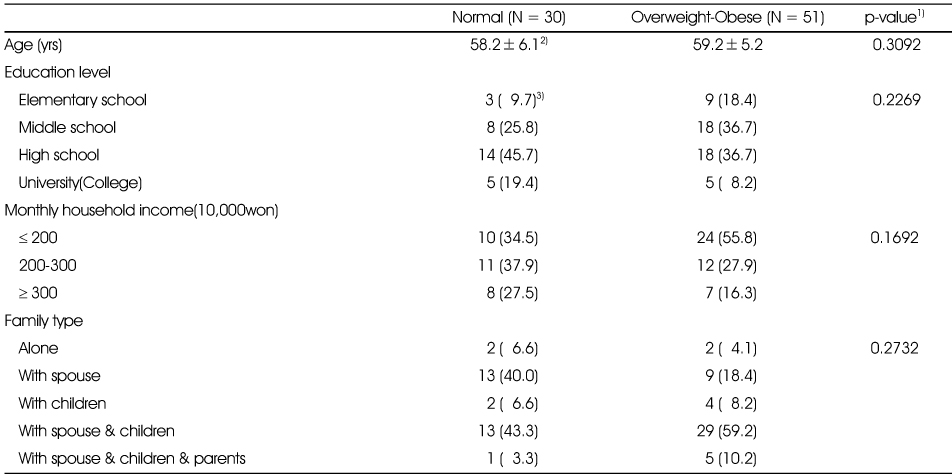
Table 3The changes in anthropometric, blood pressure and biochemical characteristics according to BMI classification
1) p value by paired t-test within groups, 2) p value by t-test between groups at pre-education stage, 3) p value by t-test between groups at post-education stage, 4) Mean±SD, 5) NS : not significant, 6) BMI; body mass index, 7) PBF; percentage of body fat 8) WC; waist circumference, 9) SBP; systolic blood pressure, 10) DBP; diastolic blood pressure, 11) FBS; fasting blood sugar, 12) TC; total cholesterol, 13) AI; atherogenic index, 14) FFA; free fatty acid
Table 4The dietary intake changes of the subjects after low-sodium diet education according to BMI classification
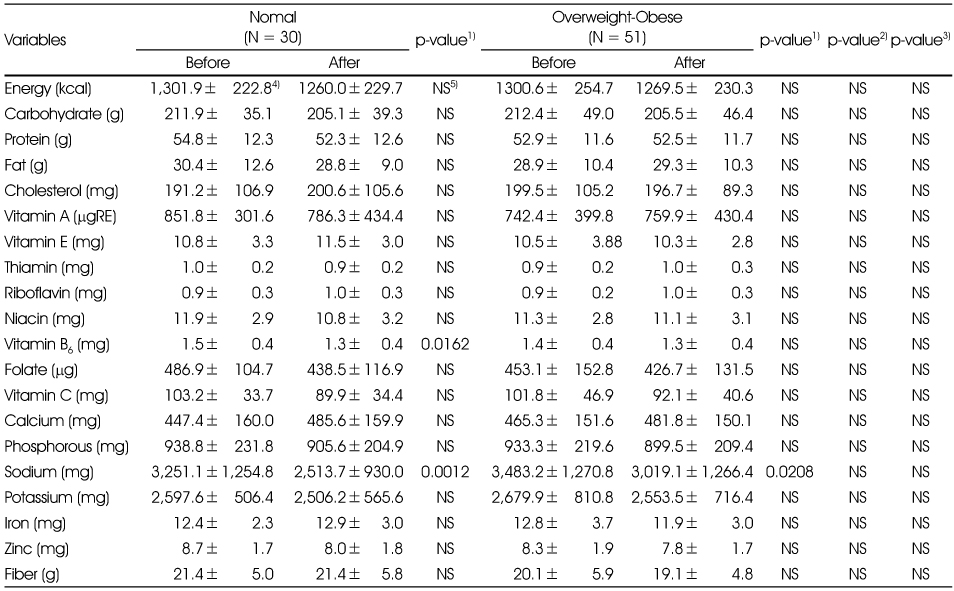
Table 5The change in general dietary habits of the subjects after low-sodium diet education according to BMI classification
1) p value by paired t-test within groups
2) p value by t-test between groups at pre-education stage
3) p value by t-test between groups at post-education stage
4) Mean±SD
5) NS: not significance
Score: 0.5 = less than once a week, 3 = 2-4 times a week, 5 = 5 times a week (Question 3, 5, 11, 15~19 are inverse-coded)
Table 6The changes in dietary behavior associated with sodium after low-sodium diet education according to BMI classification
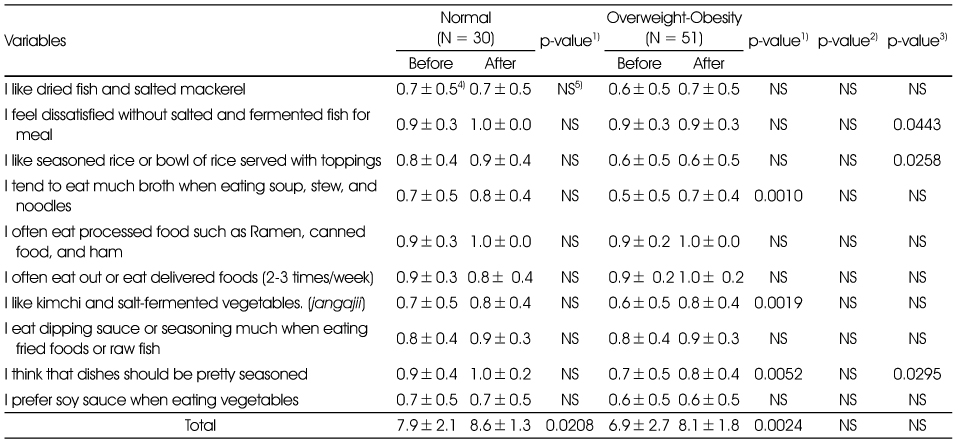
Table 7The changes in dietary diversity score (DDS) and dietary variety score (DVS) after low-sodium diet education according to BMI classification
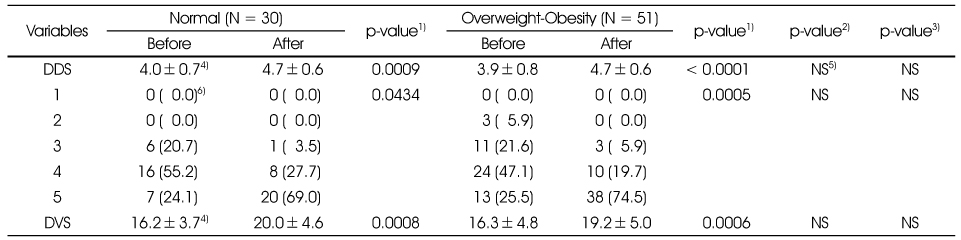
Table 8DQI-I score change of the subjects after low-sodium diet education according to BMI classification
1) p value by paired t-test within groups
2) p value by t-test between groups at pre-education stage
3) p value by t-test between groups at post-education stage
4) This score means perfect score of each evaluation standard presented in Table 1
5) Mean±SD
6) NS: not significant
Figure & Data
REFERENCES
Citations
Citations to this article as recorded by 
 PubReader
 Cite
CiteThe Effects of Low-sodium Diet Education Program on Dietary Habits, Diet Quality and Obesity Index in Overweight and Obese Middle-aged Women

Fig. 1
The protocol of the study.
Fig. 1
The Effects of Low-sodium Diet Education Program on Dietary Habits, Diet Quality and Obesity Index in Overweight and Obese Middle-aged Women
Components of the Diet Quality Index-International (DQI-I)
Adapted from Yun et al. (2009)
1) The criteria of score is based on the RI value for Korean
2) RI: recommended intakes
3) Ratio of energy from carbohydrate to protein to fat following DRIs for Korean
4) P/S: ratio of PUFA to SFA intake
5) M/S: ratio of MUFA to SFA intake
6) MUFA: monounsaturated fatty acids
7) SFA: saturated fatty acids
General characteristics of the study subjects
1) p value by t-test or chi-sqaure test between groups, 2) Mean±SD, 3) N (%)
The changes in anthropometric, blood pressure and biochemical characteristics according to BMI classification
1) p value by paired t-test within groups, 2) p value by t-test between groups at pre-education stage, 3) p value by t-test between groups at post-education stage, 4) Mean±SD, 5) NS : not significant, 6) BMI; body mass index, 7) PBF; percentage of body fat 8) WC; waist circumference, 9) SBP; systolic blood pressure, 10) DBP; diastolic blood pressure, 11) FBS; fasting blood sugar, 12) TC; total cholesterol, 13) AI; atherogenic index, 14) FFA; free fatty acid
The dietary intake changes of the subjects after low-sodium diet education according to BMI classification
1) p value by paired t-test within groups
2) p value by t-test between groups at pre-education stage
3) p value by t-test between groups at post-education stage
4) Mean±SD
5) NS: not significance
The change in general dietary habits of the subjects after low-sodium diet education according to BMI classification
1) p value by paired t-test within groups
2) p value by t-test between groups at pre-education stage
3) p value by t-test between groups at post-education stage
4) Mean±SD
5) NS: not significance
Score: 0.5 = less than once a week, 3 = 2-4 times a week, 5 = 5 times a week (Question 3, 5, 11, 15~19 are inverse-coded)
The changes in dietary behavior associated with sodium after low-sodium diet education according to BMI classification
1) p value by paired t-test within groups
2) p value by t-test between groups at pre-education stage
3) p value by t-test between groups at post-education stage
4) Mean±SD
5) NS: not significance
Score: Yes = 0, No = 1
The changes in dietary diversity score (DDS) and dietary variety score (DVS) after low-sodium diet education according to BMI classification
1) p value by paired t-test or chi-square test within groups
2) p value by t-test or chi-square test between groups at pre-education stage
3) p value by t-test or chi-square test between groups at post-education stage
4) Values are Mean±SD
5) NS: not significant
6) N (%)
DQI-I score change of the subjects after low-sodium diet education according to BMI classification
1) p value by paired t-test within groups
2) p value by t-test between groups at pre-education stage
3) p value by t-test between groups at post-education stage
4) This score means perfect score of each evaluation standard presented in
5) Mean±SD
6) NS: not significant
Table 1
Components of the Diet Quality Index-International (DQI-I)
Adapted from Yun et al. (2009) 1) The criteria of score is based on the RI value for Korean 2) RI: recommended intakes 3) Ratio of energy from carbohydrate to protein to fat following DRIs for Korean 4) P/S: ratio of PUFA to SFA intake 5) M/S: ratio of MUFA to SFA intake 6) MUFA: monounsaturated fatty acids 7) SFA: saturated fatty acids
Table 2
General characteristics of the study subjects
1) p value by t-test or chi-sqaure test between groups, 2) Mean±SD, 3) N (%)
Table 3
The changes in anthropometric, blood pressure and biochemical characteristics according to BMI classification
1) p value by paired t-test within groups, 2) p value by t-test between groups at pre-education stage, 3) p value by t-test between groups at post-education stage, 4) Mean±SD, 5) NS : not significant, 6) BMI; body mass index, 7) PBF; percentage of body fat 8) WC; waist circumference, 9) SBP; systolic blood pressure, 10) DBP; diastolic blood pressure, 11) FBS; fasting blood sugar, 12) TC; total cholesterol, 13) AI; atherogenic index, 14) FFA; free fatty acid
Table 4
The dietary intake changes of the subjects after low-sodium diet education according to BMI classification
1) p value by paired t-test within groups 2) p value by t-test between groups at pre-education stage 3) p value by t-test between groups at post-education stage 4) Mean±SD 5) NS: not significance
Table 5
The change in general dietary habits of the subjects after low-sodium diet education according to BMI classification
1) p value by paired t-test within groups 2) p value by t-test between groups at pre-education stage 3) p value by t-test between groups at post-education stage 4) Mean±SD 5) NS: not significance Score: 0.5 = less than once a week, 3 = 2-4 times a week, 5 = 5 times a week (Question 3, 5, 11, 15~19 are inverse-coded)
Table 6
The changes in dietary behavior associated with sodium after low-sodium diet education according to BMI classification
1) p value by paired t-test within groups 2) p value by t-test between groups at pre-education stage 3) p value by t-test between groups at post-education stage 4) Mean±SD 5) NS: not significance Score: Yes = 0, No = 1
Table 7
The changes in dietary diversity score (DDS) and dietary variety score (DVS) after low-sodium diet education according to BMI classification
1) p value by paired t-test or chi-square test within groups 2) p value by t-test or chi-square test between groups at pre-education stage 3) p value by t-test or chi-square test between groups at post-education stage 4) Values are Mean±SD 5) NS: not significant 6) N (%)
Table 8
DQI-I score change of the subjects after low-sodium diet education according to BMI classification
1) p value by paired t-test within groups 2) p value by t-test between groups at pre-education stage 3) p value by t-test between groups at post-education stage 4) This score means perfect score of each evaluation standard presented in 5) Mean±SD 6) NS: not significant


