Articles
- Page Path
- HOME > Korean J Community Nutr > Volume 21(5); 2016 > Article
-
Research Article
- Food Allergy Awareness and Nutritional Management by the Parents of Preschool Children
-
Soo Bin Kim, Jung Hee Kim

-
Korean Journal of Community Nutrition 2016;21(5):426-439.
DOI: https://doi.org/10.5720/kjcn.2016.21.5.426
Published online: October 31, 2016
Department of Food and Nutrition, College of Natural Sciences, Seoul Women’s University, Seoul, Korea.
- Corresponding author: Jung Hee Kim. Department of Food and Nutrition, College of Natural Sciences, Seoul Women’s University, 621 Hwarangno, Nowon-gu, Seoul 01797, Korea. Tel: (02) 970-5646, Fax: (02) 976-4049, jheekim@swu.ac.kr
Copyright © 2016 The Korean Society of Community Nutrition
This is an Open-Access article distributed under the terms of the Creative Commons Attribution Non-Commercial License (http://creativecommons.org/licenses/by-nc/3.0/) which permits unrestricted non-commercial use, distribution, and reproduction in any medium, provided the original work is properly cited.
- 120 Views
- 0 Download
- 6 Crossref
Abstract
-
Objectives
- This study was performed to measure the food allergy (FA) awareness and management by the parents of preschool children.
-
Methods
- A questionnaire survey was conducted with the parents of preschool children. The questionnaire was designed to identify the prevalence of food allergies, requirements of food allergy support and differences in food management according to the presence or absence allergic diseases, using a modified International Study of Asthma and Allergies in Childhood (ISAAC) questionnaire. After excluding incomplete responses, the data of 158 parents of preschool children (90.3%) was used for statistical analysis.
-
Results
- The rate of the preschool children who had experienced food allergy (FA, ever) was 38.6% while diagnosed for food allergy by doctor (Diagnosis of FA, ever) was 17.7%. Forty nine preschool children (80.3%) had food restriction, and twenty three of them (37.7%) had self-restriction without diagnosis. The consumption frequencies of allergenic foods in FA group, such as ramyeon, noodles, bread, eggs, yogurt and ice cream were significantly (p<0.001) lower than those of the other two groups. The major allergenic foods were eggs, milk, wheat and processed foods in FA group. The overall food allergy-related knowledge level of parents was insufficient. Only 26 parents (16.5%) had received training about food allergies. All parents wanted to receive food allergy-related supports. In addition, most of parents wanted information on substitute menu for children with food allergy.
-
Conclusions
- This study identified a lack of food allergy training for the parents of preschool children and the necessity for food allergy education. Food allergy-related supports, such as menus without allergenic ingredients, guidelines for managing food allergy & anaphylaxis emergency care plan etc, should be provided to the parents in order to avoid events related to food allergies.
Acknowledgments
Acknowledgments
- 1. Ministry of Health & Welfare. Korea Centers for Disease Control and Prevention. Atopy · asthma relief school management guide. 2015. p. 3.
- 2. Prescott SL, Pawankar R, Allen KJ, Campbell DE, Sinn JK, Fiocchi A, et al. A global survey of changing patterns of food allergy burden in children. World Allergy Organ J 2013; 6(1): 21.ArticlePubMedPMCPDF
- 3. Leung TF, Yung E, Wong YS, Lam CW, Wong GW. Parent-reported adverse food reactions in Hong Kong Chinese pre-schoolers: epidemiology, clinical spectrum and risk factors. Pediatr Allergy Immunol 2009; 20(4): 339-346.ArticlePubMed
- 4. Prescott S, Allen KJ. Food allergy: riding the second wave of the allergy epidemic. Pediatr Allergy Immunol 2011; 22(2): 155-160.ArticlePubMed
- 5. Kay AB. T Cells as orchestrators of the asthmatic response. Ciba Found Symp 1997; 206: 56-67.ArticlePubMed
- 6. World Allergy Organization. White book on allergy(section 2.5. Food allergy). 2011. p. 47-53.
- 7. Rona RJ, Keil T, Summers C, Gislason D, Zuidmeer L, Sodergren E, et al. The prevalence of food allergy: a meta-analysis. J Allergy Clin Immunol 2007; 120(3): 638-646.ArticlePubMed
- 8. Jung YH, Ko H, Kim HY, Seo JH, Kwon JW, Kim BJ, et al. Prevalence and risk factors of food allergy in preschool children in Seoul. Korean J Asthma Allergy Clin Immunol 2011; 31(3): 177-183.
- 9. Allen KJ, Hill DJ, Heine RG. 4. Food allergy in childhood. Med J Aust 2006; 185(7): 394-400.ArticlePubMedPDF
- 10. Sicherer SH, Sampson HA. Food allergy. J Allergy Clin Immunol 2010; 125: 2 Suppl 2. 116-125.Article
- 11. Oh JW, Kim KE, Pyun BY, Lee HR, Choung JT, Hong SJ. Nationwide study for epidemiological change of atopic dermatitis in school aged children between 1995 and 2000 and kindergarten aged children in 2003 in Korea. Pediatr Allergy Respir Dis 2003; 13(4): 227-237.
- 12. Han YS. Management of food allergy in the community. Food Sci Ind 2015; 48(1): 24-31.
- 13. Seo WH, Jang EY, Han YS, Ahn KM, Jung JT. Management of food allergies in young children at a child care center and hospital in Korean. Pediatr Allergy Respir Dis 2011; 21(1): 32-38.Article
- 14. Simons FE. Anaphylaxis. J Allergy Clin Immunol 2010; 125: 2 Suppl 2. 161-181.Article
- 15. Korea Consumer Agency. Information analysis related to allergies. 2012. p. 1-22.
- 16. Kang MH, Kim EY, Choi MK. Assessment of nutrient intake and ADHD score in atopic dermatitis preschoolers. J East Asian Soc Diet Life 2009; 19(4): 493-502.
- 17. Shin JW, Kim WK, Yoon HS. Association of breast-feeding and allergic diseases in preschool aged children. Pediatr Allergy Respir Dis 2009; 19(4): 374-382.
- 18. Yang SH, Kim EJ, Kim YN, Seong KS, Kim SS, Han CK, et al. Comparison of eating habits and dietary intake patterns between people with and without allergy. Korean J Nutr 2009; 42(6): 523-535.Article
- 19. Yum H. Association of brestfeeding and allergic diseases. Pediatr Allergy Respir Dis 2009; 19(4): 325-328.
- 20. Han YS, Chung SJ, Cho YY, Choi HM, Ahn KM, Lee SI. Analysis of the rate of sensitization to food allergen in children with atopic dermatitis. Korean J Community Nutr 2004; 9(1): 90-97.
- 21. Kim DS, Ban JS, Park EA, Lee JY, Lee JO, Chang EY, et al. Survey of food allergy in elementary school students in Dongjak-gu using questionnaire. Korean J Asthma Allergy Clin Immunol 2011; 31(4): 254-259.
- 22. Lee AH, Kim KE, Lee KE, Kim SH, Wang TH, Kim KW, et al. Prevalence of food allergy and perceptions on food allergen labeling in school foodservice among Korean students. Allergy Asthma Respir Dis 2013; 1(3): 227-234.Article
- 23. Kim TH. Study on awareness of food allergen labeling [master’s thesis]. Kyonggi University; 2013.
- 24. Lee HS, Hong SC, Kim JH, Kim JW, Lee KH, Lee JC. Prevalence of food allergy and the sensitization rates of food allergens in school-aged children in Jeju. Korean Public Health Res 2014; 40(3): 49-58.
- 25. Won JH. A study on the awareness and management of food allergy among nutritionist and nutrition teachers in elementary and high schools in Seoul [master’s thesis]. Sookmyung Women’s University; 2015.
- 26. Ministry of Government Legislation. School Meals Act Enforcement Regulation 2013. cited 2015 Nov 7]. Available from: http://www.law.go.kr/lsInfoP.do?lsiSeq=166408&efYd=20150101#000.
- 27. Lee SI. Development of guidelines on infant feeding and weaning for healthy eating habits. Korea Science and Engineering Foundation; 2005. Report No. R01-2002-000-00199-0.
- 28. Kim HI. Research Methods in Sampling. 1st ed. Kyungmoonsa; 2014. p. 9.
- 29. Kim HB, Park YM. Introduction to Statistics. 1st ed. PNCMEDIA; 2014. p. 21.
- 30. Cho CH. SPSS/AMOS utilization, structural equation modeling, statistical analysis. 2nd ed. Chungram; 2014. p. 161-162 .
- 31. Lee MS, Lee KH. Development and application of dietary education to improve the vegetable intake of preschoolers. J Korean Diet Assoc 2014; 20(1): 26-35.Article
- 32. Burks AW, Jones SM, Boyce JA, Sicherer SH, Wood RA, Assa’ad A, et al. NIAID-sponsored 2010 guidelines for managing food allergy: applications in the pediatric population. Pediatrics 2011; 128(5): 955-965.ArticlePDF
- 33. Mori F, Serranti D, Barni S, Pucci N, Rossi ME, de Martino M, et al. A kwashiorkor case due to the use of an exclusive rice milk diet to treat atopic dermatitis. Nutr J 2015; 14(1): 83.ArticlePDF
- 34. Kim YG, Yu KH, Ly SY. Perception of elementary school parents in Gyeongbuk area on allergenic food labeling system and children’s food allergy status. Korean J Hum Ecol 2013; 22(5): 491-506.Article
- 35. Lee EJ. A study on food allergy occur status and parental perceptions of food allergen labeling system in school food service [master’s thesis]. Pusan National University; 2015.
- 36. Ministry of Food and Drug Safety. Indication standard of foods etc [internet]. Ministry of Food and Drug Safety; 2015; cited 2015 Nov 7]. Available from: http://www.mfds.go.kr/index.do?mid=686&geNo=11&seq=9543&cmd=v.
- 37. Food Allergy Research & Education, Inc. About food allergy [internet]. Food Allergy & Anaphylaxis Network (FAAN) and the Food Allergy Initiative (FAI); 2015; cited 2015 Nov 7Available from: http://www.foodallergy.org/most popular-resources.
REFERENCES
Anthropometric measurements of the subjects by allergy status

1) FA; food allergy, OA; other allergy, NA; non allergy
2) Value by Fisher’s exact test since cells have expected frequency less than 5
3) Assessment: under (< 5 percentile), normal (5~95 percentile), over (≥ 95 percentile)
4) N (%)
5) Assessment: under (< 90%), normal (90~109%), over (110~119%), obesity (≥ 120%)
PIBW: percent ideal body weight
Food allergy awareness and knowledge of the parents of preschool children
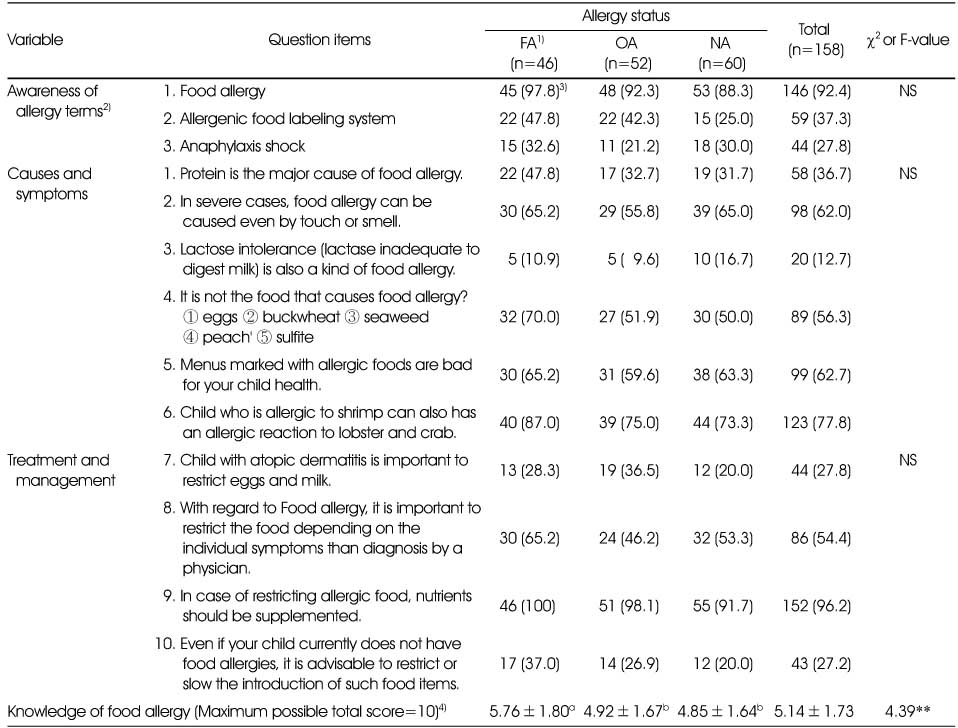
1) FA; food allergy, OA; other allergy, NA; non allergy
2) High degree of awareness (answered 'yes'): 1, low degree of awareness (answered 'no' or 'unknown'): 0
3) N (%) of awareness or N (%) of correct answer
4) Knowledge of food allergy: correct answer: 1, wrong answer (include 'unknown'): 0
Values are Mean±SD
**: p<0.01 by ANOVA, NS: not significant
a,b: Means with different superscript letter are significantly different at p<0.05 by Duncan’s multiple range test.
Intake frequency of grains, vegetables, fruits and dairy product in preschool children by allergy status

Figure & Data
REFERENCES
Citations

- The status of food allergy and parental burden of preschoolers in Jeju area
Jeong Eun Oh, Eunyoung Kim, Yunkyoung Lee
Journal of Nutrition and Health.2021; 54(6): 664. CrossRef - Study on the snack meal management for infants and toddlers and the demand for snack products according to the sustainable dietary style of mothers in Jeonbuk area
Ji-Eun Lee, Jeong-Ok Rho
Journal of Nutrition and Health.2020; 53(1): 39. CrossRef - Study on the status of food allergy management and importance-performance analysis about precautions of food allergy in school foodservice according to the school types in Jeonbuk area
Ji Yeon Kim, Jeong Ok Rho
Journal of Nutrition and Health.2020; 53(3): 329. CrossRef - Study on the snack menu pattern, food diversity and satisfaction of parent provided by Center for Children's Foodservice Management in Jeonbuk area
Eun-Byul Sym, Jeong-Ok Rho
Journal of Nutrition and Health.2019; 52(5): 501. CrossRef - Food Allergy-related Awareness and Performance of Dietitians at Children's Hospitals in Korea: Comparison of Certificate Possession among Clinical Dietitians
Hye-Ran Shin, Sook-Bae Kim
Korean Journal of Community Nutrition.2019; 24(6): 512. CrossRef - Food Allergy Awareness and Nutritional Management by Preschooler's Faculty Members of Child Care Facilities
Soo Bin Kim, Jung Hee Kim
Korean Journal of Community Nutrition.2017; 22(4): 298. CrossRef
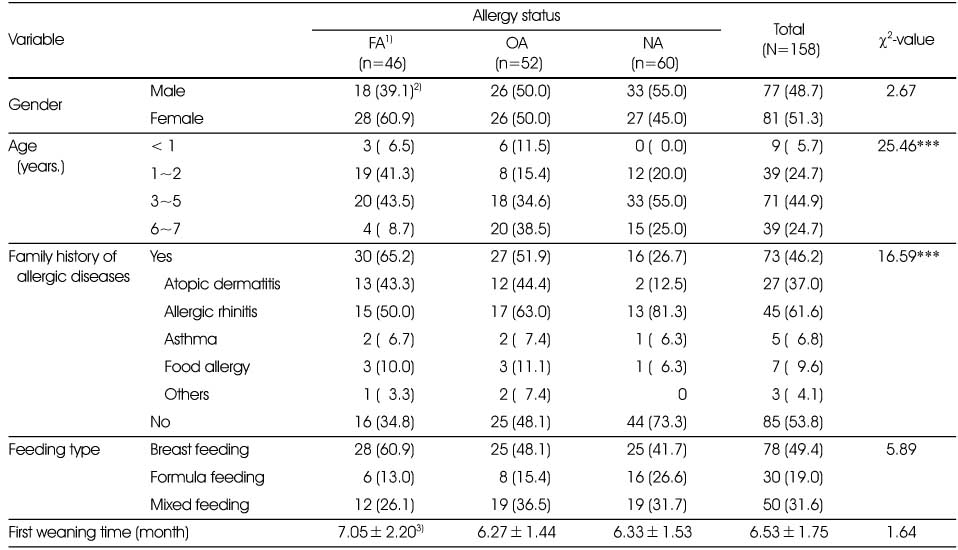
General characteristic of the subjects by allergy status
1) Group: FA; food allergy, OA; other allergy, NA; non allergy
2) N (%)
3) Mean±SD
***: p<0.001 by Chi-square test
Anthropometric measurements of the subjects by allergy status
1) FA; food allergy, OA; other allergy, NA; non allergy
2) Value by Fisher’s exact test since cells have expected frequency less than 5
3) Assessment: under (< 5 percentile), normal (5~95 percentile), over (≥ 95 percentile)
4) N (%)
5) Assessment: under (< 90%), normal (90~109%), over (110~119%), obesity (≥ 120%)
PIBW: percent ideal body weight
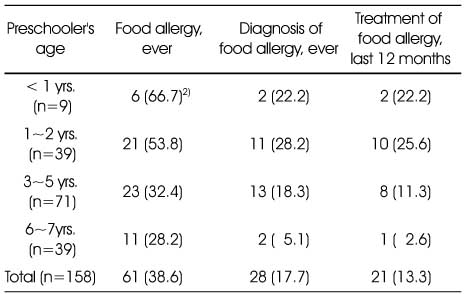
Prevalence of food allergy among preschool children using ISAAC1) written questionnaire
1) International study of asthma and allergies in childhood
2) N (%) of yes
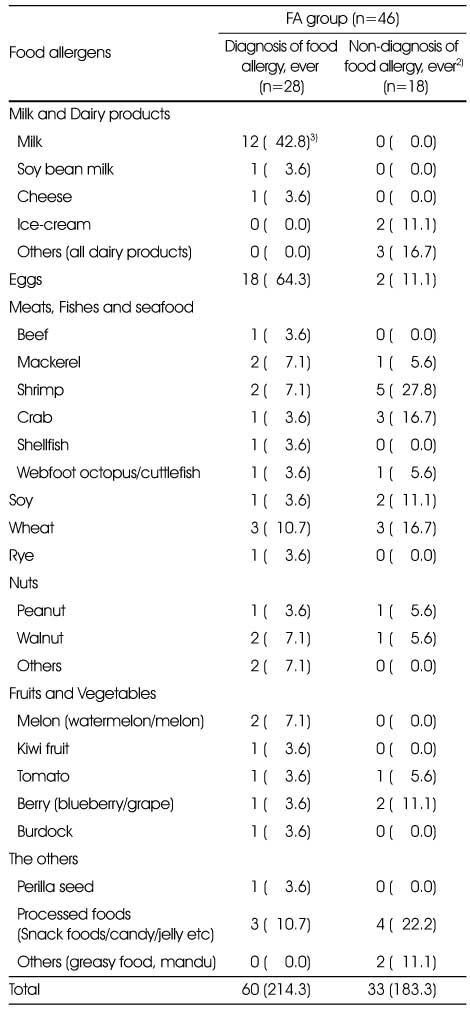
Food allergens of preschool children reported by their parents1)
1) Data are multiple responses (parents of preschool children were allowed to select more than one food allergen).
2) preschool children who have restricted diet because of real food allergy symptoms, but not diagnosed by physician.
3) N (%)
Food allergy awareness and knowledge of the parents of preschool children
1) FA; food allergy, OA; other allergy, NA; non allergy
2) High degree of awareness (answered 'yes'): 1, low degree of awareness (answered 'no' or 'unknown'): 0
3) N (%) of awareness or N (%) of correct answer
4) Knowledge of food allergy: correct answer: 1, wrong answer (include 'unknown'): 0
Values are Mean±SD
**: p<0.01 by ANOVA, NS: not significant
a,b: Means with different superscript letter are significantly different at p<0.05 by Duncan’s multiple range test.
Dietary habits of the preschool children by allergy status
1) FA; food allergy, OA; other allergy, NA; non allergy
2) N (%)
3) Data are multiple responses.
4) N (%): Except for those preschool children, before starting the weaning food (n=8)
**: p<0.01 by Chi-square test
Intake frequency of grains, vegetables, fruits and dairy product in preschool children by allergy status
1) FA; food allergy, OA; other allergy, NA; non allergy
2) N (%)
***: p<0.001 by Fisher’s exact test since cells have expected frequency less than 5 or Chi-square test)
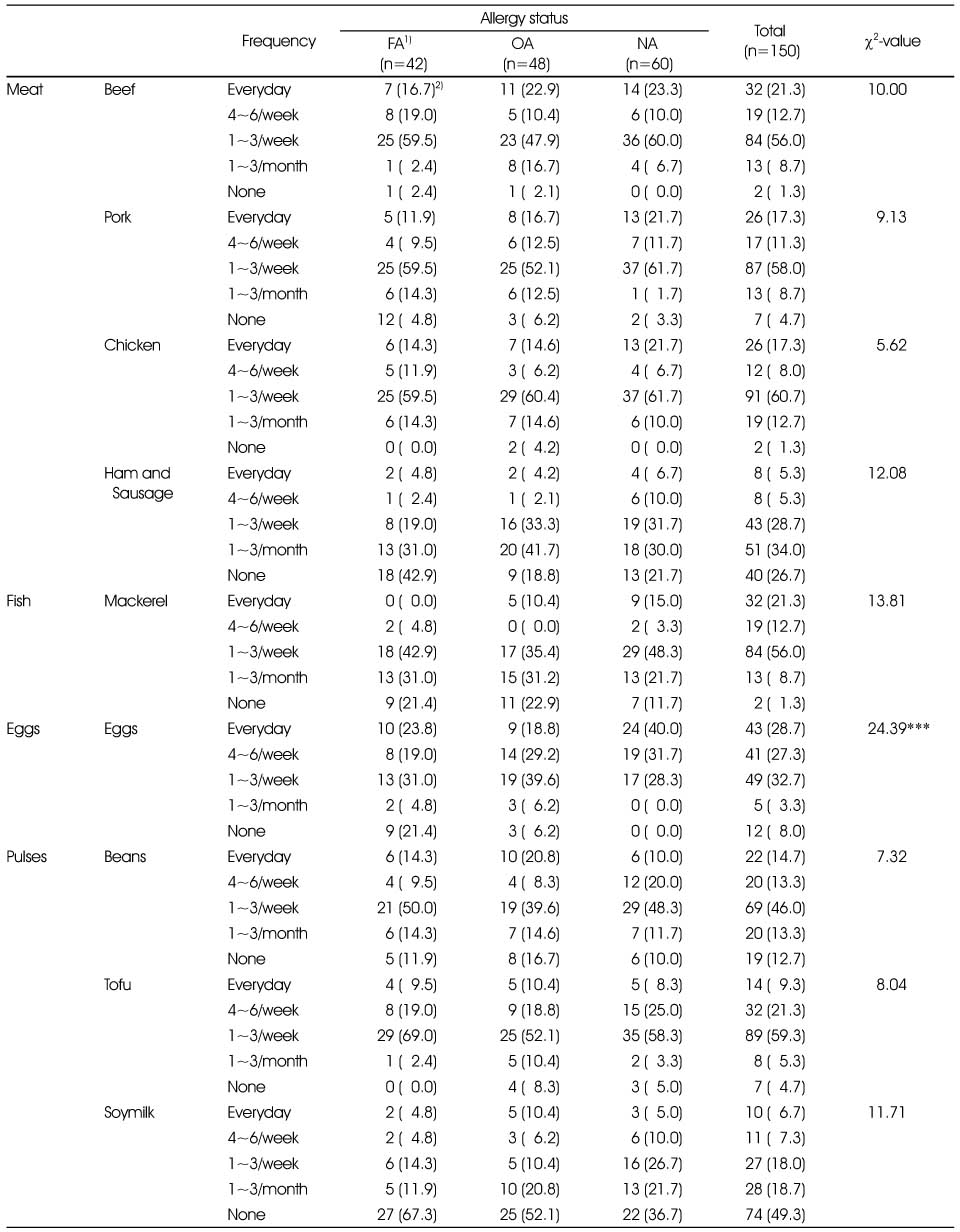
Intake frequency of meats, fish, eggs and pulses in preschool children by allergy status
1) FA: food allergy, OA: other allergy, NA: non allergy 2) N (%)
***: p<0.001 by Fisher’s exact test since cells have expected frequency less than 5
Food allergy care and management status of the parents of preschool children
1) FA; food allergy, OA; other allergy, NA; non allergy
2) N (%)
3) ”Education experience on food allergy?” only corresponded 'yes'
4) Data are multiple responses.
**: p < 0.01 , ***: p < 0.001 by Fisher’s exact test since cells have expected frequency less than 5 or Chi-square test)
1) Group: FA; food allergy, OA; other allergy, NA; non allergy 2) N (%) 3) Mean±SD ***: p<0.001 by Chi-square test
1) FA; food allergy, OA; other allergy, NA; non allergy 2) Value by Fisher’s exact test since cells have expected frequency less than 5 3) Assessment: under (< 5 percentile), normal (5~95 percentile), over (≥ 95 percentile) 4) N (%) 5) Assessment: under (< 90%), normal (90~109%), over (110~119%), obesity (≥ 120%) PIBW: percent ideal body weight
1) International study of asthma and allergies in childhood 2) N (%) of yes
1) Data are multiple responses (parents of preschool children were allowed to select more than one food allergen). 2) preschool children who have restricted diet because of real food allergy symptoms, but not diagnosed by physician. 3) N (%)
1) FA; food allergy, OA; other allergy, NA; non allergy 2) High degree of awareness (answered 'yes'): 1, low degree of awareness (answered 'no' or 'unknown'): 0 3) N (%) of awareness or N (%) of correct answer 4) Knowledge of food allergy: correct answer: 1, wrong answer (include 'unknown'): 0 Values are Mean±SD **: p<0.01 by ANOVA, NS: not significant a,b: Means with different superscript letter are significantly different at p<0.05 by Duncan’s multiple range test.
1) FA; food allergy, OA; other allergy, NA; non allergy 2) N (%) 3) Data are multiple responses. 4) N (%): Except for those preschool children, before starting the weaning food (n=8) **: p<0.01 by Chi-square test
1) FA; food allergy, OA; other allergy, NA; non allergy 2) N (%) ***: p<0.001 by Fisher’s exact test since cells have expected frequency less than 5 or Chi-square test)
1) FA: food allergy, OA: other allergy, NA: non allergy 2) N (%) ***: p<0.001 by Fisher’s exact test since cells have expected frequency less than 5
1) FA; food allergy, OA; other allergy, NA; non allergy 2) N (%) 3) ”Education experience on food allergy?” only corresponded 'yes' 4) Data are multiple responses. **: p < 0.01 , ***: p < 0.001 by Fisher’s exact test since cells have expected frequency less than 5 or Chi-square test)

 KSCN
KSCN


 PubReader
 Cite
Cite


