Articles
- Page Path
- HOME > Korean J Community Nutr > Volume 20(2); 2015 > Article
-
Research Article
- A Comparison of Salty Taste Assessment, Dietary Attitude and Dietary Behavior among Adult and Senior Women by Region and by Age in Korea
- Lin Jiang, Yun-Young Jung, Hyung-Sook Kim, Gi-Seon Nam, Jin-Sook Yun, Jong-Wook Kim, Yeon-Kyung Lee
-
Korean Journal of Community Nutrition 2015;20(2):109-119.
DOI: https://doi.org/10.5720/kjcn.2015.20.2.109
Published online: April 30, 2015
1Department of Food Science and Nutrition, Kyungpook National University, Daegu, Korea.
2Department of Food and Nutrition, University of Suwon, Gyeonggi, Korea.
3Division of Diet Research, Institute of Food and Culture, Pulmuone, Seoul, Korea.
4Department of Food Science and Nutrition, Keimyung University, Daegu, Korea.
5International Cooperation Office, Ministry of Food and Drug Safety, Chungchengbuk-do, Korea.
- Corresponding author: Yeon-Kyung Lee. Department of Food Science & Nutrition, Kyungpook National University, 80 Daehakro, Bukgu, Daegu 702-701, Korea. Tel: (053) 950-6234, Fax: (053) 950-6229, yklee@knu.ac.kr
Copyright © 2015 The Korean Society of Community Nutrition
This is an Open-Access article distributed under the terms of the Creative Commons Attribution Non-Commercial License (http://creativecommons.org/licenses/by-nc/3.0/) which permits unrestricted non-commercial use, distribution, and reproduction in any medium, provided the original work is properly cited.
- 135 Views
- 0 Download
- 4 Crossref
Abstract
-
Objectives
- The purpose of this study was to compare and analyze the results of salty taste assessment, dietary attitudes, and dietary behaviors among adult and senior women by region and by age. The results generated from this was expected to provide fundamental data for implementing a nationwide salt reduction education program.
-
Methods
- The salty taste assessment tool was applied to 4,064 subjects from 15 areas in Korea. Also, a survey of dietary attitude and dietary behavior related to salt intake was conducted for all subjects participated in this study.
-
Results
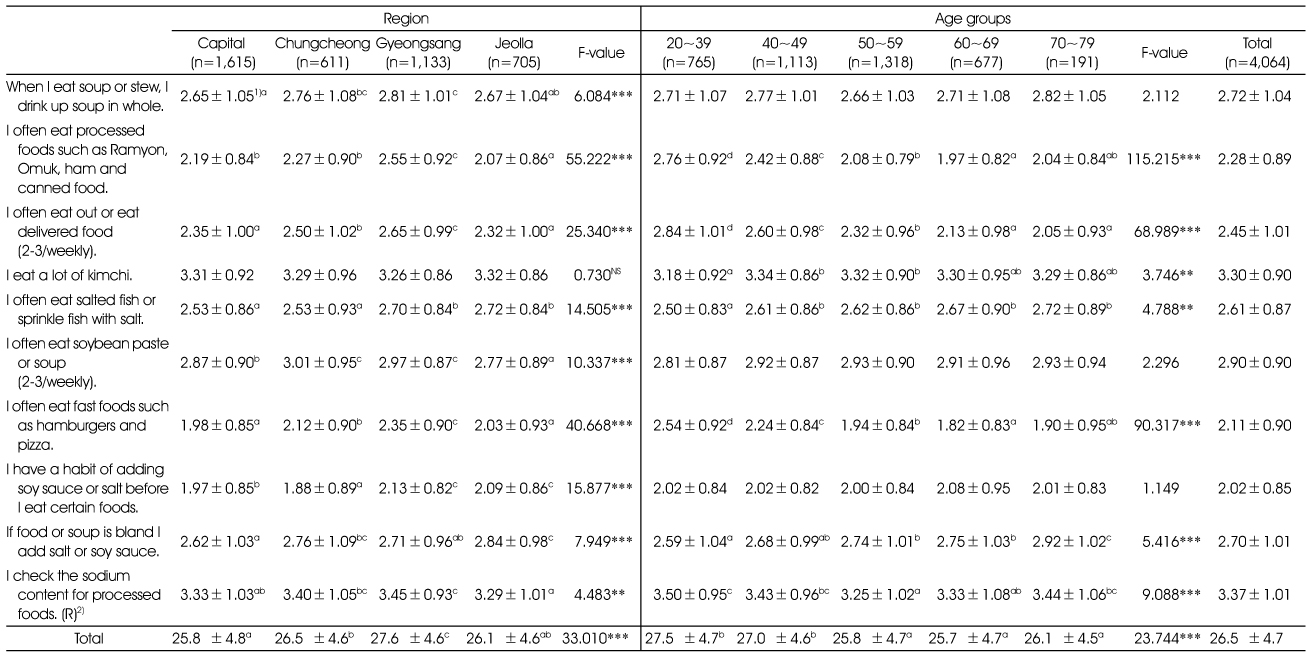
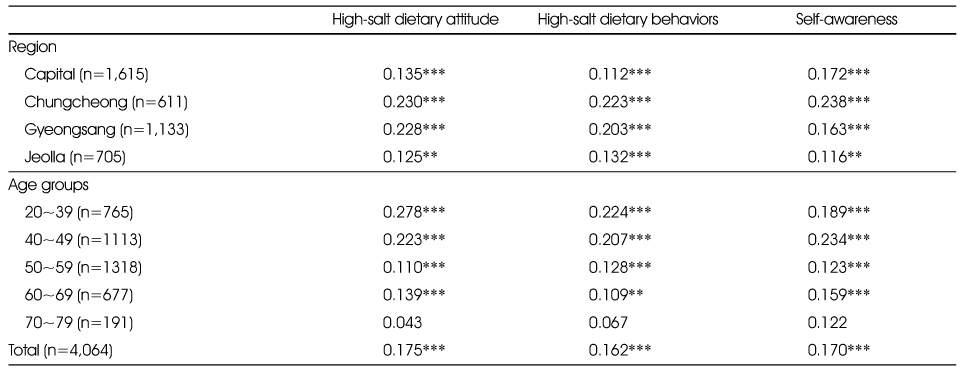
- The salty taste assessment scores by region and by age were the lowest in capital (p < 0.01) and was highest among the 70+ year age group (p < 0.01). The dietary attitude scores and dietary behavior scores showed that Gyeongsang was the highest (p < 0.001) and the capital was the lowest. The dietary attitude scores were highest at 20&30's followed by 40's and 70's group (p < 0.001). Dietary behavior scores showed that 20's~30's and 40's groups were higher than the other age groups (p < 0.001). The score of 'I like kimchi' was 3.46 ± 0.88, which was the highest among 10 dietary behavior questions. The score of 'I eat a lot of kimchi' was 3.30 ± 0.90, which was the highest among 10 dietary behavior questions related to salt intake. The scores of salty taste assessment had significant positive correlations between the scores of dietary attitude (p < 0.001), dietary behavior (p < 0.001) and self-awareness (p < 0.001).
-
Conclusions
- Based on the results of salty taste assessment, we observed a tendency that older people and regions except the capital had higher preference for salty taste. Our results suggested the necessity for a nationwide salty reduction education program tailored for regions and for different age groups.
Acknowledgments
Acknowledgments
- 1. Ahn SH, Kwon JS, Kim K, Yoon JS, Kang BW, Kim JW, Heo S, Cho HY, Kim HK. Study on the eating habits and practicability of guidelines for reducing sodium intake according to the stage of change in housewives. Korean J Community Nutr 2012; 17(6): 724-736.Article
- 2. Chang SO. Effect of a 6-month low sodium diet on the salt taste perception and pleasantness, blood pressure and the urinary sodium excretion in female college students. Korean J Nutr Health 2010; 43(5): 433-442.Article
- 3. Chang UJ, Jo JN. The relationship between food intake, sodium intake and satiety rate and the methods of consuming soup. J Korean Diet Assoc 2009; 15(4): 397-404.
- 4. Cho YY. Practice guidelines for reducing salt intake. Korean J Community Nutr 2002; 7(3): 394-400.
- 5. Chung HR. Policy approaches to reduce sodium intake of the public. Korean J Community Nutr 2002; 7(3): 405-409.
- 6. Chung EJ, Shim E. Salt-related dietary behaviors and sodium intake of university students in Gyeonggi-do. J Korean Soc Food Sci Nutr 2008; 37(5): 578-588.
- 7. Contreras RJ. Salt taste and disease. Am J Clin Nutr 1978; 31(6): 1088-1097.ArticlePubMed
- 8. Kim EK, Nam HW, Park YS, Myung CY, Lee KW. Nutrition through the Life Cycle. Shinkwang, Seoul: 2008. p. 232-264.
- 9. Kim EK, Yoo MY, Jean KS. Blood pressure, salt threshold, salt preference, urinary excretions and nutrition knowledge about blood pressure of elementary school children in rural area. Korean J Nutr 1993; 26(5): 625-638.
- 10. Kim HH, Lee YK. Analysis of presumed sodium intake of office workers using 24-hour urine analysis and correlation matrix between variables. Korean J Nutr 2013; 46(1): 26-33.Article
- 11. Kim JH, Chio MK. Salt intake behavior and blood pressure: the effect of taste sensitivity and preference. J Korean Living Sci Assoc 2007; 16(4): 837-848.Article
- 12. Kim HH, Jung YY, Lee YK. A Comparison of salty taste assessments and dietary attitudes and dietary behaviors associated with high-salt diets in four regions in Korea. Korean J Community Nutr 2012; 17(1): 38-48.Article
- 13. Kim HH, Shin EK, Lee HJ, Lee NH, Chun BY, Ann MY, Lee YK. Evaluation of the effectiveness of a salt reduction program for employees. Korean J Nutr 2009; 42(4): 350-357.Article
- 14. Kim KS, Paik HY. A comparative study on optimum gustation of salt and sodium intake in young and middle-aged Korean women. Korean J Nutr 1992; 25(1): 32-41.
- 15. Kim MO. A Study on the level of perception of the health condition of Koreans and Americans in Virginia, USA and their preference for salty taste. Korean J Food Nutr 2014; 27(4): 716-724.Article
- 16. Kim SJ, Kang SJ, Park YJ, Hwang JY. The association between changes in food and nutrient intakes and changes in bone metabolic indicators in postmenopausal women with osteopenia after a 12-week intervention of nutrition education and aerobic exercise. Korean J Community Nutr 2013; 18(3): 213-222.Article
- 17. Kim YS, Lee HM, Kim JH. Sodium-related eating behaviors of parents and its relationship to eating behaviors of their preschool children. Korean J Community Nutr 2015; 20(1): 11-20.Article
- 18. Kim YS, Paik HY. Measurement of Na intake in Korean adult female. Korean J Nutr 1987; 20(5): 341-349.
- 19. Lee YK, Jung YY, Jiang L. Development of computer program for salty taste assessment C-2012-010584. 2012; cited May 31, 2012]. Available from http://www.saltdown.com/.
- 20. Lee YK, Nam GS, Kim HS, Jung YY, Jiang L. Development, application of salty taste assessment kit. Report of Korean Ministry of Food and Drug Safety; 2011; cited November 11, 2011]. Available from http://report. ndsl.kr/repDetail.do?cn=TRKO201200007080.
- 21. Lee YK, Shin EK, Lee HJ. Salty taste assessment tool. Patent 2007; 10-0937610.
- 22. Matsuzuki H, Muto T, Haruyama Y. School children's salt intake is correlated with salty taste preference assessed by their mothers. Tohoku J Exp Med 2008; 215(1): 71-77.ArticlePubMed
- 23. Ministry of Health and Welfare. Korea Centers for Disease Control and Prevention. 2013 Korea National Health and Nutrition Examination Survey (KNHANESVI-1). 2014; cited December 16, 2014]. Available from http://knhanes.cdc.go.kr.
- 24. Moon HK, Choi SO, Kim JE. Dishes contributing to sodium intake of elderly living in rural areas. Korean J Community Nutr 2009; 14(1): 123-136.
- 25. Morino T, Langford HG. Salivary sodium correlates with salt recognition threshold. Physiol Behav 1978; 21(1): 45-48.Article
- 26. Nam HW, Lee KY. A study on the sodium and potassium intakes and their metabolism of the pregnant women in Korea. Korean J Nutr 1985; 18(3): 194-200.
- 27. Nordin S, Razani LJ, Markison S, Murphy C. Age-associated increases in intensity discrimination for taste. Exp Aging Res 2003; 29(3): 371-381.ArticlePubMed
- 28. Park YS, Son SM, Lim WJ, Kim SB, Chung YS. Comparison of dietary behaviors related to sodium intake by gender and age. Korean J Community Nutr 2008; 13(1): 1-12.
- 29. Preuss H, Clouatre DL. Sodium, chloride and potassium. Present knowledge in nutrition. USA: Wiley-Blackwell; 2003. p. 497-513.
- 30. Shin EK, Lee HJ, Ahn MY, Lee YK. Study on the development and evaluation of validity of salty taste assessment tool. Korean J Nutr 2008; 41(2): 184-191.
- 31. Shin EK, Lee HJ, Lee HJ, Lee JJ, Ann MY, Son SM, Lee YK. Estimation of sodium intake of adult female by 24-hour urine analysis, dietary records and dish frequency questionnaire (DFQ 55). Korean J Nutr 2010; 43(1): 79-85.Article
- 32. Son SM, Huh GY, Lee HS. Development and evaluation of validity of dish frequency questionnaire (DFQ) and short DFQ using Na index for estimation of habitual sodium intake. Korean J Community Nutr 2005; 10(5): 677-692.
- 33. Song MR, Lee KJ. Salinity and consumption patterns of Kimchi and soup, stew in Jeonju area. Korean J Food Cook Sci 2008; 24(1): 84-91.
- 34. Yoon JS, Lee MJ. Calcium status and bone mineral density by the level of sodium intake in young women. Korean J Community Nutr 2013; 18(2): 125-133.Article
REFERENCES
Figure & Data
REFERENCES
Citations

- Food and dish group diversity on menus of daycare centers provided by Center for Children’s Foodservice Management in Korea: a descriptive study
Youn-Rok Kang, Kyeong-Sook Lim, Hyung-Sook Kim
Korean Journal of Community Nutrition.2023; 28(6): 449. CrossRef - A Study on the Relationship between Metabolic Syndrome and Sodium among the Clients of the General Medical Examination Center
Mi-Jung Yun, Young-Mi Kim
Journal of the East Asian Society of Dietary Life.2018; 28(6): 404. CrossRef - Correlations Among Threshold and Assessment for Salty Taste and High-salt Dietary Behavior by Age
Lin Jiang, Yun-Young Jung, Yeon-Kyung Lee
Korean Journal of Community Nutrition.2016; 21(1): 75. CrossRef - Nutrition Knowledge, Dietary Attitude, and Dietary Behavior Related to Salt According to the Dietary Lifestyle Groups
Hei-Ryeo Yoon, Nam-E Kang, Juhyeon Kim
Korean Journal of Food & Cookery Science.2016; 32(3): 333. CrossRef
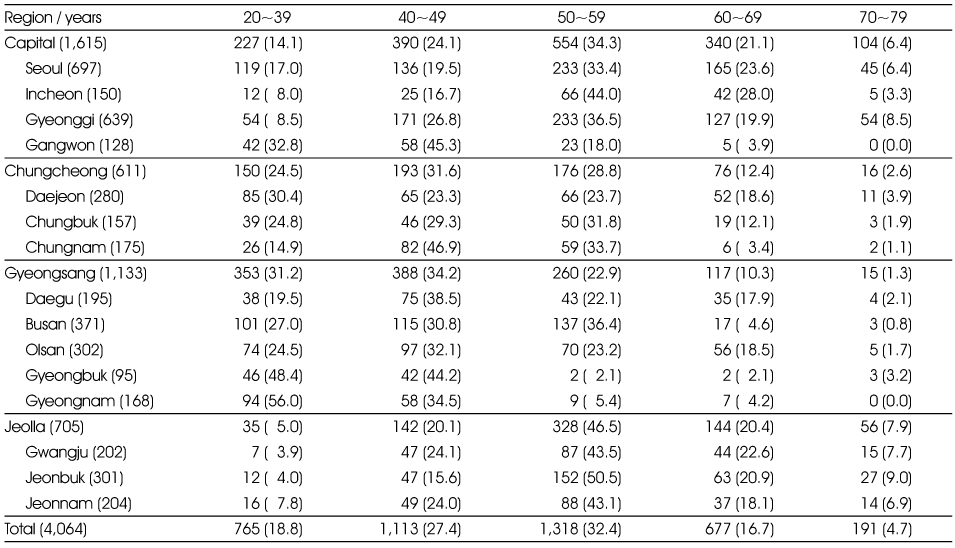
The distribution of the subjects by the region and by the age groups N (%)
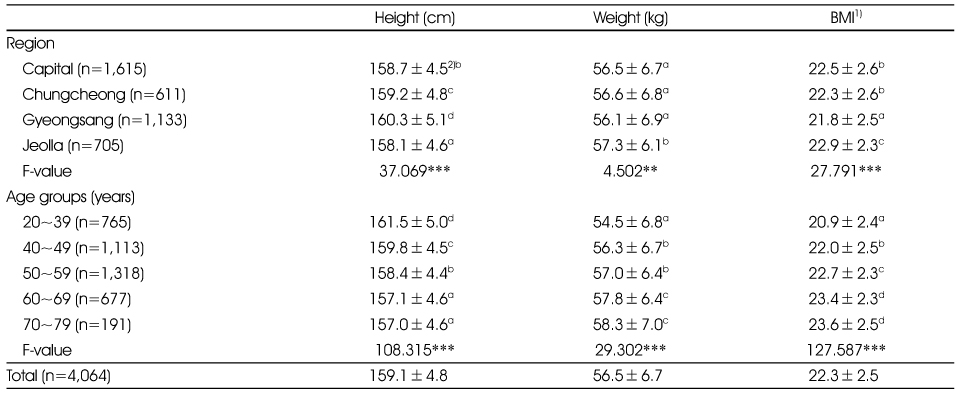
Comparison of anthropometric measurements by region and by age
1) Body Mass Index, weight (kg) / height (m2)
2) Mean±SD
**: p < 0.01, ***: p < 0.001
abc: Values with the different letter are significantly different among the groups by Duncan's multiple range test.
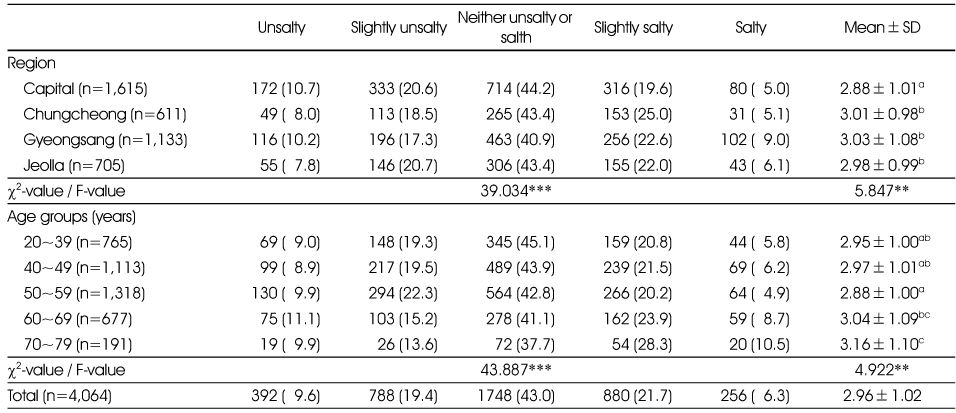
Comparison of the salty taste assessment by region and by age
**: p < 0.01, ***: p < 0.001
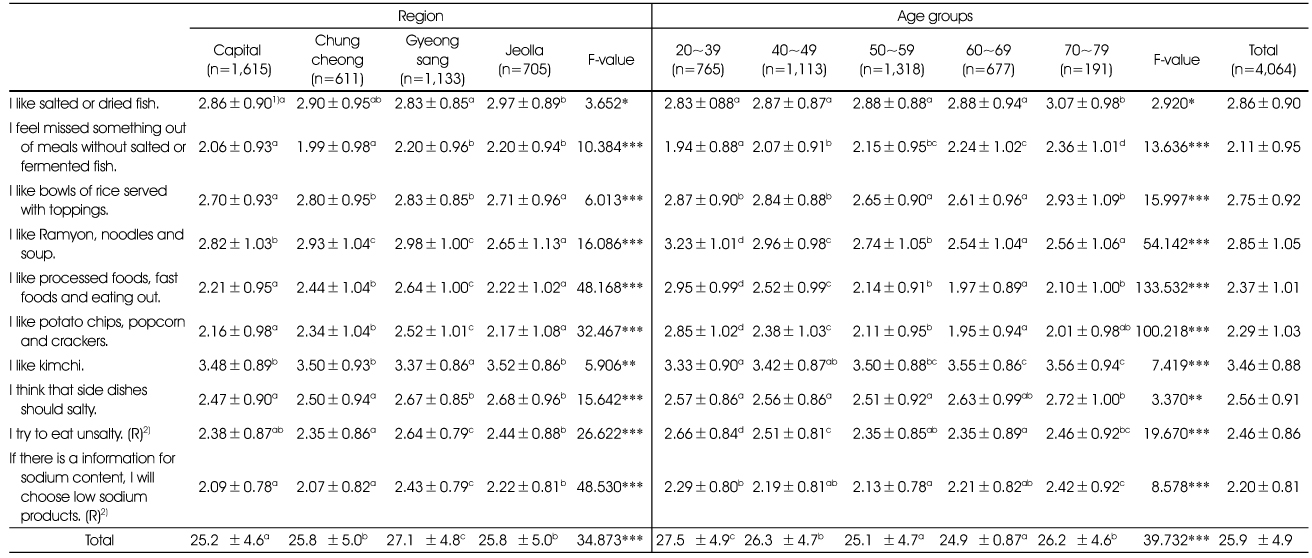
Comparison of high-salt dietary attitude by region and by age
1) Mean±SD
2) R denotes an reversely scored item.
*: p < 0.05, **: p < 0.01, ***: p < 0.001
abc: Values with the different letter are significantly different among 4 groups by Duncan's multiple range test at p < 0.001.
Comparison of high-salt dietary behaviors by region and by age
1) Mean±SD
2) R denotes an reversely scored item.
**: p < 0.01, ***: p < 0.001 by ANOVA
abc: Values with the different letter are significantly different among 4 groups by Duncan's multiple range test at p < 0.001.
Correlation coefficients of high-salt dietary attitude, high-salt dietary behaviors and self-awareness by salty taste assessment
**: p < 0.01, ***: p < 0.001
1) Body Mass Index, weight (kg) / height (m2) 2) Mean±SD **: p < 0.01, ***: p < 0.001 abc: Values with the different letter are significantly different among the groups by Duncan's multiple range test.
**: p < 0.01, ***: p < 0.001
1) Mean±SD 2) R denotes an reversely scored item. *: p < 0.05, **: p < 0.01, ***: p < 0.001 abc: Values with the different letter are significantly different among 4 groups by Duncan's multiple range test at p < 0.001.
1) Mean±SD 2) R denotes an reversely scored item. **: p < 0.01, ***: p < 0.001 by ANOVA abc: Values with the different letter are significantly different among 4 groups by Duncan's multiple range test at p < 0.001.
**: p < 0.01, ***: p < 0.001

 KSCN
KSCN
 PubReader
 Cite
Cite


