
Articles
- Page Path
- HOME > Korean J Community Nutr > Volume 28(3); 2023 > Article
-
Research Article
우리 국민의 나트륨 및 칼륨 섭취량 평가: 식품별 영양성분 함량 DB와 한국형 총 식이조사 기반 추정량 비교 연구 -
이지연1)
 , 권성옥2), 이수현3), 서민정4), 이계호5), 김초일6),†
 - Dietary sodium and potassium intake of Koreans estimated using 2 different sources of their contents in foods, Food & Nutrient Database and the Korean Total Diet Study : a comparative study
-
Jee Yeon Lee1), Sung Ok Kwon2), Soo Hyun Lee3), Min Jeong Seo4), Gae Ho Lee5), Cho-il Kim6),†
-
Korean Journal of Community Nutrition 2023;28(3):235-244.
DOI: https://doi.org/10.5720/kjcn.2023.28.3.235
Published online: June 30, 2023
1)한국보건산업진흥원 보건산업정책연구센터, 수석연구원
2)서울대학교 생활과학연구소, 연구부교수
3)공주대학교 의료정보학과, 교수
4)한국분석기술연구소, 분석팀장
5)한국분석기술연구소, 대표이사
6)서울대학교 생활과학대학 식품영양학과, 객원교수
1)Chief researcher, Center for Health Industry Policy, Korea Health Industry Development Institute, Cheongju, Korea
2)Research Associate Professor, Research Institute of Human Ecology, Seoul National University, Seoul, Korea
3)Professor, Department of Medical Record and Health Information Management, Kongju National University, Kongju, Korea
4)Team leader, Korea Research Institute of Analytical Technology, Daejeon, Korea
5)CEO, Korea Research Institute of Analytical Technology, Daejeon, Korea
6)Visiting Professor, Department of Food and Nutrition, Seoul National University, Seoul, Korea
- †Corresponding author Cho-il Kim Department of Food and Nutrition, Seoul National University, 1 Gwanak-ro, Gwanak-gu, Seoul 08826, Korea Tel: +82-2-880-9098 Fax: +82-2-884-0305 E-mail: kimchoil@snu.ac.kr
• Received: June 8, 2023 • Revised: June 16, 2023 • Accepted: June 23, 2023
© 2023 The Korean Society of Community Nutrition
This is an Open-Access article distributed under the terms of the Creative Commons Attribution Non-Commercial License (http://creativecommons.org/licenses/by-nc/4.0) which permits unrestricted non-commercial use, distribution, and reproduction in any medium, provided the original work is properly cited.
- 3,192 Views
- 77 Download
Abstract
-
Objectives
- Based on the results from the Korean Total Diet Study (KTDS), the sodium (Na) and potassium (K) intake of Koreans were estimated and compared with intake estimates from the Food & Nutrient Database (FNDB), as in the Korea National Health and Nutrition Examination Survey (KNHANES) to verify the validity of these estimates.
-
Methods
- One hundred and thirty-four representative foods (RFs) covering 92.5% of the total food intake of Koreans were selected, and 228 pairs of corresponding ‘RF x representative cooking method’ were derived by reflecting the methods used mainly in terms of frequency and quantity in their cooking. RF samples were collected from three cities with a larger population size in three regions (nine cities) nationwide, and six composite samples were made for each RF, considering its regional and/or seasonal characteristics. One thousand three hundred and sixty-eight ‘RF x representative cooking method’ pair samples were prepared, and the Na and K contents were assessed using inductively coupled plasma atomic emission spectrometry (ICP-MS). The Na and K intake of the Korean population was estimated by linking the content with the food intake data from the 7th KNHANES.
-
Results
- The mean Na and K intake of Koreans were 2,807.4 mg and 2,335.0 mg per person per day, respectively. A comparison with the Na and K intake from KNHANES, including only RFs of KTDS, showed comparable results with less than 5% variation. While the contribution and ranking of food items to Na intake were similar between KNHANES and KTDS, there were differences in K intake. This was attributed to the large discrepancies in the K content of rice and coffee between KTDS results and the values in the 9th Revision of the National Food Composition Table used in KNHANES.
-
Conclusions
- The Na and K intake of Koreans estimated based on the KTDS, which performed nutrient analysis on samples prepared to a ‘table-ready’ state using foods of the representative collection, was similar and comparable with that of KNHANES. This supports the validity and usefulness of FNDB-based nutrient intake estimation at the population level. The list of nutrients studied in KTDS is expected to be expanded, allowing for intake estimation of nutrients with currently insufficient or absent information in the FNDBs in use.
Introduction
Methods
1) 대표 식품 및 조리법 선정
2) 시료 수집 및 조제
Results
Discussion
Conclusion
-
Conflict of Interest
There are no financial or other issues that might lead to conflict of interest.
-
Funding
This study was supported by a grant (20220204691-00, Korean Total diet Study) from the Ministry of Food and Drug Safety in 2018-2022.
-
Data Availability
The authors confirm that the data supporting the findings of this study are available within the article and/or the official report submitted to the Ministry of Food & Drug Safety.
NOTES
Fig. 1.Percentage contribution to sodium intake by food group: KTDS and KNHANES. KTDS, Korean Total Diet Study; KNHANES, Korea National Health and Nutrition Examination Survey
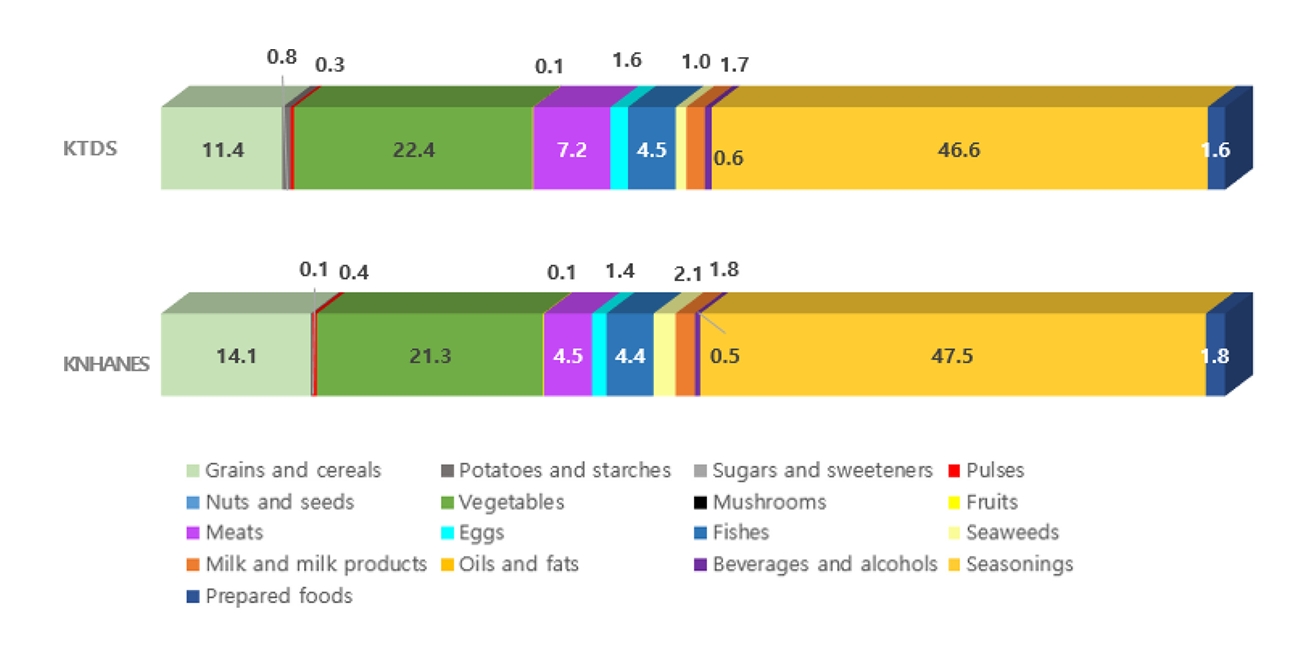
Fig. 2.Percentage contribution to potassium intake by food group: KTDS and KNHANES. KTDS, Korean Total Diet Study; KNHANES Korea National Health and Nutrition Examination Survey
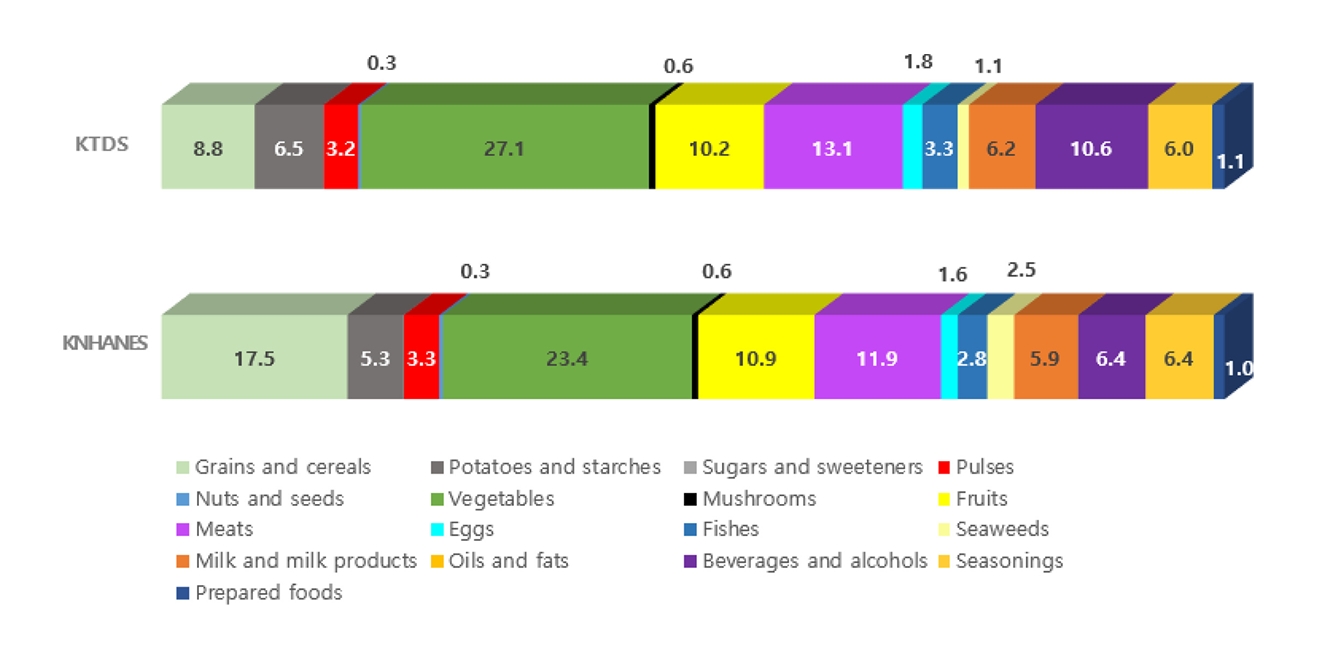
Table 1.Sodium and potassium content1) in foods by food group
Table 2.Comparison of daily sodium and potassium intake estimated by 2 methods: KTDS and Food & Nutrient Database from KNHANES
| Nutrient |
Estimated daily intake (mg/person/day)1) |
|||||
|---|---|---|---|---|---|---|
|
KTDS |
KNHANES |
|||||
| Mean | SE | Max | Mean | SE | Max | |
| Na | 2,807.4 | 20.2 | 41,562.0 | 2,940.8 | 20.6 | 41,108.1 |
| K | 2,335.0 | 13.6 | 25,015.7 | 2,434.0 | 13.9 | 23,355.0 |
Table 3.Top 10 sources of sodium (Na) intake at food item level: KTDS and KNHANES
| Rank |
KTDS |
KNHANES |
||||||
|---|---|---|---|---|---|---|---|---|
| Food1) | Sodium intake (mg/day) | Contribution (%) | Cumulative intake (%) | Food1) | Sodium intake (mg/day) | Contribution (%) | Cumulative intake (%) | |
| 1 | Salt | 599.8 | 21.4 | 21.4 | Salt | 618.4 | 21.0 | 21.0 |
| 2 | Kimchi, Chinese cabbage | 389.2 | 13.9 | 35.2 | Kimchi, Chinese cabbage | 396.2 | 13.5 | 34.5 |
| 3 | Soy sauce | 322.7 | 11.5 | 46.7 | Soy sauce | 319.1 | 10.9 | 45.3 |
| 4 | Fermented soybean paste | 162.3 | 5.8 | 52.5 | Fermented soybean paste | 177.2 | 6.0 | 51.4 |
| 5 | Instant noodles, Ramyeon | 150.9 | 5.4 | 57.9 | Fermented red pepper paste | 134.6 | 4.6 | 56.0 |
| 6 | Fermented red pepper paste | 102.4 | 3.6 | 61.5 | Instant noodles, Ramyeon | 124.8 | 4.2 | 60.2 |
| 7 | Chicken | 86.4 | 3.1 | 64.6 | Noodles | 106.9 | 3.6 | 63.8 |
| 8 | Breads, rolls, buns and others | 65.2 | 2.3 | 66.9 | Breads, rolls, buns and others | 67.6 | 2.3 | 66.1 |
| 9 | Egg | 46.1 | 1.6 | 68.6 | Seasoning powder | 60.4 | 2.1 | 68.2 |
| 10 | Fermented soybean paste mixed with red pepper paste | 46.1 | 1.6 | 70.2 | Fermented soybean paste mixed with red pepper paste | 53.6 | 1.8 | 70.0 |
Table 4.Top 10 sources of potassium (K) intake at food item level: KTDS and KNHANES
| Rank |
KTDS |
KNHANES |
||||||
|---|---|---|---|---|---|---|---|---|
| Food1) | Potassium intake (mg/day) | Contribution (%) | Cumulative intake (%) | Food1) | Potassium intake (mg/day) | Contribution (%) | Cumulative intake (%) | |
| 1 | Coffee | 217.8 | 9.3 | 9.3 | White rice | 241.8 | 9.9 | 9.9 |
| 2 | Kimchi, Chinese cabbage | 212.2 | 9.1 | 18.4 | Pork | 128.7 | 5.3 | 15.2 |
| 3 | Pork | 122.1 | 5.2 | 23.6 | Coffee | 124.5 | 5.1 | 20.3 |
| 4 | Milk | 108.0 | 4.6 | 28.3 | Kimchi, Chinese cabbage | 124.4 | 5.1 | 25.5 |
| 5 | Potato | 92.6 | 4.0 | 32.2 | Milk | 99.9 | 4.1 | 29.6 |
| 6 | Chicken | 85.4 | 3.7 | 35.9 | Chicken | 73.5 | 3.0 | 32.6 |
| 7 | White rice | 76.7 | 3.3 | 39.2 | Potato | 66.4 | 2.7 | 35.3 |
| 8 | Beef | 71.0 | 3.0 | 42.2 | Sweet potato | 62.2 | 2.6 | 37.9 |
| 9 | Sweet potato | 58.5 | 2.5 | 44.7 | Beef | 56.6 | 2.3 | 40.2 |
| 10 | Apple | 49.4 | 2.1 | 46.8 | Apple | 53.0 | 2.2 | 42.4 |
Table 5.Comparison of dietary sodium and potassium intake estimated in Total Diet Studies in some countries
| Country |
Estimated daily intake (mg/person/day) |
Reference | |
|---|---|---|---|
| Na | K | ||
| Korea1) | 2,807 | 2,335 | This study |
| Hong Kong | 2,600 | 1,900 | The 1st Hong Kong TDS: Minerals, 2014 [22] |
| Brazil2) | 1,928 | 861 | Avegliano et al., 2011 [21] |
| Iran | 2,846 | N/A | Babaali et al., 2020 [23] |
| New Zealand | 2,150-3,603 | N/A | Thomson et al., 2008 [24] |
| Australia | N/A | 2,960-4,440 | The 23rd ATDS, 2011 [27] |
| France | 2,653 | 2,854 | The 2nd French TDS, 2011 [25] |
| USA | 2,739 | 2,683 | Egan et al., 2002 [26] |
| Italy | 3,812 | 2,913 | Lombardi-Boccia et al., 2003 [20] |
- 1. Statistics Korea. Causes of Death Statistics in 2021 [internet]. Statistics Korea; 2022 [cited 2022 Sep. 27]. Available from: https://kostat.go.kr/
- 2. Kim HC, Ihm SH, Kim GH, Kim KI, Lee HY, Lee JH, et al. 2018 Korean Society of Hypertension guidelines for the management of hypertension: part I- epidemiology of hypertension. Clin Hypertens 2019; 25(1): 1-24.ArticlePubMedPMCPDF
- 3. Larson S, Cho MC, Tsioufis K, Yang E. 2018 Korean Society of Hypertension guidelines for the management of hypertension: A Comparison of American, European, and Korean Blood Pressure Guidelines. Eur Heart J 2020; 41(14): 1384-1386.PubMed
- 4. Korea Disease Control and Prevention Agency. Korea Health Statistics 2021: Korea National Health and Nutrition Examination Survey (KNHANES VIII-2). Cheongju: Korea Disease Control and Prevention Agency; 2022.
- 5. Lee HY, Shin J, Kim GH, Park S, Ihm SH, Kim HC, et al. 2018 Korean Society of Hypertension guidelines for the management of hypertension: part II- diagnosis and treatment of hypertension. Clin Hypertens 2019; 25: 1-24.ArticlePubMedPMCPDF
- 6. The Ministry of Health and Welfare. A study on the revision and application of 2020 Dietary Reference Intakes for Koreans. The Korean Nutrition Society; 2018 Nov. Report No. 11-1352000-002366-01.
- 7. Lee CH, Shin J. Effect of low sodium and high potassium diet on lowering blood pressure. J Korean Med Assoc 2022; 85(6): 368-376.ArticlePDF
- 8. Park HK, Lee Y, Kang BW, Kwon KI, Kim JW, Kwon OS, et al. Progress on sodium reduction in South Korea. BMJ Global Health 2020; 5: e002028.ArticlePubMedPMC
- 9. Korea Disease Control and Prevention Agency. Korean National Health and Nutrition Examination Survey [internet]. Korea Disease Control and Prevention Agency; 2020 [cited 2022 Feb 1]. Available from: https://knhanes.cdc.go.kr/knhanes
- 10. Rural Development Administration, National Rural Resources Development Institute (KR). 7th Revision food composition table. Wanju-gun, Jeollabuk-do: National Rural Resources Development Institute, R.D.A; 2006.
- 11. Rural Development Administration, National Rural Resources Development Institute (KR). 8th Revision standard food composition table. Wanju-gun, Jeollabuk-do: National Academy of Agricultural Science; 2011.
- 12. Rural Development Administration, National Rural Resources Development Institute (KR). Korean food composition table (9.3th revision). Wanju-gun, Jeollabuk-do: National Academy of Agricultural Science; 2021.
- 13. Kim CI, Lee JY, Kwon SO, Yeo YJ. Korean Total Diet Study. Cheongju: Ministry of Food and Drug Safety; 2018.
- 14. Lee JY, Yeo YJ, Seo MJ, Lee GH, Kim CI. Estimation of dietary iodine intake of Koreans through a Total Diet Study (TDS). Korean J Community Nutr 2021; 26(1): 48-55.ArticleLink
- 15. Lee JY, Kwon S, Seo MJ, Lee GH, Kim CI. Dietary iron intake of Koreans estimated using 2 different sources of iron contents are comparable: Food & Nutrient Database and iron contents of cooked foods in Korean Total Diet Study. Korean J Community Nutr 2022; 27(3): 245-253.ArticleLink
- 16. Korean Statistical Information Service. Population by census [Internet]; 2019 [cited 2020 Mar 2]. Available from: https://kosis.kr/statHtml/statHtml.do?orgId=101&tblId=DT_1B040A3
- 17. Ministry of Food and Drug Safety. Korean Food Standards Codex. Cheongju: Ministry of Food and Drug Safety; 2013. p. 55-59.
- 18. The Ministry of Health and Welfare, The Korean Nutrition Society. 2015 Dietary Reference Intakes for Koreans: Minerals Seoul. Seoul: The Korean Nutrition Society; 2015. p. 638-676.
- 19. Rural Development Administration, National Rural Resources Development Institute (KR). Korean food composition table (10th revision). Wanju-gun, Jeollabuk-do: National Academy of Agricultural Science; 2022.
- 20. Lombardi-Boccia G, Aguzzi A, Cappelloni M, Lullo GD, Lucarini M. Total-diet study: Dietary intakes of macro elements and trace elements in Italy. Br J Nutr 2003; 90(6): 1117-1121.ArticlePubMed
- 21. Avegliano RP, Maihara VA, da Silva FF. A Brazilian Total Diet Study: Evaluation of essential elements. J Food Compos Anal 2011; 24(7): 1009-1016.Article
- 22. The Government of the Hong Kong Special Administrative Region. The First Hong Kong Total Diet Study: Minerals. Hong Kong: The Government of the Hong Kong Special Administrative Region; 2014.
- 23. Babaali E, Rahmdel S, Berizi E, Akhlaghi M, Gotz F, Mazloomi SM. Dietary intakes of Zinc, Copper, Magnesium, Calcium, Phosphorus, and Sodium by the general adult population aged 20-50 years in Shiraz, Iran: A Total Diet Study Approach. Nutrients 2020; 12(11): 3370.ArticlePubMedPMC
- 24. Thomson BM, Vannoort RW, Haslemore RM. Total-diet study: Dietary exposure and trends of exposure to nutrient elements iodine, iron, selenium and sodium from the 2003-4 New Zealand Total Diet Survey. Br J Nutr 2008; 99(3): 614-625.ArticlePubMed
- 25. French agency for food, environmental and occupational Health & Safety. Second French Total Diet Study (TDS2) Report1-inorganic contaminants, minerals, persistent organic pollutants, mycotoxins and phytoestrogens. Bialec; 2011 Jun. Report No. 76441.
- 26. Egan SK, Tao SS-H, Pennington JAT, Bolger PM. US Food and Drug Administration's Total Diet Study: Intake of nutritional and toxic elements 1991-96. Food Addit Contam 2002; 19(2): 103-125.ArticlePubMed
- 27. Food Standards Australia New Zealand. The 23rd Australian Total Diet Study. Wellington: Food Standards Australia New Zealand; 2011.
- 28. Ministry of Education, Science and Technology. Standard tables of food composition in Japan 2015 (Seventh Revised Edition) [internet]. Ministry of Education, Culture, Sports, Science and Technology; 2015 [cited 2016 Feb 3]. Available from: http://www.MEXT.go.jp/
- 29. Kimura M, Itokawa Y. Cooking losses of minerals in foods and its nutritional significance. J Nutr Sci Viaminol 1990; 36: s25-s33.Article
REFERENCES
Figure & Data
REFERENCES
Citations
Citations to this article as recorded by 
 Cite
CiteDietary sodium and potassium intake of Koreans estimated using 2 different sources of their contents in foods, Food & Nutrient Database and the Korean Total Diet Study : a comparative study


Fig. 1. Percentage contribution to sodium intake by food group: KTDS and KNHANES. KTDS, Korean Total Diet Study; KNHANES, Korea National Health and Nutrition Examination Survey
Fig. 2. Percentage contribution to potassium intake by food group: KTDS and KNHANES. KTDS, Korean Total Diet Study; KNHANES Korea National Health and Nutrition Examination Survey
Fig. 1.
Fig. 2.
Dietary sodium and potassium intake of Koreans estimated using 2 different sources of their contents in foods, Food & Nutrient Database and the Korean Total Diet Study : a comparative study
| Food group | No. of foods | No. of samples | Na (mg/100 g) |
K (mg/100 g) |
|||
|---|---|---|---|---|---|---|---|
| Mean | SD | Mean | SD | ||||
| 1 | Grains and cereals | 18 | 144 | 208.7 | 249.7 | 126.9 | 61.3 |
| 2 | Potatoes and starches | 3 | 36 | 66.8 | 135.6 | 306.0 | 229.4 |
| 3 | Sugars and sweeteners | 2 | 30 | 2.3 | 1.6 | 20.1 | 20.8 |
| 4 | Pulses | 3 | 24 | 22.4 | 28.9 | 425.8 | 523.6 |
| 5 | Nuts and seeds | 2 | 18 | 4.2 | 0.6 | 402.2 | 17.8 |
| 6 | Vegetables | 30 | 312 | 126.5 | 223.1 | 223.4 | 115.1 |
| 7 | Mushrooms | 3 | 42 | 4.3 | 1.4 | 264.1 | 32.5 |
| 8 | Fruits | 12 | 72 | 1.2 | 1.0 | 158.4 | 58.5 |
| 9 | Meats | 8 | 132 | 319.1 | 251.8 | 220.1 | 64.5 |
| 10 | Eggs | 1 | 18 | 147.5 | 8.7 | 137.8 | 4.4 |
| 11 | Fishes | 13 | 186 | 417.9 | 474.1 | 257.5 | 185.5 |
| 12 | Seaweeds | 2 | 24 | 1,719.1 | 905.7 | 1,069.1 | 903.4 |
| 13 | Milk and milk products | 6 | 42 | 210.4 | 298.6 | 109.1 | 35.1 |
| 14 | Oils and fats | 4 | 42 | 5.0 | 11.1 | 178.2 | 431.6 |
| 15 | Beverages and alcohols | 14 | 84 | 14.7 | 24.9 | 193.4 | 657.1 |
| 16 | Seasonings | 11 | 138 | 4,991.5 | 9,184.2 | 663.6 | 671.3 |
| 17 | Prepared foods | 2 | 24 | 362.4 | 44.0 | 226.3 | 39.6 |
| Total | 134 | 1,368 | |||||
| Nutrient | Estimated daily intake (mg/person/day) |
|||||
|---|---|---|---|---|---|---|
| KTDS |
KNHANES |
|||||
| Mean | SE | Max | Mean | SE | Max | |
| Na | 2,807.4 | 20.2 | 41,562.0 | 2,940.8 | 20.6 | 41,108.1 |
| K | 2,335.0 | 13.6 | 25,015.7 | 2,434.0 | 13.9 | 23,355.0 |
| Rank | KTDS |
KNHANES |
||||||
|---|---|---|---|---|---|---|---|---|
| Food |
Sodium intake (mg/day) | Contribution (%) | Cumulative intake (%) | Food |
Sodium intake (mg/day) | Contribution (%) | Cumulative intake (%) | |
| 1 | Salt | 599.8 | 21.4 | 21.4 | Salt | 618.4 | 21.0 | 21.0 |
| 2 | Kimchi, Chinese cabbage | 389.2 | 13.9 | 35.2 | Kimchi, Chinese cabbage | 396.2 | 13.5 | 34.5 |
| 3 | Soy sauce | 322.7 | 11.5 | 46.7 | Soy sauce | 319.1 | 10.9 | 45.3 |
| 4 | Fermented soybean paste | 162.3 | 5.8 | 52.5 | Fermented soybean paste | 177.2 | 6.0 | 51.4 |
| 5 | Instant noodles, Ramyeon | 150.9 | 5.4 | 57.9 | Fermented red pepper paste | 134.6 | 4.6 | 56.0 |
| 6 | Fermented red pepper paste | 102.4 | 3.6 | 61.5 | Instant noodles, Ramyeon | 124.8 | 4.2 | 60.2 |
| 7 | Chicken | 86.4 | 3.1 | 64.6 | Noodles | 106.9 | 3.6 | 63.8 |
| 8 | Breads, rolls, buns and others | 65.2 | 2.3 | 66.9 | Breads, rolls, buns and others | 67.6 | 2.3 | 66.1 |
| 9 | Egg | 46.1 | 1.6 | 68.6 | Seasoning powder | 60.4 | 2.1 | 68.2 |
| 10 | Fermented soybean paste mixed with red pepper paste | 46.1 | 1.6 | 70.2 | Fermented soybean paste mixed with red pepper paste | 53.6 | 1.8 | 70.0 |
| Rank | KTDS |
KNHANES |
||||||
|---|---|---|---|---|---|---|---|---|
| Food |
Potassium intake (mg/day) | Contribution (%) | Cumulative intake (%) | Food |
Potassium intake (mg/day) | Contribution (%) | Cumulative intake (%) | |
| 1 | Coffee | 217.8 | 9.3 | 9.3 | White rice | 241.8 | 9.9 | 9.9 |
| 2 | Kimchi, Chinese cabbage | 212.2 | 9.1 | 18.4 | Pork | 128.7 | 5.3 | 15.2 |
| 3 | Pork | 122.1 | 5.2 | 23.6 | Coffee | 124.5 | 5.1 | 20.3 |
| 4 | Milk | 108.0 | 4.6 | 28.3 | Kimchi, Chinese cabbage | 124.4 | 5.1 | 25.5 |
| 5 | Potato | 92.6 | 4.0 | 32.2 | Milk | 99.9 | 4.1 | 29.6 |
| 6 | Chicken | 85.4 | 3.7 | 35.9 | Chicken | 73.5 | 3.0 | 32.6 |
| 7 | White rice | 76.7 | 3.3 | 39.2 | Potato | 66.4 | 2.7 | 35.3 |
| 8 | Beef | 71.0 | 3.0 | 42.2 | Sweet potato | 62.2 | 2.6 | 37.9 |
| 9 | Sweet potato | 58.5 | 2.5 | 44.7 | Beef | 56.6 | 2.3 | 40.2 |
| 10 | Apple | 49.4 | 2.1 | 46.8 | Apple | 53.0 | 2.2 | 42.4 |
| Country | Estimated daily intake (mg/person/day) |
Reference | |
|---|---|---|---|
| Na | K | ||
| Korea |
2,807 | 2,335 | This study |
| Hong Kong | 2,600 | 1,900 | The 1st Hong Kong TDS: Minerals, 2014 [22] |
| Brazil |
1,928 | 861 | Avegliano et al., 2011 [21] |
| Iran | 2,846 | N/A | Babaali et al., 2020 [23] |
| New Zealand | 2,150-3,603 | N/A | Thomson et al., 2008 [24] |
| Australia | N/A | 2,960-4,440 | The 23rd ATDS, 2011 [27] |
| France | 2,653 | 2,854 | The 2nd French TDS, 2011 [25] |
| USA | 2,739 | 2,683 | Egan et al., 2002 [26] |
| Italy | 3,812 | 2,913 | Lombardi-Boccia et al., 2003 [20] |
Table 1. Sodium and potassium content1) in foods by food group
The results are based on the nutrient content of food samples processed in the Korean Total Diet Study. Na, sodium; K, potassium
Table 2. Comparison of daily sodium and potassium intake estimated by 2 methods: KTDS and Food & Nutrient Database from KNHANES
Dietary intakes of sodium & potassium were estimated based on the representative foods intake accounting for 92.5% of total food intake. KTDS, Korean Total Diet Study; KNHANES, Korea National Health and Nutrition Examination Survey; Na, sodium; K, potassium
Table 3. Top 10 sources of sodium (Na) intake at food item level: KTDS and KNHANES
Foods were selected at the tertiary food code level. KTDS, Korean Total Diet Study; KNHANES, Korea National Health and Nutrition Examination Survey
Table 4. Top 10 sources of potassium (K) intake at food item level: KTDS and KNHANES
Foods were selected at the tertiary food code level. KTDS, Korean Total Diet Study; KNHANES, Korea National Health and Nutrition Examination Survey
Table 5. Comparison of dietary sodium and potassium intake estimated in Total Diet Studies in some countries
Dietary intake of nutrient was estimated based on the representative food intake accounting for 92.5% of total food intake. Dietary intake of nutrient was estimated based on the representative food intake accounting for 72.0% of total food intake. Na, sodium; K, potassium; N/A, not available


