Articles
- Page Path
- HOME > Korean J Community Nutr > Volume 17(5); 2012 > Article
-
Original Article
- Measurements of Salinity and Salt Content by Menu Types Served at Industry Foodservice Operations in Daegu
- Ji-Ae Kim, Yun-Hwa Kim, Moon-Young Ann, Yeon-Kyung Lee
-
Korean Journal of Community Nutrition 2012;17(5):637-651.
DOI: https://doi.org/10.5720/kjcn.2012.17.5.637
Published online: October 31, 2012
Department of Food Science and Nutrition, Kyungpook National University, Daegu, Korea.
1Daegu Medical Center, Daegu, Korea.
- Corresponding author: Yeon-Kyung Lee, Department of Food Science and Nutrition, Kyungpook National University, 80 Daehakro, Bukgu, Daegu 702-701, Korea. Tel: (053) 950-6234, Fax: (053) 950-6229, yklee@knu.ac.kr
Copyright © 2012 The Korean Society of Community Nutrition
- 140 Views
- 1 Download
- 16 Crossref
Abstract
- The purpose of this study was to investigate salinity and sodium content in foods served at industry foodservice operations in selected workplaces in Daegu. The researcher collected 1,142 food items categorized into 22 menu item groups from lunch samples served at 100 industry foodservice operations and measured the salinity of the food items, and calculated sodium and salt contents from the salinity. In terms of salt content of one meal at each workplace, 46% of the meals were 3-<5 g, and only 3.0% of them were 1.7 g or less, which is one third of the daily target intake (5 g) presented by the Dietary Reference Intakes for Koreans. In terms of sodium content, 35.3% of the meals were 1,000-< 1,500 mg (most), and only 2.5% of them were 667 mg or less, which is, again, one third of the daily target intake. As to the salinity of each menu item group, side dishes such as sauces, kimchi, seasoned vegetables, hard-boiled foods, and stir-fried foods were significantly higher, but the sodium content was not higher, because their quantity per serving was small. The salinity of foods with liquid such as stews, noodles, soups, and broths was relatively lower, but the sodium content was higher, because their quantity per serving was large. This indicates that an education program should be developed for foodservice workers who prepare food for the workplace regarding the development and promotion of various menus for reducing sodium content, in order to reduce sodium content in meals served by food service in the workplace.
- 1. Cho YY. Practice guidelines for reducing salt intake. Korean J Community Nutr. 2002; 7(3): 394-400.
- 2. Chobanian AV, Hill M. National heart, lung, and blood institute workshop on sodium and blood pressure. A critical review of current scientific evidence. Hypertension. 2000; 35(4): 858-863.ArticlePubMed
- 3. Cook NR, Cohen J, Hebert PR, Taylor JO, Hennekens CH. Implications of small reduction in diastolic blood pressure for primary prevention. Arch Intern Med. 1995; 155(7): 701-709.ArticlePubMed
- 4. Fregly MJ. Estimates of sodium and potassium intake. Ann Intern Med. 1983; 98(5 Pt 2): 792-799.ArticlePubMed
- 5. Hall JE. The kidney, hypertension, and obesity. Hypertension. 2003; 41(3): 625-633.ArticlePubMed
- 6. He FJ, MacGregor GA. Effect of modest salt reduction on blood pressure: a meta-analysis of randomized trials: implications for pubic health. J Hum Hypertens. 2002; 16(11): 761-770.ArticlePubMedPDF
- 7. Kim JH, Choi MK. Salt intake behavior and blood pressure: the effect of taste sensitivity and preference. J Korean Living Sci Assoc. 2007; 16(4): 837-848.Article
- 8. Kim KS, Shin DC, Lee SJ, Kim HK. A study on salt intake and urinary sodium excretion by groups educated regarding low salt diet. Korean J Nutr. 1980; 13(4): 187-194.
- 9. Kim HH, Jung YY, Lee YK. A comparison of salty taste assessments and dietary attitudes and dietary behaviors associated with high-salt diets in four regions in Korea. Korean J Community Nutr. 2012; 17(1): 38-48.Article
- 10. Kim YS, Paik HY. Measurement of na intake in Korean adult females. Korean J Nutr. 1987; 20(5): 341-349.
- 11. Korea Food & Drug Administration. 2011 Food & drug statistical yearbook. 2011.
- 12. Kumanyika SK. Long term effects of dietary sodium reduction on cardiovascular disease outcomes: observational follow-up of the trials of hypertension prevention (TOHP). BMJ. 2007; 334(7599): 885-893.ArticlePubMedPMC
- 13. Lee HJ, Lee CH, Lee KS, Jung YG, Ha SH, Jung YY, Kim DS. Survey on sodium contents in meals of school foodservice and sodium intakes of students in Busan and Gyeongsangbuk-do. J Korean Soc Food Sci Nutr. 2010; 39(1): 85-91.Article
- 14. Lee HS. Studies on salt intake through eat-out foods in Andong area. Korean J Soc Food Sci. 1997; 13(3): 56-60.
- 15. Lee YK, Lim HS, Jeon SH, Kim YG, Shin DS, Ko YS, Chung HJ, Heo YR, Chae IS. Determination of sugar and sodium intakes of school children by analysis of sugar and sodium contents in school foodservice in the Daegu/Gyeongnam and Gwangju/Jeju are. The report of National Institute of Food and Drug Safety Evaluation. 2009.
- 16. Meneton P, Jeunemaitre X, Wardener HE, Mac Gregor GA. Links between dietary salt intake, renal salt handling, blood pressure, and cardiovascular diseases. Physiol Rev. 2005; 85(2): 679-715.ArticlePubMed
- 17. Ministry of Health & Welfare. Korea Center for Disease Control and Preventic. Korea Health Statistics 2008: Korea National Health and Nutrition Examination Survey (KNHANESIV-2). 2009.
- 18. Ministry of Health & Welfare. Korea Center for Disease Control and Preventic. Korea Health Statistics 2010: Korea National Health and Nutrition Examination Survey (KNHANESV-1). 2011.
- 19. Moon GS, Song YS, Lee CG, Kim SK, Ryu BM, Jeon YS. The study on the salinity of kimchi and subjective perception of salinity in Pusan area. Korean J Soc Food Sci. 1997; 13(2): 179-184.
- 20. Moon HK, Choi SO, Kim JE. Dishes contributing to sodium intake of elderly living in rural areas. Korean J Community Nutr. 2009; 14(1): 123-136.
- 21. Park MJ. Analysis of salt content in the foods of a industry foodservice operation and eat-out restaurants in the Daegu area, and development plan for a low-sodium diet. 2007; Kyungpook National University; 16-35 MS thesis.
- 22. Seo HY, Jung BM. Comparison of foodservice management practices in the employee feeding operations of Jeonnam and Chungchong area. Korean J Community Nutr. 2004; 9(2): 191-203.
- 23. Shin EK. Development and evaluation of a nutrition education program for sodium reduction based on analysis of sodium intake. 2008; Kyungpook National University; 15-31 Dissertation.
- 24. Son SM, Huh GY. Salt intake and nutritional problems in Korean. Korean J Community Nutr. 2002; 7(3): 381-390.
- 25. Son SM, Huh GY. Dietary risk factors associated with hypertension in patients. Korean J Community Nutr. 2006; 11(5): 661-672.
- 26. Son SM, Park YS, Lim HJ, Kim SB, Jeong YS. Sodium intakes of Korean adults with 24-hour urine analysis and dish frequency questionnaire and comparison of sodium intakes according to the regional area and dish group. Korean J Community Nutr. 2007; 12(5): 545-558.
- 27. Song MR, Lee KJ. Salinity and consumption patterns of kimchi and soup·stew in Jeonju area. Korean J Food Cookery Sci. 2008; 24(1): 84-91.
- 28. The Korea Nutrition Society. Dietary reference intakes for Koreans. 2010.
- 29. Tsugane S. Salt, salted food intake, and risk of gastric cancer: epidemiologic evidence. Cancer Sci. 2005; 96(1): 1-6.ArticlePubMedPMC
- 30. de Wardener HE, MacGregor GA. Harmful effects of dietary salt in addition to hypertension. J Hum Hypertens. 2002; 16(4): 213-223.ArticlePubMedPDF
- 31. World Health Organization. Reducing salt intake in populations. 2006.
- 32. World Health Organization. Primary prevention of essential hypertension: report of a WHO scientific group. 1983; Geneva: World Health Organization.
- 33. World Health Organization. Diet, nutrition and the prevention of chronic disease. Report of a Joint WHO/FAO Expert Consultation. 2003; Geneva: World Health Organization.
REFERENCES
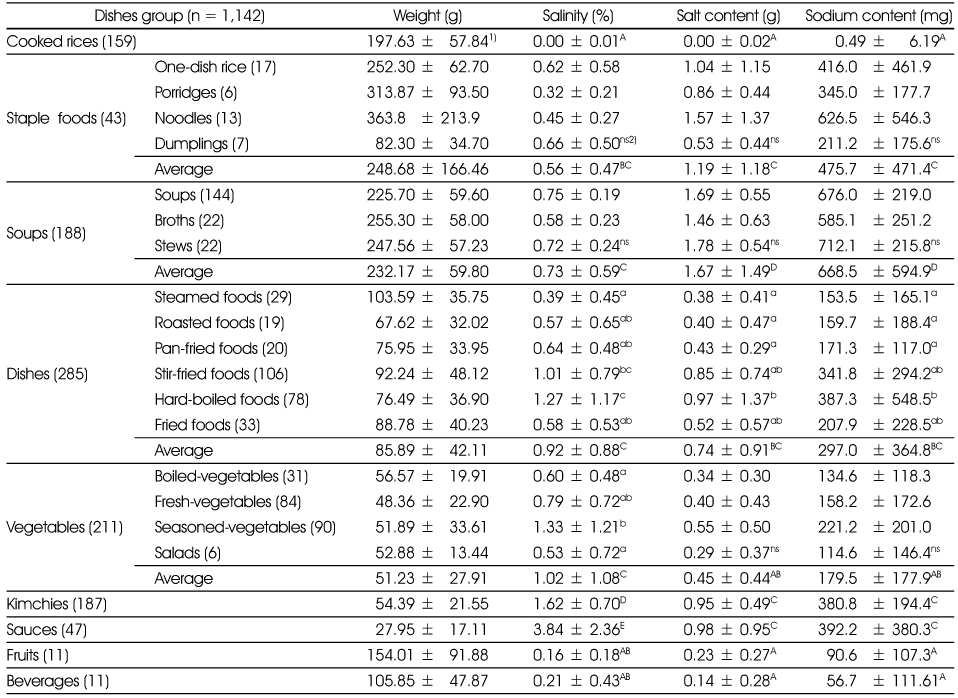
1) Mean ± SD, 2) NS: not significant
Means in the same column bearing different capital letters are significantly different among menu types by Duncan's multiple range test at p < 0.05.
Means in the same column bearing different small letters are significantly different within menu types by Duncan's multiple range test at p < 0.05.
Figure & Data
REFERENCES
Citations

- Ingredient and Salinity Variations in Doenjang Stews Sold in a College Town and Consumer Acceptance of Doenjang Stews among Korean College Students
Ji-Sun Hwang, Mina K. Kim
Preventive Nutrition and Food Science.2022; 27(1): 121. CrossRef - How important is human service for sustainable restaurant businesses?
Ha-Won Jang
Journal of Hospitality and Tourism Management.2021; 48: 406. CrossRef - Comparison of Salinity and Sodium Content by the Salinity Measurement Frequency of Soups of Childcare Centers Enrolled in the Center for Children's Food Service Management in Daegu
Na-Yeong Lee, Yeon-Kyung Lee
Korean Journal of Community Nutrition.2020; 25(1): 13. CrossRef - Development of standards for reducing the sodium content and salinity of Korean fermented soybean sauces and representative Korean foods high in sodium
Lin Jiang, Eun-Kyung Shin, Jung-Sook Seo, Yeon-Kyung Lee
Journal of Nutrition and Health.2019; 52(2): 185. CrossRef - The impact of vegan production on the kimchi microbiome
Michelle A. Zabat, William H. Sano, Damien J. Cabral, Jenna I. Wurster, Peter Belenky
Food Microbiology.2018; 74: 171. CrossRef - Salinity of Representative Korean Foods High in Sodium from Home Meals, Foodservices, and Restaurants
Lin Jiang, Damin Shin, Yeon-Kyung Lee
Korean Journal of Community Nutrition.2018; 23(4): 333. CrossRef - Study on Sodium Contents of Kindergarten Lunch Meals in Gyeoungsangbuk-do Area
Dan-Bi Song, Kyung-A Lee
Korean Journal of Food & Cookery Science.2016; 32(5): 648. CrossRef - Study on the Salt and Sodium Content of Middle School Lunch Meals in Gyeongsangbuk-do Area - Focus on Application of 'SamSam Foodservice' -
So-Young Park, Kyung-A Lee
Journal of the Korean Society of Food Science and Nutrition.2016; 45(5): 757. CrossRef - School Dietitian Awareness, Practice, and Sodium Reduction Plan in School Meal Service
Eun Kyung Kim, Hae Young Kim
Korean Journal of Food & Cookery Science.2016; 32(2): 222. CrossRef - Differences in Sodium-Intake Related Dietary Behaviors and Correlation Analysis According to Salty Taste Preference of University Students in Busan Area
Min-Ji Kang, Ki-Bo Choi, Eun-Soon Lyu
Korean journal of food and cookery science.2015; 31(4): 477. CrossRef - Sensory characteristics of Step-by-Step Sodium Reduction on Frequently used High Sodium Foods in the Institutional Food Service Industry
Soon-Bok Kwon, Hae-Young Kim
Korean journal of food and cookery science.2015; 31(4): 465. CrossRef - Perception of Foodservice Quality Satisfaction by Using Attitude in Company Cafeteria - Focused on Daejon Area -
Sung-Hwan Kim, Na-Young Kim
The Korean Journal of Food And Nutrition.2015; 28(1): 94. CrossRef - Nutrition knowledge, eating attitudes, nutrition behavior, self-efficacy of childcare center foodservice employees by stages of behavioral change in reducing sodium intake
Yun Ahn, Kyung Won Kim, Kyungmin Kim, Jinwon Pyun, Ikhyun Yeo, Kisun Nam
Journal of Nutrition and Health.2015; 48(5): 429. CrossRef - Consumer Awareness and Interest Toward Sodium Reduction Trends in Korea
Mina K. Kim, Kwang‐Geun Lee
Journal of Food Science.2014;[Epub] CrossRef - Sodium Content and Nutrients Supply from Free Lunch Meals Served by Welfare Facilities for the Elderly in Gyeonggi-do
Seoyun Park, So Hyun Ahn, Jin Nam Kim, Hye-Kyeong Kim
The Korean Journal of Food And Nutrition.2013; 26(3): 459. CrossRef - A Survey on the Salt Content of Kindergarten Lunch Meals and Meal Providers' Dietary Attitude to Sodium Intake in Gyeonggi-do Area
Jin Nam Kim, Seoyun Park, Sohyun Ahn, Hye-Kyeong Kim
Korean Journal of Community Nutrition.2013; 18(5): 478. CrossRef
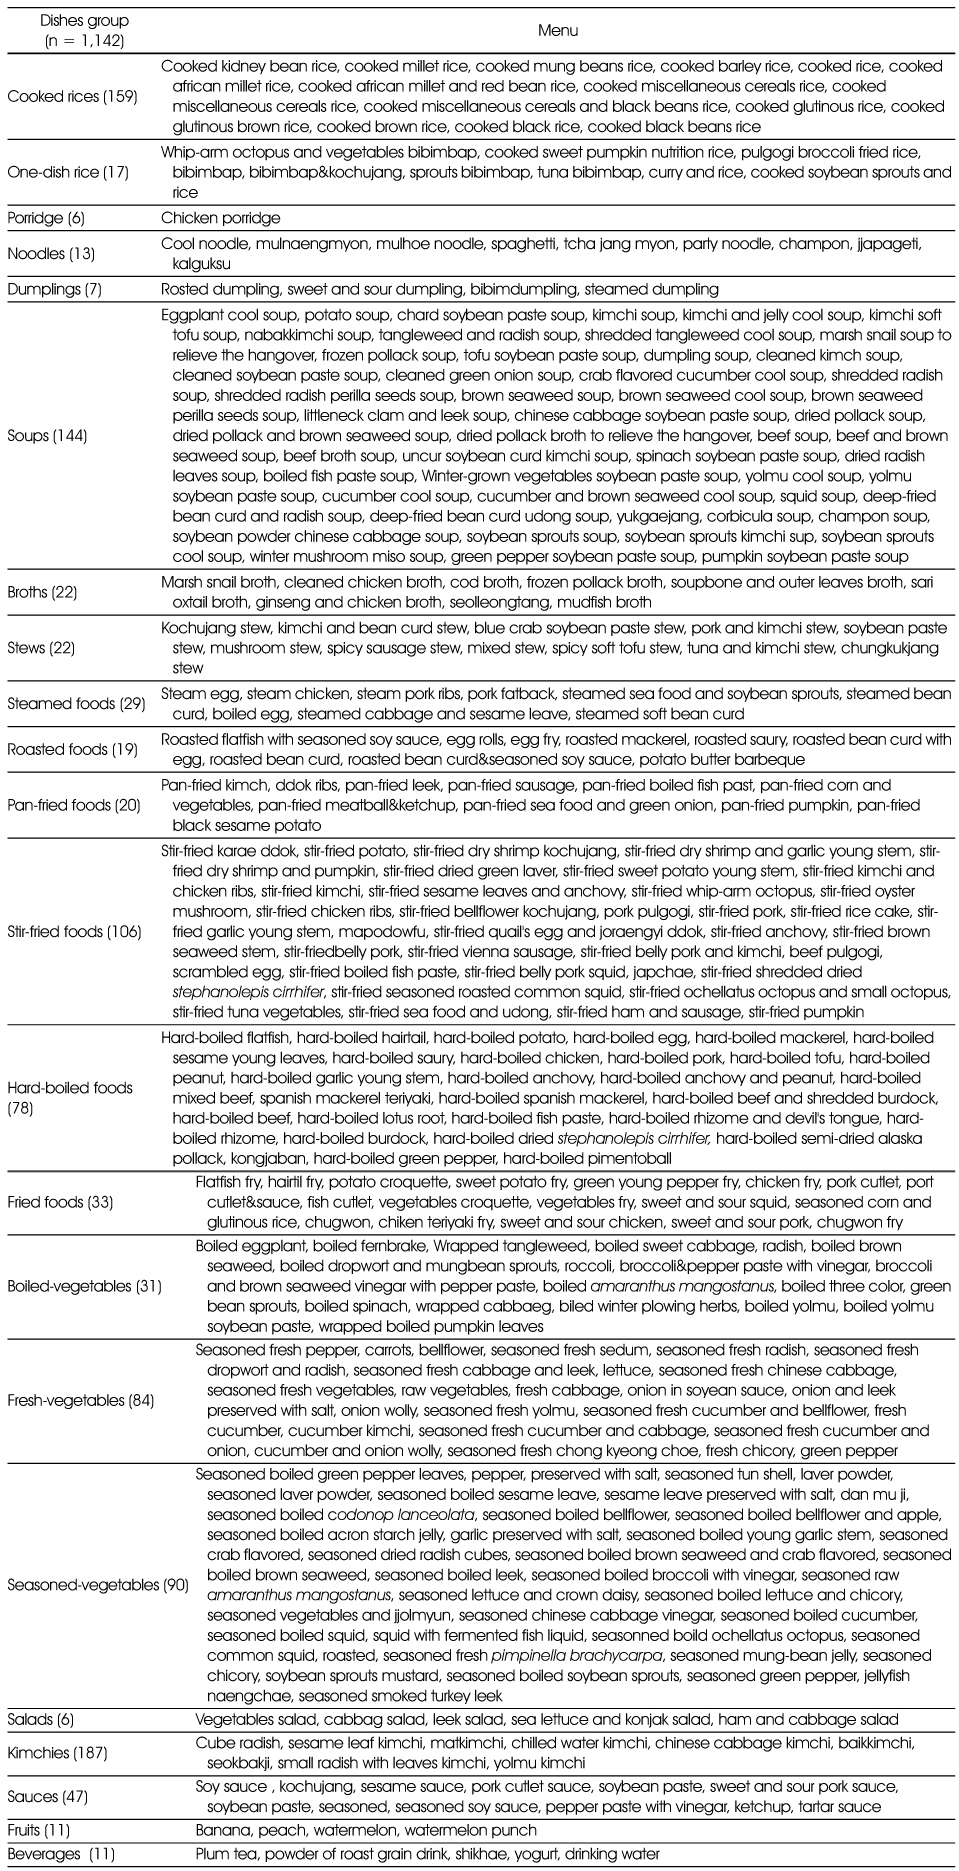
Lunch menus served by industry foodservise operations in Daegu
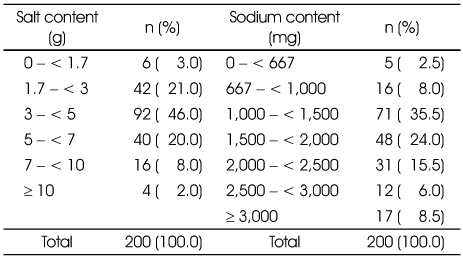
The salt and sodium contents in lunches served at industry foodservice operations in Daegu
The salinity and salt content of the dishes groups served at industry foodservice operations
1) Mean ± SD, 2) NS: not significant
Means in the same column bearing different capital letters are significantly different among menu types by Duncan's multiple range test at p < 0.05.
Means in the same column bearing different small letters are significantly different within menu types by Duncan's multiple range test at p < 0.05.
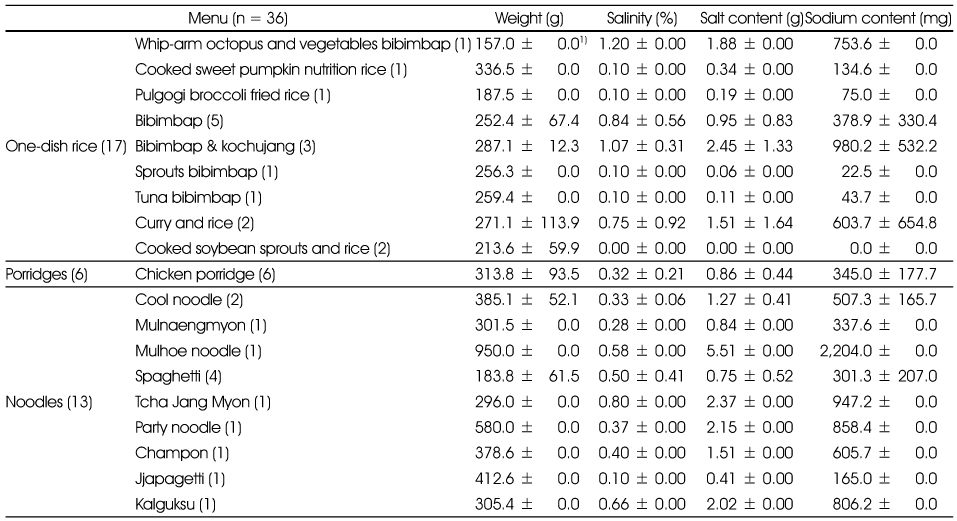
The salinity and salt content of one-dish rice, porridges, noodles per serving
1) Mean ± SD
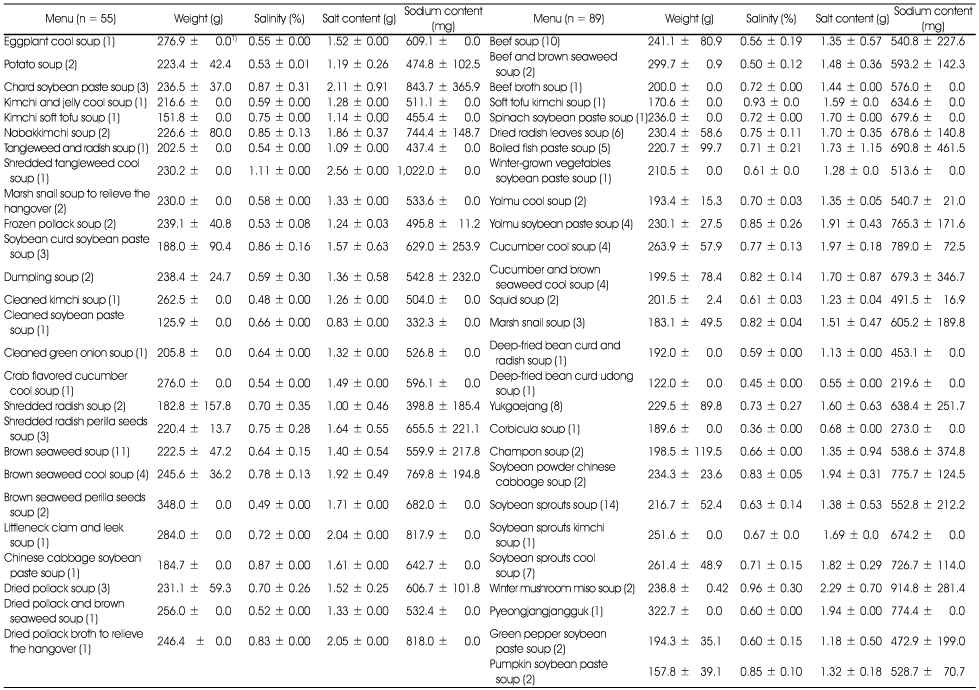
The salinity and salt content of soups per serving
1) Mean ± SD
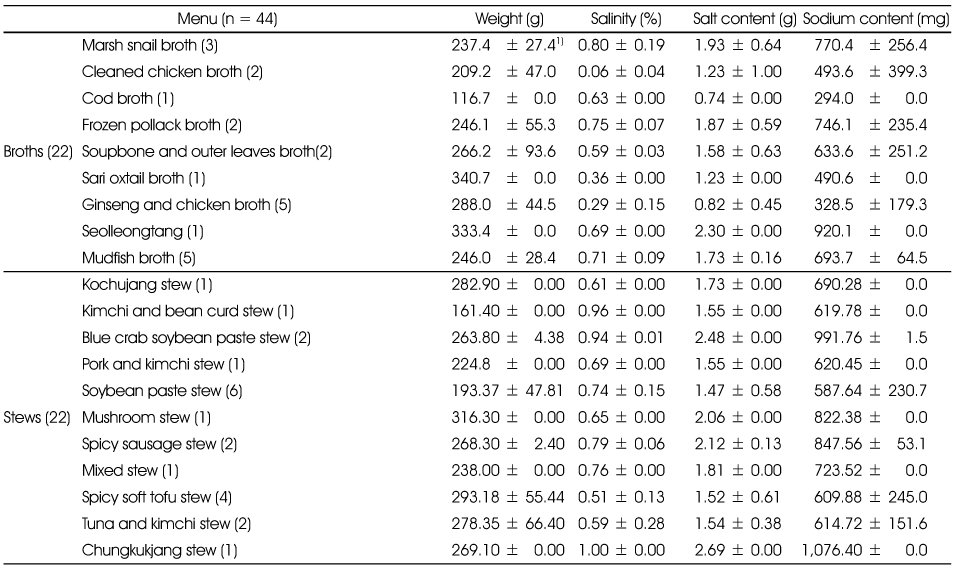
The salinity and salt content of broths and stews per serving
1) Mean ± SD
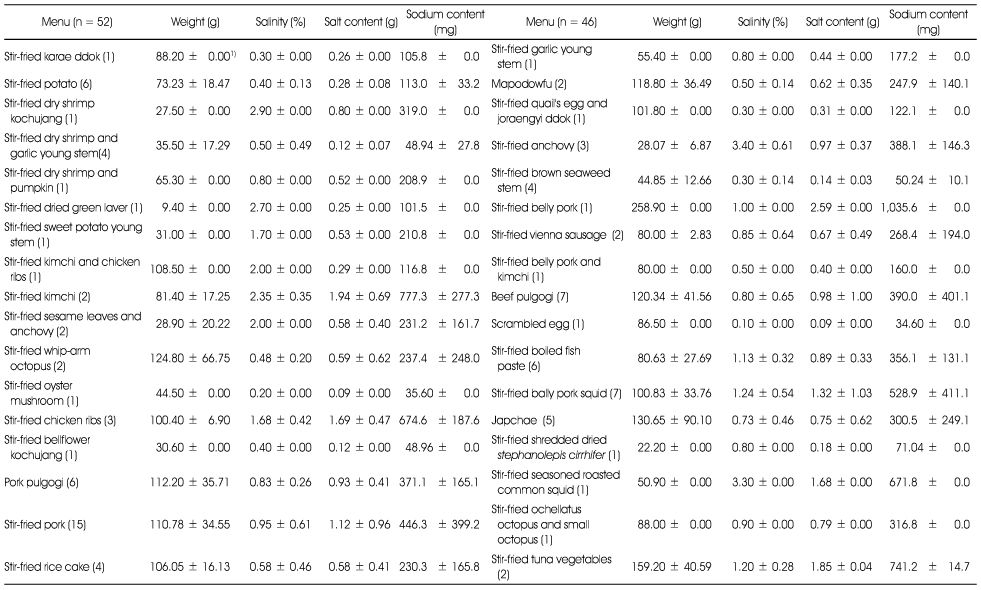
The salinity and salt content of stir-fried foods per serving
1) Mean ± SD
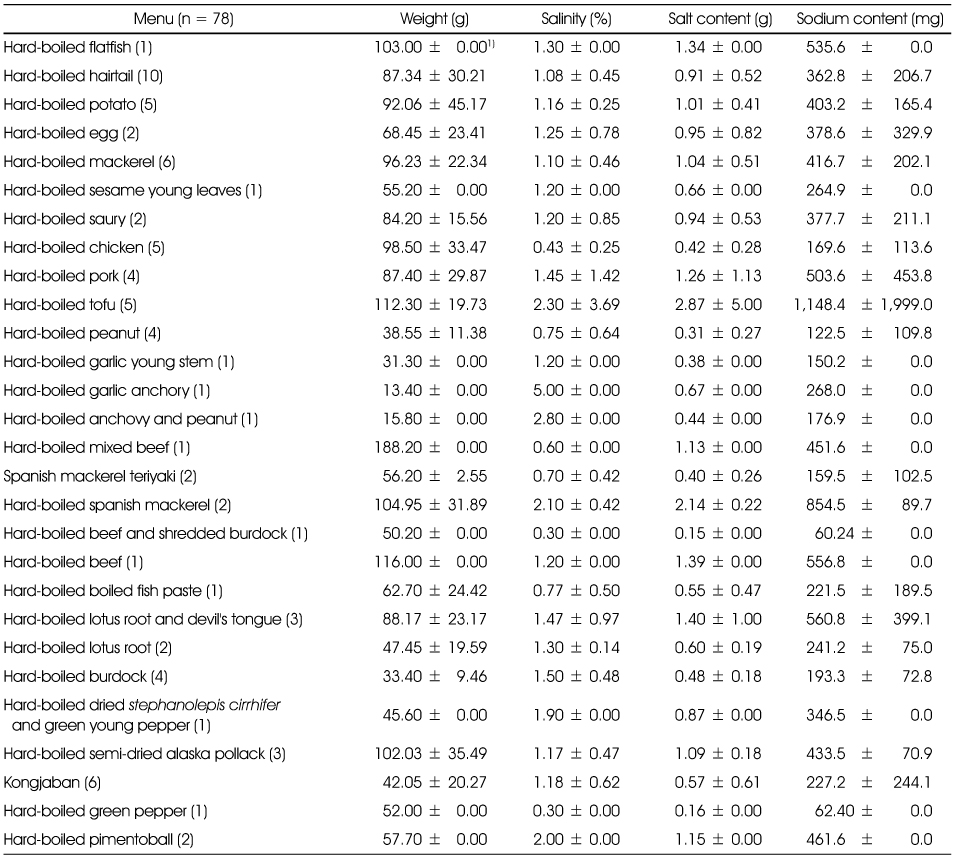
The salinity and salt content of hard-boiled foods per serving
1) Mean ± SD
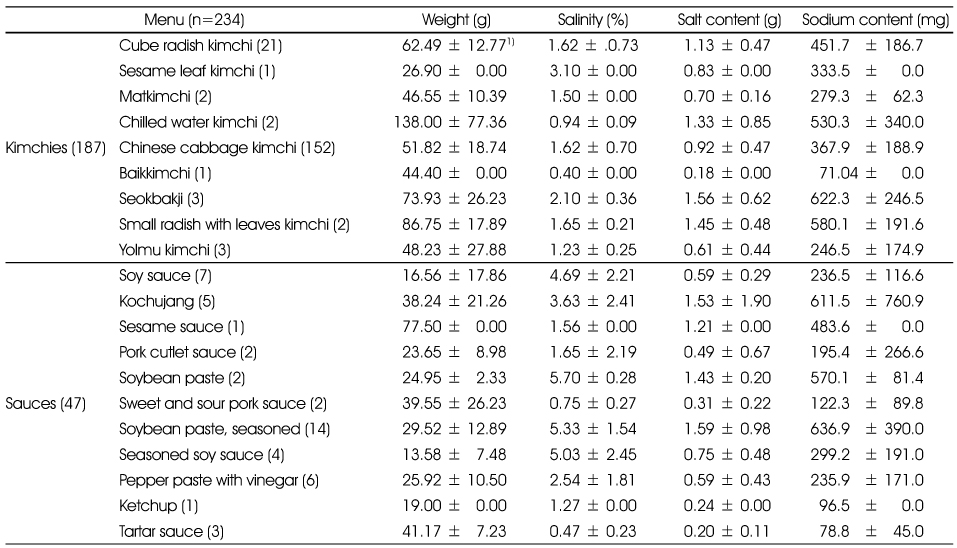
The salinity and salt content of kimchies and sauces per serving
1) Mean ± SD
1) Mean ± SD, 2) NS: not significant Means in the same column bearing different capital letters are significantly different among menu types by Duncan's multiple range test at p < 0.05. Means in the same column bearing different small letters are significantly different within menu types by Duncan's multiple range test at p < 0.05.
1) Mean ± SD
1) Mean ± SD
1) Mean ± SD
1) Mean ± SD
1) Mean ± SD
1) Mean ± SD

 KSCN
KSCN
 PubReader
 Cite
Cite


