
Articles
- Page Path
- HOME > Korean J Community Nutr > Volume 17(5); 2012 > Article
-
Original Article
- Assessment of Energy Intake and Physical Activity Level for Korean Farmers to Establish Estimated Energy Requirements during the Off-Season for Farmers
- Sun-Hee Lee, Seo-Eun Yeon, Hee-Ryoung Son, Jung Sook Choi, Eun Kyung Kim
-
Korean Journal of Community Nutrition 2012;17(5):652-663.
DOI: https://doi.org/10.5720/kjcn.2012.17.5.652
Published online: October 31, 2012
Department of Food and Nutrition, Gangneung-Wonju National University, Gangwon-do, Korea.
1National Academy of Agricultural Science, Rural Development Administration, Suwon, Korea.
- Corresponding author: Eun Kyung Kim, Department of Food & Nutrition, Gangneung-Wonju National University,7 Jukheon road, Gangneung, Gangwon-do 210-702, Korea. Tel: (033) 640-2336, Fax: (033) 640-2330, ekkim@gwnu.ac.kr
• Received: September 26, 2012 • Revised: October 11, 2012 • Accepted: October 24, 2012
Copyright © 2012 The Korean Society of Community Nutrition
- 375 Views
- 0 Download
- 12 Crossref
Abstract
- The purpose of this study was to assess the physical activity level of Korean farmers to establish estimated energy requirements during the off-season. Subjects were 90 healthy males (n = 25) and females (n = 65). Body weight, height and body fat and muscles of subjects were measured. The prevalence of obesity among farmers was 56.7% according to the BMI. The farmers spent about 18 hours 7 minutes (75.5%) in sleeping and resting. The farmers spent about 19 hours 56 minutes (83.1%) out of 24 hours (one day) in "sedentary activities" and spent about 3 hours 56 minutes (16.4%) in "light activities". Physical activity level (PAL, activity coefficient) of female farmers was 1.42 which was not significantly higher than that (1.37) of male farmers. Estimated energy requirements (EER) for farmers who were different in age groups and gender were calculated. For example, the EERs for male and female farmers were 2190 kcal/day and 1712 kcal/day, respectively. The daily energy intakes of male and female farmers were 1803 kcal/day and 1610 kcal/day, respectively. The EER of male farmers was 2190 kcal/day which was significantly higher than that (1803 kcal/day) of the recommended daily energy intake of male farmers. The results of this study suggest that estimated EER of farmers should be modified according to seasonal workload and energy balance of farmers should be evaluated to prevent obesity.
-
This work supported by grants from rural development administration of Korea (RDA: 20110701-037-506-001-03-00)
NOTES
- 1. Belko AZ, Obarzanek E, Kalkarf HJ, Rotter MA, Bogusz S, Miller D, Haas J, Roe DA. Effect of exercise on riboflavin requirements of young women. Am J Clin Nutr. 1983; 37: 509-517.PubMed
- 2. Choi JC, Gim GM, Lee JY, Kang Kh. Analyzing the time use of rural daily life on farm couple. Korean J Agric Extension. 2003; 14(1): 231-247.
- 3. Choi JH, Hwang KS. The adaptability of Korean farmers to environment by the seasonal fluctuation of energy expenditure, cold and heat tolerance. Korean J Community Living Sci. 2006; 17(2): 49-60.
- 4. Ford ES, Giles WH, Dietz WH. Prevalence of the metabolicsyndrome among US adults:Findings from the third National Health and Nutrition Examination Survey. JAMA. 2002; 287: 356-359.ArticlePubMed
- 5. Han YS, Lee YS. The rice and barley farm couples time use patterns. J Korean Fam Resour Manage Assoc. 2007; 11(2): 5-132.
- 6. Hubert HB, Feinleib M, McNamara PM, Castelli WP. Obestity as an independent risk factor for cardiovascular diease: A 26-ear follow up of participants in the farmingham heart study. Circulation. 1983; 67: 968-977.ArticlePubMed
- 7. Johnson RK, Goran MI, Poehlman ET. Correlations of over- and underrporting of energy intake in healthy older men and women. Am J Clin Nutr. 1994; 59: 1286-1290.PubMed
- 8. Jung KH, Lee YK. Regional Difference in elderly welfare services and policy issues. Health Welf Policy Forum. 2004; 92: 53-61.
- 9. Kim EK, Kim EK, Song JM, Choi HJ, Lee KH. Assessment of activity coefficient, resting energy expenditure and daily energy expenditure in elementary school children. J Korean Diet Assoc. 2006; 12(1): 44-54.
- 10. Kim EK, Kim GS, Park JS. Comparison of activity factor, predicted resting metabolic rate, and intakes of energy and nutrients between athletic and non-athletic high school students. J Korean Diet Assoc. 2009; 15(1): 52-68.
- 11. Kim EK, Lee SH, Ko SY, Yeon SE, Choe JS. Assessment of physical activity level of Korean farmers to establish estimated energy requirements during busy farming season. Korean J Community Nutr. 2011; 16(6): 751-761.Article
- 12. Kim HN, Jun SG, Jung HR, Lee DS. The energy expenditure of female farmer. survey improvement nutrition of farming. 1986; Seoul: Rural Development Administration; 133-151.
- 13. Kim HN, Lee DT, Rhie SG. The energy expenditure of female farmers in Kyunggki area. J Korean Soc Food Sci Nutr. 1989; 18(2): 189-194.
- 14. Kim JH, Kim EK. Assessment of physical activity, activity coefficient of preschool children and actual condition of daycare center outdoor play. Korean J Community Nutr. 2009; 14(6): 777-788.
- 15. Kim YM, Jeon JO, Kim MG, Choe BY. Trend in body mass index at a rural korean community. J Agric Med Community Health. 2005; 30: 113-120.
- 16. Kim Y, Na HJ. The estimation of daily energy expenditure of Korean adolescents. Korean J Community Nutr. 2003; 8(3): 270-279.
- 17. Korea Centers for Disease Control and Prevention; KCDC. 2007; cited 2012 October 2. Available from www.cdc.go.kr.
- 18. Korean Society for the Study of Obesity. Nutrition assessment. 2000; Paju: Kyomunsa.
- 19. Lim WJ, Yoon JS. A longitudinal study on seasonal variation of physicl activity and body composition of rural women. Korean J Nutr. 1995; 28(9): 893-903.
- 20. Lim WJ, Yoon JS. A study on health status, meal management, and seasonal variation of nutrient intake of rural women. J Korean Soc Food Sci Nutr. 1997; 26(6): 1215-1220.
- 21. Lee KY, Cho HK, Kim OS, Lee SM, Hong DS, Cho HS, Kim YK, Kim JK. An analysis of rural families' time use. J Korean Home Manage Assoc. 2006; 24(5): 205-222.
- 22. Lee SG, Jun SG, Gwan GH. Expenditure energy of farm work model. survey improvement nutrition of farming. 1986; Seoul: Rural Development, Administration; 255-291.
- 23. Lee SH, Park JS, Kim EK. Assessment of daily steps, physical activities and activity coefficient of policemen who do shift-work. Korean J Nutr. 2007; 40(6): 576-583.
- 24. Lim HS, Hwang GH. A survey of nutrition and blood concents of rural women in Korea. Korean J Nutr. 1982; 5(3): 171-180.
- 25. Lim WJ, Yoon JS. A longitudinal study on seasonal variation of physicl activity and body composition of rural women. Korean J Nutr. 1995; 28(9): 893-903.
- 26. Lim WJ, Yoon JS. Effects of dietary intake and work activity on seasonal variation of riboflavin status in rural women. Korean J Nutr. 1996; 29(9): 1003-1012.
- 27. Lim WJ, Yoon JS. : A study on health status, meal management, and seasonal variation of nutrient intake of rural women. J Korean Soc Food Sci Nutr. 1997; 26(6): 1215-1220.
- 28. Lissner L, Habicht JP, Strupp BJ, Levitsky DA, Haas JD, Roe DA. Body composition and energy intake:do overweight women overeat and underreport? Am J Clin Nutr. 1989; 49: 320-325.ArticlePubMed
- 29. MacGregor DC. Psychology, meaning and the challenges of longevity. Futures. 2003; 35: 575-588.Article
- 30. Ministry of Health. Labour and Welfare. The Fifth Japanese Dietary Allowance. 1985.
- 31. Ministry of Health and Welfare. National Health and Nutritional Survey Report in Korean. 2010.
- 32. Moon EH. Implementation and evaluation of nutrition education program for hypertensive patients among sdults aged 50 and over. 2004; Seoul: Department of Nutrition. The Graduate School of Seoul Women's University; 35-52 Master's degree thesis.
- 33. Myers RJ, Klesges RC, Eck LH, Hanson CL, Klem ML. Accuracy of self-reports of food intake in obese and normal-weight individuals:effects of obestity on self-reports of dietary intake in adults females. Am J Clin Nutr. 1988; 48: 1248-1251.PubMed
- 34. Park MY, Yi BS, Lee KJ, Mo SM. Nutrition and parasite of rural fertile women of the family health project area in Korea. Korean J Nutr. 1981; 14(4): 200-208.
- 35. Statistics Korea. Socio-Statistical Survey. 2009.
- 36. Statistics Korea. Socio-Statistical Survey. 2010.
- 37. Statistics Korea. Socio-Statistical Survey. 2011.
- 38. The Korean Nutrition Society. Dietary Reference Intakes for Koreans. 2005; Seoul: Korean Nutrition Society.
- 39. The Korean Nutrition Society. Dietary Reference Intakes for Koreans. 2010; Seoul: Korean Nutrition Society.
- 40. Williams DM. Exercise, affect, and adherence: an integrated model and a case for self-paced exercise. J Sport Exerc Psychol. 2008; 30(5): 471-496.ArticlePubMedPMC
- 41. Yoon JS, Kim KJ, Kim JH, Park YS, Koo JO. A study to determine the recommended dietary allowance of energy and to develop practical dietary education program for Korean adults. 2002; Keimyung University, Ministry of Health and Welfare.
REFERENCES
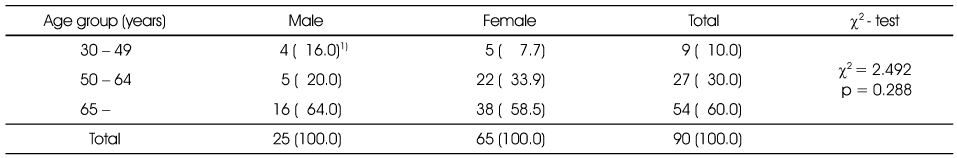
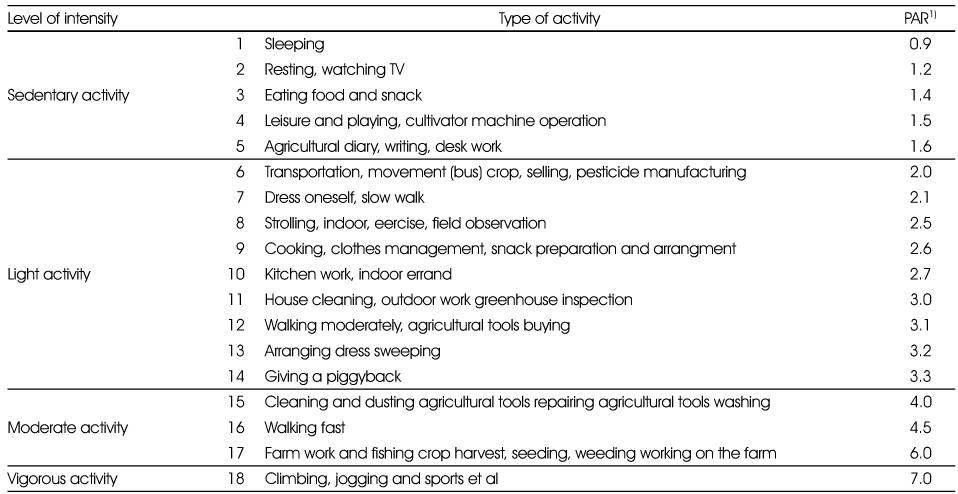
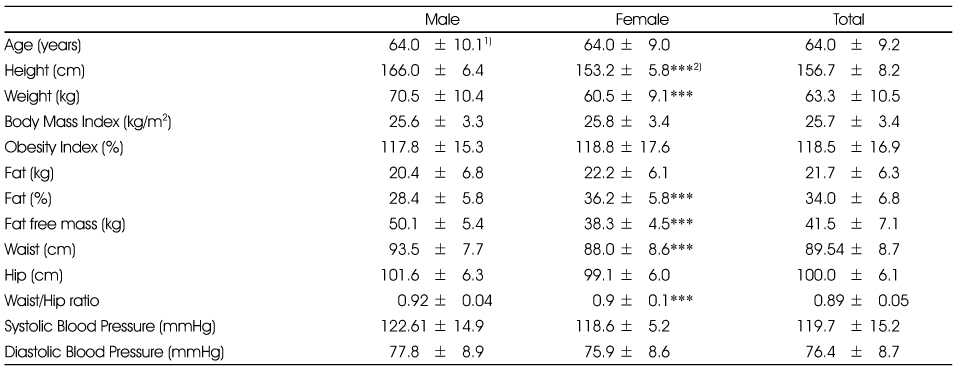
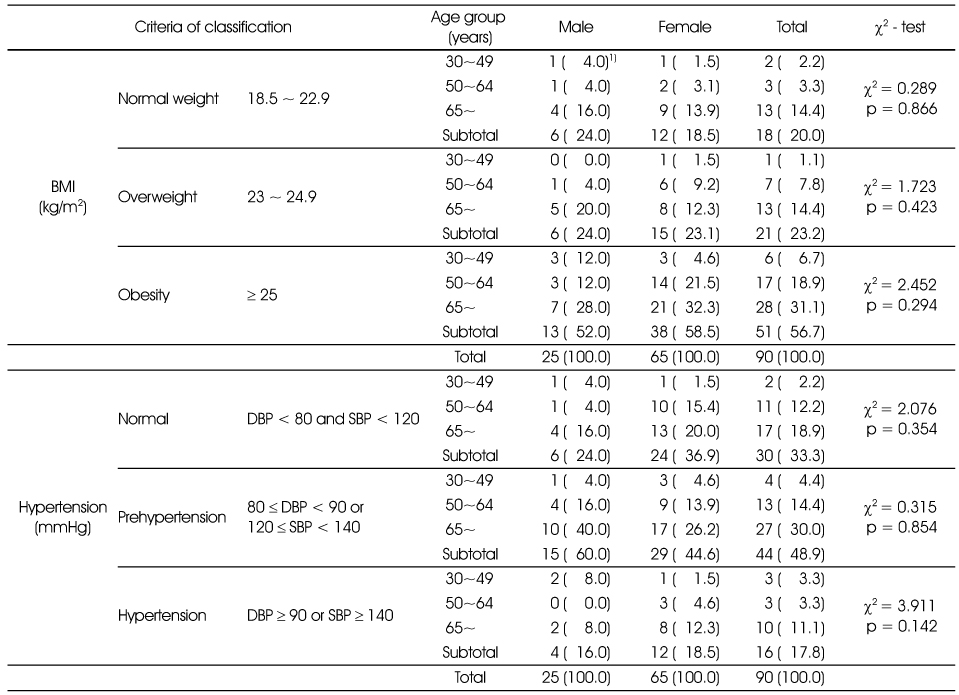
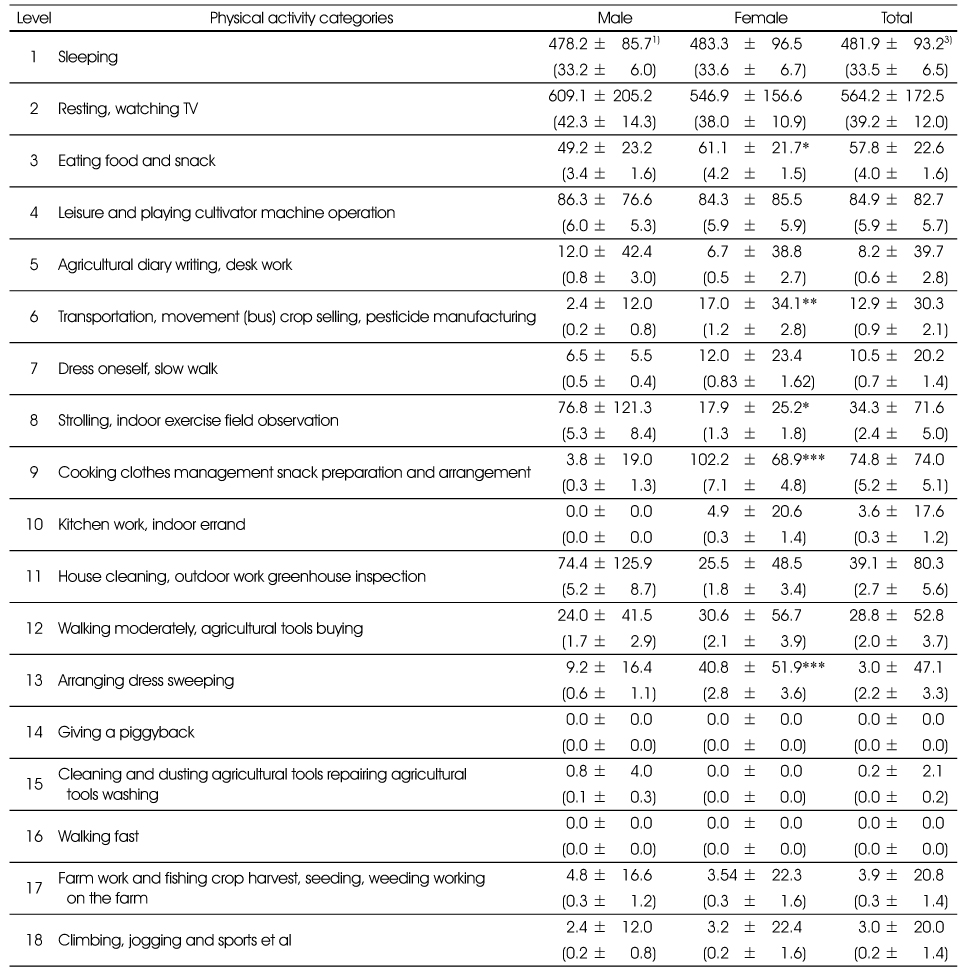
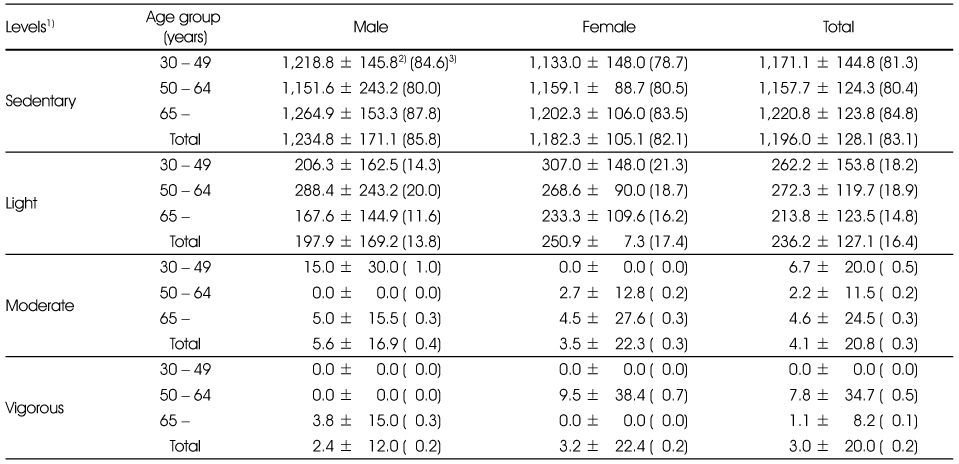
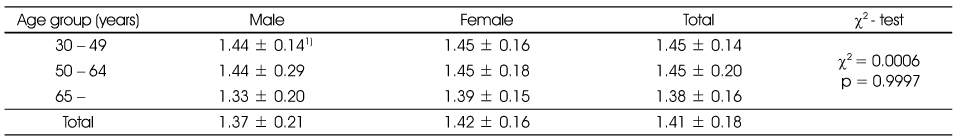
Table 8Estimated energy requirements(EER) and energy intakes by age group and gender
1) Unit : Kcal/day
2) Mean ± SD
Significant different between male and female at *: p < 0.05, **: p < 0.01, ***: p < 0.001 by t-test
abc: Means with same superscripts are not significantly different at p<0.05 by Duncan's multiple comparison test
Significant different between daily energy intake and estimated energy requirements at †: p < 0.05, ††: p < 0.01, †††: p < 0.001 by paired t-test
Figure & Data
REFERENCES
Citations
Citations to this article as recorded by 
- Study on the relationship between dietary habits and the quality of life of some high school students in Seoul based on the nutrition quotient for adolescents (NQ-A)
Ho-Jung Kim, Jung-Sug Lee, Yookyung Kim
Journal of Nutrition and Health.2024; 57(3): 320. CrossRef - Water intake and oral disease symptoms in adolescents: a cross-sectional study conducted in Korea in 2021
So-Yeong Kim, Sun-A Lim
Journal of Korean Society of Dental Hygiene.2023; 23(5): 343. CrossRef - The Gangwon Obesity and Metabolic Syndrome Study: Methods and Initial Baseline Data
Yoon Jeong Cho, Sohyun Park, Sung Soo Kim, Hyo Jin Park, Jang Won Son, Tae Kyung Lee, Sangmo Hong, Jee-Hyun Kang, Seon Mee Kim, Yang-Hyun Kim, Won Jun Kim, Young Eun Seo, Yoosuk An, Sang Youl Rhee, Suk Chon, Sookyoung Jeon, Kyungho Park, Bong-Soo Kim, Cha
Journal of Obesity & Metabolic Syndrome.2022; 31(4): 303. CrossRef - Establishment and future tasks of estimated energy requirement in 2020 dietary reference intakes for Koreans
Eun-Kyung Kim, Oh Yoen Kim, Jonghoon Park, EunMi Kim, Juhyeon Kim
Journal of Nutrition and Health.2021; 54(6): 573. CrossRef - Relationship between Dietary Habits, Life Stress and Nutrition Knowledge of High School Students in Gyeonggi Area
Kyung Ae Park, Hongmie Lee, Kyunghee Song
Korean Journal of Community Nutrition.2020; 25(2): 126. CrossRef - Amounts of physical activity and sedentary behavior patterns in older adults: using an accelerometer and a physical activity diary
Na-Young Go, Didace Ndahimana, Eun-Kyung Kim
Journal of Nutrition and Health.2019; 52(1): 36. CrossRef - A Study on the Body Composition, Physical Activity Level, Basal Metabolic Rate, and Daily Energy Expenditure of Elderly in Busan
Hwa-Jae Lim
Korean Journal of Community Nutrition.2016; 21(2): 178. CrossRef - Factors Influencing Dietary Behavior in Nursing Students
Eun Kyung Byun, Mi Young Kim
Journal of Korean Academy of Psychiatric and Mental Health Nursing.2016; 25(2): 81. CrossRef - Effects of High-speed Elastic Band Training on Physical Fitness and Muscle Function in Rural Community-dwelling Elderly: a Single-blinded Randomized Controlled Trial
Jun Seok Son, Dongheon Kang, Dong Hyun Yoon, Dae-Young Kim, Hee-jae Kim, Jang Hoe Kim, Byunghun So, Han Sol Song, Su Seung Hwang, Wook Song
Korean Journal of Health Promotion.2015; 15(4): 254. CrossRef - The Measurements of the Resting Metabolic Rate (RMR) and the Accuracy of RMR Predictive Equations for Korean Farmers
Hee-Ryoung Son, Seo-Eun Yeon, Jung-Sook Choi, Eun-Kyung Kim
Korean Journal of Community Nutrition.2014; 19(6): 568. CrossRef - Awareness and Practice of Dietary Action Guide for Adolescence among Middle and High School Students in Korea
So-Hyun Park, Hae-Ryun Park, Soo-Bin Jeon, So-Yeon Jeong, Zuunnast Tserendejid, Jung-Sook Seo, Kyung-Hae Lee, Yeon-Kyung Lee
Korean Journal of Community Nutrition.2012; 17(2): 133. CrossRef - Comparison of Life Style, School Achievement and Snaking Behaviors among Underweight and Overweight Adolescents
Hye-Kyung Kim, Jin-Hee Kim
The Korean Journal of Nutrition.2011; 44(2): 131. CrossRef
 PubReader
 Cite
CiteAssessment of Energy Intake and Physical Activity Level for Korean Farmers to Establish Estimated Energy Requirements during the Off-Season for Farmers
Assessment of Energy Intake and Physical Activity Level for Korean Farmers to Establish Estimated Energy Requirements during the Off-Season for Farmers
Distribution of subjects by gender and age groups
1) N (%)
Not significantly different in mean age and subject's distribution between male and female
Physical activity categories according to the level of intensity
1) Physical activity ratio (PAR) expressed as multiples of basal metabolic rate (RMR)
Anthropometric measurements of subjects by gender
1) Mean ± SD
2) Significant different between male and female at ***: p < 0.001 by t-test
Prevalence of hypertension and obesity among subjects
1) N (%)
Not significantly different in distribution between male and female by χ2-test
The time spent on each activity by the physical activity categories
1) Mean ± SD (min, %)
Significant different between male and female at *: p < 0.05, **: p < 0.01, ***: p < 0.001 by t-test
Comparison of spending time (min,%) of subjects by 4 activity levels
1) Classification of 18 activities levels to 4 activity levels
2) Mean ± SD
3) min (%)
Not Significant different between male and female by t-test
Not Significant different among age group by Duncan's multiple comparison test
Comparison of physical activity level(PAL) by gender and age groups
1) Mean ± SD
Not Significant different between male and female by t-test
Not Significant different among age group by Duncan's multiple comparison test
Not significantly different in distribution between male and female by χ2-test
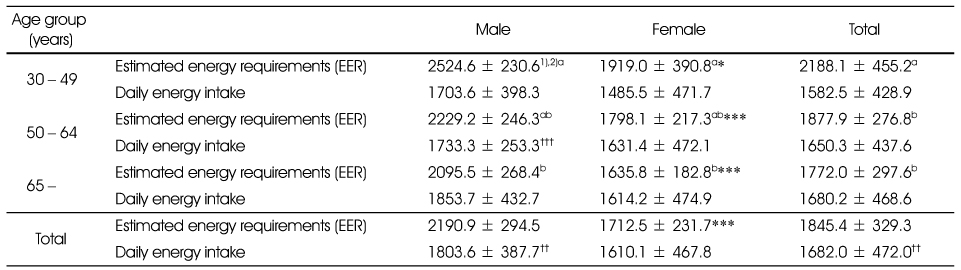
Estimated energy requirements(EER) and energy intakes by age group and gender
1) Unit : Kcal/day
2) Mean ± SD
Significant different between male and female at *: p < 0.05, **: p < 0.01, ***: p < 0.001 by t-test
abc: Means with same superscripts are not significantly different at p<0.05 by Duncan's multiple comparison test
Significant different between daily energy intake and estimated energy requirements at †: p < 0.05, ††: p < 0.01, †††: p < 0.001 by paired t-test
Table 1
Distribution of subjects by gender and age groups
1) N (%) Not significantly different in mean age and subject's distribution between male and female
Table 2
Physical activity categories according to the level of intensity
1) Physical activity ratio (PAR) expressed as multiples of basal metabolic rate (RMR)
Table 3
Anthropometric measurements of subjects by gender
1) Mean ± SD 2) Significant different between male and female at ***: p < 0.001 by t-test
Table 4
Prevalence of hypertension and obesity among subjects
1) N (%) Not significantly different in distribution between male and female by χ2-test
Table 5
The time spent on each activity by the physical activity categories
1) Mean ± SD (min, %) Significant different between male and female at *: p < 0.05, **: p < 0.01, ***: p < 0.001 by t-test
Table 6
Comparison of spending time (min,%) of subjects by 4 activity levels
1) Classification of 18 activities levels to 4 activity levels 2) Mean ± SD 3) min (%) Not Significant different between male and female by t-test Not Significant different among age group by Duncan's multiple comparison test
Table 7
Comparison of physical activity level(PAL) by gender and age groups
1) Mean ± SD Not Significant different between male and female by t-test Not Significant different among age group by Duncan's multiple comparison test Not significantly different in distribution between male and female by χ2-test
Table 8
Estimated energy requirements(EER) and energy intakes by age group and gender
1) Unit : Kcal/day 2) Mean ± SD Significant different between male and female at *: p < 0.05, **: p < 0.01, ***: p < 0.001 by t-test abc: Means with same superscripts are not significantly different at p<0.05 by Duncan's multiple comparison test Significant different between daily energy intake and estimated energy requirements at †: p < 0.05, ††: p < 0.01, †††: p < 0.001 by paired t-test


