
Articles
- Page Path
- HOME > Korean J Community Nutr > Volume 18(2); 2013 > Article
-
Original Article
- Calcium Status and Bone Mineral Density by the Level of Sodium Intake in Young Women
- Jin-Sook Yoon, Mi Jung Lee
-
Korean Journal of Community Nutrition 2013;18(2):125-133.
DOI: https://doi.org/10.5720/kjcn.2013.18.2.125
Published online: April 30, 2013
Department of Food and Nutriton, Keimyung University, Daegu, Korea.
- Corresponding author: Jin-Sook Yoon, Department of Food and Nutrition, Keimyung University, 1000 Sindang-dong, Dalseo-gu, Daegu, Korea. Tel: (053) 580-5873, Fax: (053) 580-5885, jsook@kmu.ac.kr
• Received: February 4, 2013 • Revised: April 22, 2013 • Accepted: April 22, 2013
Copyright © 2013 The Korean Society of Community Nutrition
- 385 Views
- 0 Download
- 14 Crossref
Abstract
- Previous studies have shown that sodium excretion is positively related to calcium excretion in the urine. As excessive sodium intake is a common nutritional problem in Korea, we intended to investigate associations among sodium intake levels and calcium status, evaluated by 24 hour recall method and urinary excretion, and bone status. We collected dietary information for non-consecutive three days from 139 young adult women 19~29 years. After classifying the subjects into 4 groups based on the dietary sodium levels by daily total sodium intake (mg) and sodium density (sodium intake per 1000 kcal energy intake), we compared the bone status, nutrient intakes, urinary calcium and sodium excretions. The results showed a positive association between total daily sodium intake and intake of other nutrients. However, no significant differences in nutrients intakes were observed among subject groups classified by sodium density levels. There were no significant differences of bone density among groups by total daily sodium intake as well as by sodium density. While total daily sodium intake showed significantly positive relationship with urinary sodium (p < 0.05) and calcium (p < 0.05), sodium density was not related to urinary excretion of calcium and sodium. Our results suggested that promoting balanced meals providing appropriate amounts of energy intake is the essential component of nutrition education for improving calcium status of young Korean women with excessive sodium intake.
-
This work was supported by Basic Science Research Program through the National Research Foundation of Korea (NRF) funded by the Ministry of Education, Science and Technology (MEST) 2010-0241
NOTES
- 1. Braun M, Palacios C, Wigertz K, Jackman LA, Bryant RJ, McCabe LD, Martin BR, McCabe GP, Peacock M, Weaver CM. Racial differences in skeletal calcium retention in adolescent girls with varied controlled calcium intakes. Am J Clin Nutr. 2007; 85(6): 1657-1663.ArticlePubMed
- 2. Cho JH, Paik HY. A comparative study on urinary Ca excretion in young and middle-aged Korean women. Korean J Nutr. 1992; 25(2): 132-139.
- 3. Choi MJ, Jung YJ. The relationship between food habit, nutrient intakes and bone mineral density and bone mineral content in adult women. Korean J Nutr. 1998; 31(9): 1446-1456.
- 4. Choong SS, Balan SN, Chua LS, Say YH. Preference and intake frequency of high sodium foods and dishes and their correlations with anthropometric measurements among Malaysian subjects. Nutr Res Pract. 2012; 6(3): 238-245.ArticlePubMedPMC
- 5. Chung YJ, Lee KM, Park JW, Chung SP. Factor which are related with BMD in premenopausal women. J Korean Acad Fam Med. 2001; 22(3): 363-370.
- 6. Cohen AJ, Roe FJ. Review of risk factors for osteoporosis with particular reference to a possible aetiological role of dietary salt. Food Chem Toxicol. 2000; 38(2-3): 237-253.ArticlePubMed
- 7. D'Elia L, Rossi G, Ippolito R, Cappuccio FP, Strazzullo P. Habitual salt intake and risk of gastric cancer: A meta-analysis of prospective studies. Clin Nutr. 2012; 31(4): 489-498.ArticlePubMed
- 8. FAO & WHO. Human vitamin and mineral requirements. 2001; Food and Nutrition Division FAO Rome; 151-171.
- 9. Foxall RJ, Jakobsen J, Cashman KD, Flynn A, Fairweather-Tait SJ. Sodium and bone health: impact of moderately high and low salt intakes on calcium metabolism in postmenopausal women. J Bone Miner Res. 2008; 23(9): 1477-1485.ArticlePubMedPDF
- 10. Gennari C. Calcium and vitamin D nutrition and bone disease of the elderly. Public Health Nutr. 2001; 4(2B): 547-559.ArticlePubMed
- 11. Harrington M, Cashman KD. High salt intake appears to increase bone resorption in postmenopausal women but high potassium intake ameliorates this adverse effect. Nutr Rev. 2003; 61(5): 179-183.PubMed
- 12. Jones G, Beard T, Parameswaran V, Greenaway T, von Witt R. A population-based study of the relationship between salt intake, bone resorption and bone mass. Eur J Clin Nutr. 1997; 51(8): 561-565.PubMed
- 13. Koo JO, Ahn HS, Yoo SY. Study of bone mineral density, body composition and dietary habits of 20~30 years women. Korean J Community Nutr. 2008; 13(4): 489-498.
- 14. Korea Food & Drug Administration, Korea Health Industry Development Institute. Two-dimensional model kit of food and it's bowl. 2007.
- 15. Korean Nutrition Society. Dietary reference intakes for Koreans. 2010; Seoul, Korea.
- 16. Kurtz TW, Al-Bancer HA, Morris RC. "Salt-sensitive" essential hypertension in men. N Engl J Med. 1987; 317(17): 1043-1048.PubMed
- 17. Kwon IS, Kim IG, Kang CM, Yoo TW, Park BJ, Kang HS, Lee HS, Kim CI, Cho HC, Bae SH, Park SC. Vitamin D and estrogen receptor gene polymorphism and their interaction associated with bone mineral density in Korean postmenopausal women. Korean J Med. 2001; 60(5): 421-431.
- 18. Lee HJ, Lee HO. A study on the bone mineral density and related factors in Korean postmenopausal women. Korean J Nutr. 1999; 32(2): 197-203.
- 19. Lee HJ, Lee IG. Bone mineral density of Korean mother-daughter pairs : Relations to anthropometric measurement, body composition, bone markers, nutrient intakes and energy expenditure. Korean J Nutr. 1996; 29(9): 991-1002.
- 20. Libuda L, Kersting M, Alexy U. Consumption of dietary salt measured by urinary sodium excretion and its association with body weight status in healthy children and adolescents. Public Health Nutr. 2012; 15(3): 433-441.PubMed
- 21. Lim HJ. A study on the calcium and sodium intakes and urinary calcium excretion of adults in Busan. Korean J Community Nutr. 2011; 16(2): 215-226.
- 22. Lim JH, Bae HS, Lee SM, Ahn HS. Dietary and non-dietary factors related to bone mineral density in female college students. Korean J Community Nutr. 2008; 13(3): 418-425.
- 23. Metz JA, Anderson JJ, Callagher PN Jr. Intakes of calcium, phosphorus, and protein, and physical activity level are related to radial bone mass in young adult women. Am J Clin Nutr. 1993; 58(4): 537-542.PubMed
- 24. Ministry of Health, Welfare and Family Affairs & Korea Center for Disease Control and Prevention. Korea health statistics 2009: Korea National Health and Nutrition Examination Survey (KNHANES IV-3). 2010; Seoul, Korea: Korea Center for Disease Control and Prevention.
- 25. Mizushima S, Tsuchida K, Yamori Y. Preventive nutritional factors in epidemiology : Interaction between sodium and calcium. Clin Exp Pharmacol physiol. 1999; 26(7): 573-575.PubMed
- 26. Park JY. Association between bone mineral density, bone marker and nutrients intake in pre- and postmenopausal women. 2010; Graduate school, Kyung Hee University; 1-12 MS Thesis.
- 27. Shortt C, Flynn A. Sodium-calcium inter-relationships with specific reference to osteoporosis. Nutr Res Rev. 1990; 3(1): 101-115.PubMed
- 28. Song YJ, Paik HY. Effect of dietary factors on bone mineral density in Korean college women. Korean J Nutr. 2002; 35(4): 464-472.
- 29. Song YJ, Paik HY. Effect of dietary, biochemical and other factors on bone mineral density change for 2 Years in Korean college women. Korean J Nutr. 2003; 36(2): 175-182.
- 30. Strazzullo P, D'Elia L, Kandala NB, Cappuccio FP. Salt intake, stroke, and cardiovascular disease: meta-analysis of prospective studies. BMJ. 2009; 339: b4567.PubMedPMC
- 31. Suleiman S, Nelson M, Li F, Buxton-Thomas M, Moniz C. Effect of calcium intake and physical activity level on bone mass and turnover in healthy, white, postmenopausal women. Am J Clin Nutr. 1997; 66(4): 937-943.PubMed
- 32. Takachi R, Inoue M, Shimazu T, Sasazuki S, Ishihara J, Sawada N, Yamaji T, Iwasaki M, Iso H, Tsubono Y, Tsugane S. Consumption of sodium and salted foods in relation to cancer and cardiovascular disease: the Japan public health center-based prospective study. Am J Clin Nutr. 2010; 91(2): 456-464.PubMed
- 33. Teucher B, Dainty JR, Spinks CA, Majsak-Newman G, Berry DJ, Hoogewerff JA, Foxall RJ, Jakobsen J, Cashman KD, Flynn A, Fairweather-Tait SJ. Sodium and bone health: impact of moderately high and low salt intakes on calcium metabolism in postmenopausal women. J Bone Miner Res. 2008; 23(9): 1477-1485.PubMed
- 34. Weaver C. Assessing calcium status and metabolism. J Nutr. 1990; 120: suppl 11. 1470-1473.PubMed
- 35. Wigertz K, Palacios C, Jackman LA, Martin BR, McCabe LD, McCabe GP, Peacock M, Pratt JH, Weaver CM. Racial differences in calcium retention in response to dietary salt in adolescent girls. Am J Clin Nutr. 2005; 81(4): 845-850.PubMed
- 36. Wilson TA, Adolph AL, Butte NF. Nutrient adequacy and diet quality in non-overweight and overweight Hispanic children of low socioeconomic status: the Viva la familia study. J Am Diet Assoc. 2009; 109(6): 1012-1021.PubMedPMC
- 37. Yoon JS, Jang H. Diet quality and food patterns of obese adult women from low income classes. Korean J Community Nutr. 2011; 16(6): 706-715.
- 38. Yu KH, Kong YA, Yoon JS. A study on dietary factors, urinary levels of Ca, Na and the bone status of women in urban and rural area. Korean J Community Nutr. 1996; 1(1): 71-78.
- 39. Yu CH, Lee JS, Lee IH, Kim SH, Lee SS, Jung IK. Nutritional factors related to bone mineral density in the different age groups of Korean women. Korean J Nutr. 2002; 35(7): 779-790.
REFERENCES
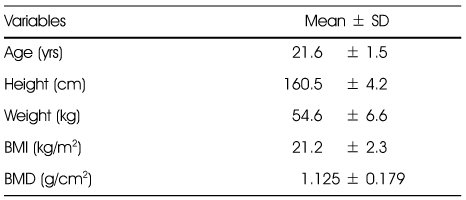
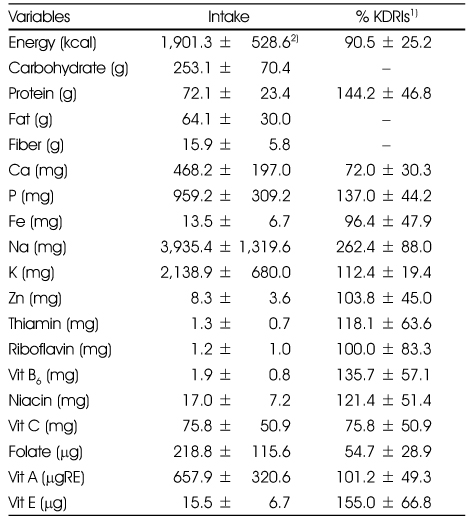
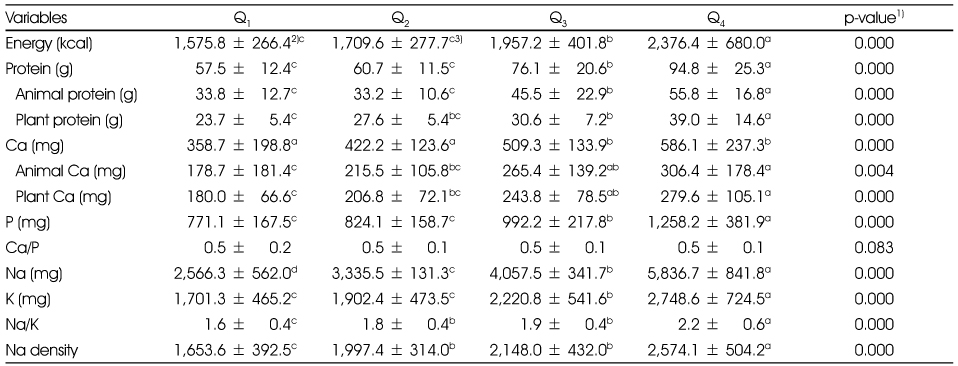
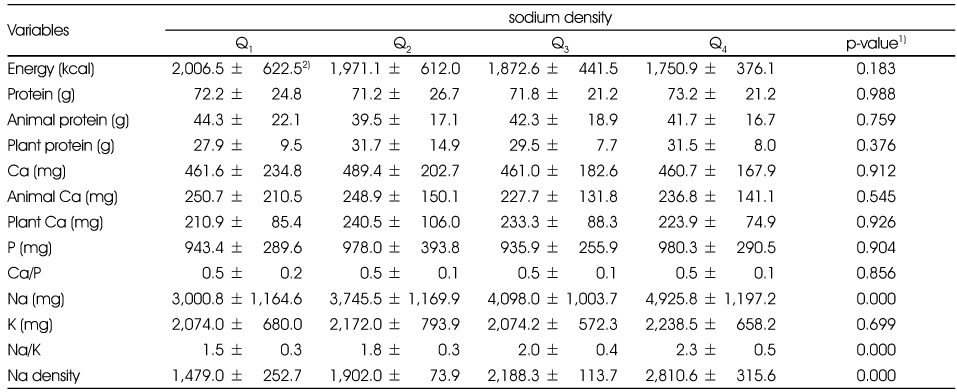
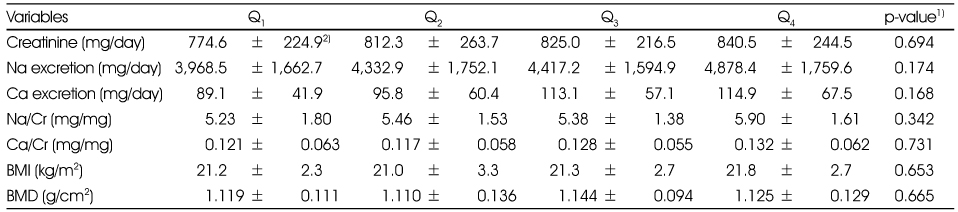
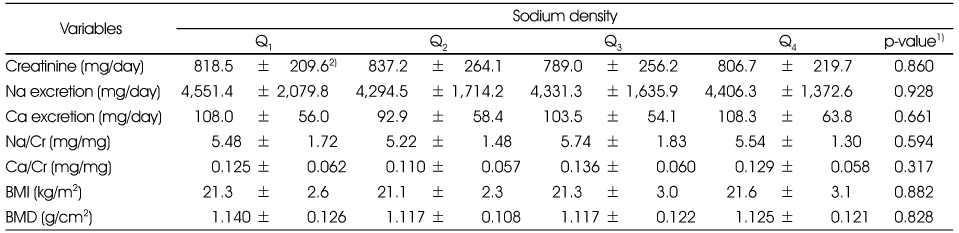
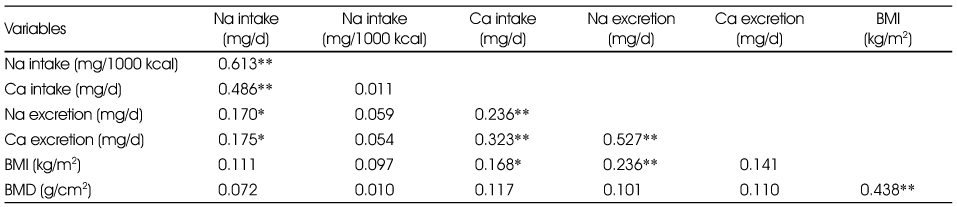
Figure & Data
REFERENCES
Citations
Citations to this article as recorded by 
- Importance-performance analysis of sodium reduction practices by school nutrition teachers and dietitians in the Republic of Korea
Youngmi Lee, Sooyoun Kwon, Meeyoung Kim
Nutrition Research and Practice.2023; 17(4): 812. CrossRef - Nutrition Knowledge and Eating Behaviors among College Students in the Pyeongtaek Area
Seo Hyeon Ahn, Seong Yeong Kim
Journal of the East Asian Society of Dietary Life.2020; 30(3): 235. CrossRef - Association between Sodium Excretion and Obesity of Adults in Gwangju
Mijin Jo, Young-Ran Heo
Korean Journal of Community Nutrition.2018; 23(1): 38. CrossRef - Relationship between Nutrient Intakes and Anthropometric Values, and Bone Mineral Density of Pre- and Post-menopausal Women in the Gyeongnam Area
Mi-Young Park, Hae-Jin Park, Sung-Hee Kim
Journal of the East Asian Society of Dietary Life.2018; 28(6): 432. CrossRef - Quality Characteristics of Jicama (Pachyrhizus erosus) Jangachi Prepared with Different Vinegars
Hye Gyoung Song, Hyun Sook Jung
Korean Journal of Food and Cookery Science.2018; 34(5): 441. CrossRef - Health and nutritional status of Korean underweight women in their twenties: Based on the 2010~2012 Korea National Health and Nutrition Examination Survey
Sa Rang Jeong, Sunghee Kim, Yoon Jung Yang
Journal of Nutrition and Health.2016; 49(2): 99. CrossRef - Evaluation of Obesity and Nutritional Status by Age among Low-income Women aged over 20 -Using Data from the Fourth Korea National Health and Nutrition Examination Survey-
Hee-Kyung Jang
Journal of the East Asian Society of Dietary Life.2015; 25(2): 246. CrossRef - Nutrition knowledge, eating attitudes, nutrition behavior, self-efficacy of childcare center foodservice employees by stages of behavioral change in reducing sodium intake
Yun Ahn, Kyung Won Kim, Kyungmin Kim, Jinwon Pyun, Ikhyun Yeo, Kisun Nam
Journal of Nutrition and Health.2015; 48(5): 429. CrossRef - Survey on Nutrition Knowledge, Food Behaviors, and Food Frequency of Sodium Intake in Korean University Students
Hee-Ok Pak
Journal of the East Asian Society of Dietary Life.2015; 25(1): 12. CrossRef - Contents of Sodium and Potassium for Restaurant Dishes in Seoul
Mi-ra Jang, Mi-sun Hong, Bu-chuhl Choi, Sung-hee Han, Kyeong-ah Lee, Li-la Kim, Jib-ho Lee, Jung-hun Kim, Kweon Jung
Journal of Food Hygiene and Safety.2015; 30(2): 189. CrossRef - Nutrition knowledge, outcome expectations, self-efficacy, and eating behaviors by calcium intake level in Korean female college students
Min Ju Kim, Kyung Won Kim
Nutrition Research and Practice.2015; 9(5): 530. CrossRef - A Comparison of Salty Taste Assessment, Dietary Attitude and Dietary Behavior among Adult and Senior Women by Region and by Age in Korea
Lin Jiang, Yun-Young Jung, Hyung-Sook Kim, Gi-Seon Nam, Jin-Sook Yun, Jong-Wook Kim, Yeon-Kyung Lee
Korean Journal of Community Nutrition.2015; 20(2): 109. CrossRef - Selection of the Coagulant for Processing and Identification of Antibacterial Activity on Foodborn Pathogens of Konjac Jelly
Jae-In Sim, Seon-Jeong Choi, Jae-Hyun Jeong, Ung-Kyu Choi
The Korean Journal of Food And Nutrition.2014; 27(4): 699. CrossRef - Bone Mineral Density, Biochemical Bone Turnover Markers and Factors associated with Bone Health in Young Korean Women
Young-Joo Park, Sook Ja Lee, Nah-Mee Shin, Hyunjeong Shin, Yoo-Kyung Kim, Yunjung Cho, Songi Jeon, Inhae Cho
Journal of Korean Academy of Nursing.2014; 44(5): 504. CrossRef
 PubReader
 Cite
CiteCalcium Status and Bone Mineral Density by the Level of Sodium Intake in Young Women
Calcium Status and Bone Mineral Density by the Level of Sodium Intake in Young Women
General characteristics of subjects
BMI: Body mass index
BMD: Bone mineral density
Daily energy and nutrients intake of subjects
1) % KDRIs mean % EER (Estimated energy requirement) for energy; % AI (Adequate intake) for Na, K, vit E; % RNI (Recommended nutrient intake) for other nutrients
2) Values are Mean ± SD.
Daily nutrients intake of subjects by total daily sodium intake level
1) p-value: Independent sample t-test
2) Values are Mean ± SD.
3) Means with different superscripts in a row are significantly different from others at p < 0.05 by Duncan's multiple range test.
Daily energy and nutrients intake of subjects by sodium density (Na/1000 kcal)
1) p-value: Independent sample t-test
2) Values are Mean ± SD.
24-hour Urinary Ca, Na excretion, BMI and Bone density by total daily sodium intake level
1) p-value: by ANOVA test
2) Values are Mean ± SD.
BMI: Body mass index
BMD: Bone mineral density
24-hour Urinary Ca, Na excretion, BMI and Bone density by sodium density (Na/1000 kcal)
1) p-value: Independent sample t-test
2) Values are Mean ± SD.
BMI: Body mass index
BMD: Bone mineral density
Relationships among dietary intake and urinary excretion of Ca and Na, Bone mineral density and BMI
*: p < 0.05, *: p < 0.01
Table 1
General characteristics of subjects
BMI: Body mass index BMD: Bone mineral density
Table 2
Daily energy and nutrients intake of subjects
1) % KDRIs mean % EER (Estimated energy requirement) for energy; % AI (Adequate intake) for Na, K, vit E; % RNI (Recommended nutrient intake) for other nutrients 2) Values are Mean ± SD.
Table 3
Daily nutrients intake of subjects by total daily sodium intake level
1) p-value: Independent sample t-test 2) Values are Mean ± SD. 3) Means with different superscripts in a row are significantly different from others at p < 0.05 by Duncan's multiple range test.
Table 4
Daily energy and nutrients intake of subjects by sodium density (Na/1000 kcal)
1) p-value: Independent sample t-test 2) Values are Mean ± SD.
Table 5
24-hour Urinary Ca, Na excretion, BMI and Bone density by total daily sodium intake level
1) p-value: by ANOVA test 2) Values are Mean ± SD. BMI: Body mass index BMD: Bone mineral density
Table 6
24-hour Urinary Ca, Na excretion, BMI and Bone density by sodium density (Na/1000 kcal)
1) p-value: Independent sample t-test 2) Values are Mean ± SD. BMI: Body mass index BMD: Bone mineral density
Table 7
Relationships among dietary intake and urinary excretion of Ca and Na, Bone mineral density and BMI
*: p < 0.05, *: p < 0.01


