Articles
- Page Path
- HOME > Korean J Community Nutr > Volume 18(2); 2013 > Article
-
Original Article
- Correlation of Nutrient Intake, Obesity-related Anthropometrics, and Blood Lipid Status with Instant Coffee-mix Intakes in Gangneung and Samcheok Residents
- Eun Kyung Kim, Jeong Sook Choe, Eun Kyung Kim
-
Korean Journal of Community Nutrition 2013;18(2):134-141.
DOI: https://doi.org/10.5720/kjcn.2013.18.2.134
Published online: April 30, 2013
National Academy of Agricultural Science, RDA, Suwon, Korea.
1Department of Food and Nutrition, Gangneung-Wonju National University, Kangneung, Korea.
- Corresponding author: Jeong Sook Choe, RDA, Gwonseon-gu, Suwon, Gyeonggi-do 441-707, Korea. Tel: (031) 299-0480, Fax: (031) 299-0443, swany@korea.kr
Copyright © 2013 The Korean Society of Community Nutrition
- 427 Views
- 0 Download
- 10 Crossref
Abstract
- This study was conducted to investigate instant coffee-mix intakes and its relations with anthropometric measurements, nutrient intake, and blood lipid in Gangneung and Samcheok residents. Coffee-mix is a mixture of instant coffee, sugar and coffee-creamer. It is a standardized convenience food in Korea. Recently, Koreans appear to consume too much of instant coffee-mix. The respondents of this study were 218 Koreans (Gangneung region 133, Samcheok region 85). The average age was 56.0 years (male), 57.5 years (female). They were divided into 2 groups, the instant coffee-mix drinkers and the non-drinkers. The nutrient intake and anthropometric measurements and their relations with coffee-mix intakes were analyzed (nutrient intakes were calculated by converting per 1,000 kcal and adjusted by age, region). As for male, body fat was significantly higher in coffee-mix drinkers (18.1 kg, 25.0%) than in nondrinkers (17.1 kg, 23.8%). In the case of females, serum triglyceride was significantly higher in coffee-mix drinkers (109.1 mg/dL) than in nondrinkers (102.9 mg/dL). Coffee-mix intakes and coffee-mix's contributions to energy were higher for participants from Samcheok (21.2 g, 4.7%) than those from Gangneung (16.6 g, 3.4%). In addition, for Samcheok, coffee-mix's contribution to energy was significantly higher in male (5.6%) than in female (4.2%). Coffee-mix intakes and energy contribution of coffee-mix were not significantly correlated with anthropometric measurements. Only HDL-cholestrol showed significantly negative correlation with coffee-mix's contributions to energy. Based on the above results, we conclude that usual instant coffee-mix intake may increase intakes of sugar and fat and exert negative effects on serum lipids. Therefore, it is needed to control too much instant coffee-mix intake in the dietary management of rural residents.
- 1. Alexander KP, Blazing MA, Rosenson RS, Hazard E, Aronow WS, Smith SC Jr, Ohman EM. Management of hyperlipidemia in older adults. J Cardiovasc Pharmacol Ther. 2009; 14: 49-58.ArticlePubMedPDF
- 2. Bak AAA, Grobbee DE. The effect on serum cholesterol levels of coffee brewed by filtering or boiling. N Engl J Med. 1989; 321(21): 1432-1437.ArticlePubMed
- 3. Choi SY, Kim YH. Effects of green tea or coffee consumption on serum lipid profiles. J Korean Soc Food Sci Nutr. 2010; 39(9): 1279-1285.Article
- 4. Chung CE. Establishment of total sugar reference value for Koreans : Association of total sugar intakes and metabolic syndrome from Korean national health and nutrition examination survey 2001-2002. Korean J Nutr. 2007; 40(Suppl): 29-38.
- 5. Food Industry Statistics System. 2012; cited 2012 Oct 18. Available from http://fis.foodinkorea.co.kr/.
- 6. Førde OH, Knutsen SF, Arnesen E, Thelle DS. The Tromsø heart study: Coffee consumption and serum lipid concentrations in men with hypercholesterolemia: a randomized intervention study. Br Med J (Clin Res Ed). 1985; 290: 893-895.PubMedPMC
- 7. Fried RE, Levine DM, Kwiterovich PO, Diamond EL, Wilder LB, Moy TF. The effect of filtered-coffee consumption on plasma lipid levels. Results of a randomized clinical trial. JAMA. 1992; 267(6): 811-815.ArticlePubMed
- 8. Jung HJ, Song WO, Paik HY, Joung HJ. Dietary characteristics of macronutrient intake and the status of metabolic syndrome among Koreans. Korean J Nutr. 2011; 44(2): 119-130.Article
- 9. Kang SU, Na YS. The analysis toward consumption state, import and export in the world coffee market - The case of Korea, USA, Japan market. Korean J Culinary Res. 2004; 10(3): 65-82.
- 10. Kim JH. The coffee market trend and forecast in food industry. J Korea Food Und Assoc. 2010; 207: 51-61.
- 11. Kim JH, Jo IH, Joung HJ. A rice-based traditional dietary pattern is associated with obesity in Korean adults. J Acad Nutr Diet. 2012; 112: 246-253.ArticlePubMed
- 12. Korea Center for Disease Control and Prevention. The fourth Korea National Health and Nutrition Examination Survey (KNHANES III). 2005.
- 13. Korean Rural Economic Institute. Food supply table. 2009.
- 14. Lacroix AZ, Mead LA, Liang KY, Thomas CB, Pearson TA. Coffee consumption and incidence of coronary heart disease. N Engl J Med. 1986; 315(16): 977-982.ArticlePubMed
- 15. Lancaster T, Muir J, Silagy C. The effects of coffee in serum lipids and blood pressure in a UK population. J R Soc Med. 1994; 87(9): 506-507.ArticlePubMedPMCPDF
- 16. Lee BE, Lee HJ, Cho EA, Hwsng KT. Fatty acid compositions of fats in commercial coffee creamers and instant coffee mixes and their sensory characteristics. J Korean Soc Food Sci Nutr. 2012; 41(3): 362-368.Article
- 17. Lee BY. A comparison of emulsion stability as non-dairy coffee whitener preparation. Korean J Food Nutr. 1991; 4(1): 91-97.
- 18. Miyake Y, Kono S, Nishiwaki M, Hamada H, Nishikawa H, Koga H, Ogawa S. Relationship of coffee consumption with serum lipids and lipoproteins in Japanese men. Ann Epidemiol. 1999; 9(2): 121-126.ArticlePubMed
- 19. Mozaffarian D, Katan MB, Ascherio A. Medical progress - trans-fatty acids and cardiovascular disease. N Engl J Med. 2006; 354: 1601-1613.ArticlePubMed
- 20. Murphy S, Johnson R. The scientific basis of recent US guidance on sugars intake. Am J Clin Nutr. 2003; 78(4): 827S-833S.ArticlePubMed
- 21. Na DW, Jeong E, Noh EK, Chung JS, Choi CH, Park J. Dietary factors and metabolic syndrome in middle-aged men. J Agric Med Community Health. 2010; 35(4): 383-394.Article
- 22. Narain C, Paterson A, Piggott JR, Dhawan M. Whitening and sweetening influences on filter coffee preferences. Br J Food. 2004; 106(6): 465-478.
- 23. Nicklas TA, Webber LS, Thompson B, Berenson G. A multivariate model for assessing eating patterns and their relationship to cardiovascular risk factorts: the Bogalusa heart study. Am J Clin Nutr. 1989; 49(6): 1320-1327.PubMed
- 24. Paul O, Lepper MH, Phellan WH, Dupertuis GW, Macmillan A, McKean H, Park H. A longitudinal study of coronary heart disease. Circulation. 1963; 28: 20-31.ArticlePubMed
- 25. Ratnayake WMN, Hollywood R, O'Grady E, Stavric B. Lipid content and composition of coffee brews prepared by different methods. Food Chem Toxicol. 1993; 31(4): 263-269.ArticlePubMed
- 26. Rosmarin PC, Applegate WB, Somes GW. Coffee consumption and serum lipids: A randomized, crossover clinical trial. Am J Med. 1990; 88(4): 349-356.ArticlePubMed
- 27. Rural Development Administration. Standard tables of food composition. 2009.
- 28. Saris WH, Astrup A, Prentice AM, Zunft HJ, Formiguera X, Verboeket-van de Venne WP, Raben A, Poppitt SD, Seppelt B, Johnson S, Vasilaras TH, Keogh GF. Randomized controlled trial of changes in dietary carbohydrate/fat ratio and simple vs complex carbohydrates on body weight and blood lipids: the CARMEN study. Int J Obes Relat Metab Disord. 2000; 24(10): 1310-1318.ArticlePubMedPDF
- 29. Shin JW. Effect of sustainability management on consumers behavioral intention at coffee houses and Korean status of coffee intake. 2012; Seoul National University; Master's Thesis.
- 30. Sohn KH, Lee MJ, Min SH, Lee HJ. A study on the factors affecting the consumption of coffee and tea among female in Seoul. Korean J Diet Cult. 2000; 15(5): 398-412.
- 31. Statistics Korea. Annual report on the caus of death statics. 2010.
- 32. Urgert R, Schulz AGM, Katan MB. Effects of cafesterol and kahweol from coffee grounds on serum lipids and serum liver enzymes in humans. Am J Clin Nutr. 1995; 61(1): 149-154.PubMed
REFERENCES
Figure & Data
REFERENCES
Citations

- Associations between the Genetic Heritability of Dyslipidemia and Dietary Patterns in Korean Adults Based on Sex Differences
Sei Kim, Hye Kyung Jeon, Gyeonghee Lee, Youbin Kim, Hae Young Yoo
Nutrients.2023; 15(20): 4385. CrossRef - Comparison of 24-hour Recalls with a Food Frequency Questionnaire in Assessing Coffee Consumption: The Health Examinees (HEXA) Study
An Na Kim, Jiyoung Youn, Hyun Jeong Cho, Taiyue Jin, Sangah Shin, Jung Eun Lee
Korean Journal of Community Nutrition.2020; 25(1): 48. CrossRef - Association of Dietary Fatty Acid Consumption Patterns with Risk of Hyper-LDL Cholesterolemia in Korean Adults
Eunhee Choi, Seoeun Ahn, Hyojee Joung
Nutrients.2020; 12(5): 1412. CrossRef - Association of coffee consumption with health-related quality of life and metabolic syndrome in Korean adults: based on 2013 ~ 2016 Korea National Health and Nutrition Examination Survey
Hyesook Kim, Yu Jin Kim, Yeni Lim, Oran Kwon
Journal of Nutrition and Health.2018; 51(6): 538. CrossRef - Obesity and Related-factors in Patients with Chronic Mental Illness Registered to Community Mental Health Welfare Centers
Eun-Suk Park, Eun-Hyun Lee
Journal of Korean Academy of Community Health Nursing.2018; 29(1): 76. CrossRef - 3-in-1 coffee consumption is associated with metabolic factors in adults: Based on 2012~2015 Korea National Health and Nutrition Examination Survey
Jee-Young Yeon, Yun-Jung Bae
Journal of Nutrition and Health.2017; 50(3): 257. CrossRef - The effect of coffee consumption on food group intake, nutrient intake, and metabolic syndrome of Korean adults—2010 KNHANES (V-1)
Fangfang Song, JiEun Oh, KyungWon Lee, Mi Sook Cho
NFS Journal.2016; 4: 9. CrossRef - Effect of Coffee Consumption on the Progression of Type 2 Diabetes Mellitus among Prediabetic Individuals
Ji-Ho Lee, Mi-Kyeong Oh, Jun-Tae Lim, Haa-Gyoung Kim, Won-Joon Lee
Korean Journal of Family Medicine.2016; 37(1): 7. CrossRef - Associations of Obesity and Dyslipidemia with Intake of Sodium, Fat, and Sugar among Koreans: a Qualitative Systematic Review
Yoon Jung Kang, Hye Won Wang, Se Young Cheon, Hwa Jung Lee, Kyung Mi Hwang, Hae Seong Yoon
Clinical Nutrition Research.2016; 5(4): 290. CrossRef - Survey on Body Image Perception, Dietary Habits and Nutrient Intakes according to Interest Level in Health of Female University Students in Gyeongnam Area
Eun-Hee Seo
The Korean Journal of Food And Nutrition.2015; 28(2): 281. CrossRef
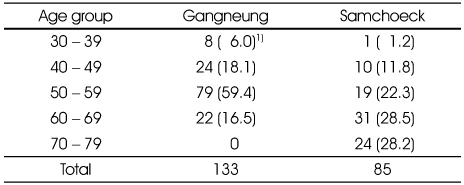
Age distribution of study subjects
1) N (%)
Anthropometric measurements and blood lipid of study subjects
1) Difference between coffee-mix drinkers and non-drinkers were calculated by ANCOVA (age, region adjusted).
2) Difference between men and women were calculated by ANCOVA (age, region adjusted).
3) Mean ± SE
Coffee-mix intake, frequency and nutrient intake from coffee-mix of study subjects
1) Difference between male and female were calculated by ANCOVA (age, sex adjusted).
2) Difference between Gangneung and Samchoeck(Total Group) were calculated by ANCOVA (age, sex adjusted).
3) Mean ± SE
Correlation coefficient between daily coffee-mix intake or its contribution to energy intake(%kcal) and anthropometric measurements and serum lipids(age, sex, region adjusted)
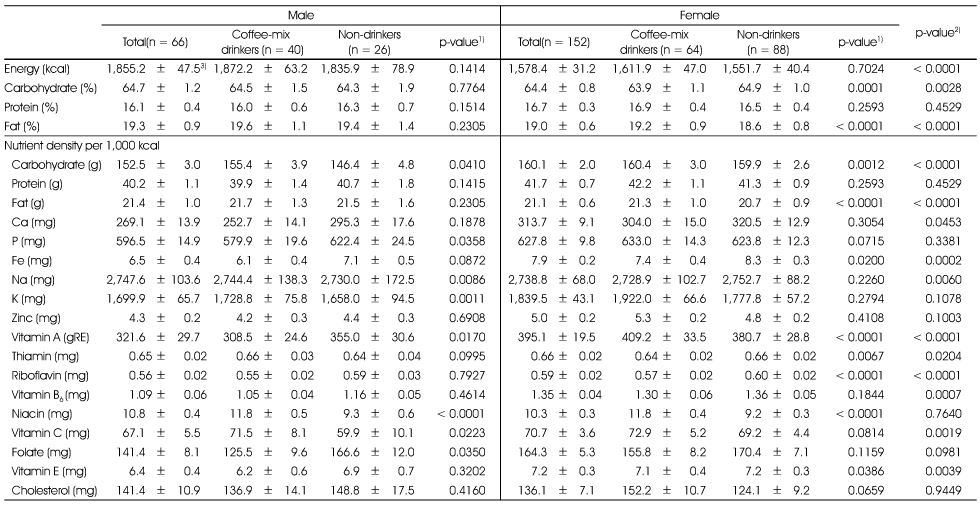
Energy intake and nutrient density according to coffee-mix intake
1) Difference between coffee-mix drinkers and non-drinkers were calculated by ANCOVA (age, region adjusted).
2) Difference between men and women were calculated by ANCOVA (age, region adjusted).
3) Mean ± SE
1) N (%)
1) Difference between coffee-mix drinkers and non-drinkers were calculated by ANCOVA (age, region adjusted). 2) Difference between men and women were calculated by ANCOVA (age, region adjusted). 3) Mean ± SE
1) Difference between male and female were calculated by ANCOVA (age, sex adjusted). 2) Difference between Gangneung and Samchoeck(Total Group) were calculated by ANCOVA (age, sex adjusted). 3) Mean ± SE
1) Difference between coffee-mix drinkers and non-drinkers were calculated by ANCOVA (age, region adjusted). 2) Difference between men and women were calculated by ANCOVA (age, region adjusted). 3) Mean ± SE

 KSCN
KSCN


 PubReader
 Cite
Cite


