
Articles
- Page Path
- HOME > Korean J Community Nutr > Volume 18(4); 2013 > Article
-
Original Article
- Food Habits and Dietary Behavior Related to Using Processed Food among Male College Students Residing in Dormitory and Self-boarding in Gangwon
- Mi-Hyun Kim, Hyun Kim, Woo Keun Lee, Soon Joo Kim, Jee-Young Yeon
-
Korean Journal of Community Nutrition 2013;18(4):372-385.
DOI: https://doi.org/10.5720/kjcn.2013.18.4.372
Published online: August 31, 2013
Department of Food and Nutrition, Kangwon National University, Samcheok, Korea.
1Nutrition Safety Policy Division, Food Nutrition and Dietary Safety Bureau, Ministry of Food and Drug Safety, Cheongwon-gun, Korea.
- Corresponding author: Yeon, Jee-Young, Nutrition Safety Policy Division, Food Nutrition and Dietary Safety Bureau, Ministry of Food and Drug Safety, Cheongwon-gun 363-700, Korea. Tel: (043) 719-2267, Fax: (043) 719-2250, yonwl@yahoo.co.kr
• Received: July 5, 2013 • Revised: August 12, 2013 • Accepted: August 13, 2013
Copyright © 2013 The Korean Society of Community Nutrition
This is an Open-Access article distributed under the terms of the Creative Commons Attribution Non-Commercial License (http://creativecommons.org/licenses/by-nc/3.0/) which permits unrestricted non-commercial use, distribution, and reproduction in any medium, provided the original work is properly cited.
- 448 Views
- 6 Download
- 32 Crossref
Abstract
- The purpose of this study was to examine food habits and dietary behavior related to using processed food among male college students residing in dormitory and self-boarding in Gangwon. A total of 344 students (dormitory group: 227, self-boarding group: 117) were surveyed from May to June of 2012. The results are summarized as follows: self-boarding group had a significantly higher frequency of skipping breakfast and lunch and frequency of out meal compared with the dormitory group (p < 0.05, p < 0.05, p < 0.05 respectively). The self-boarding group had a significantly lower the score of 'eat vegetables and Kimchi at every meal' (p < 0.001) and 'eat a variety of food everyday' (p < 0.001) compared with the dormitory group. The self-boarding group had a significantly higher the preference for meat products (p < 0.05) and canned food (p < 0.01) for selecting processed food compared with the dormitory group. The consideration for selecting processed food was ranked by 'taste', 'price', 'expiration', 'appearance' and 'nutrition' in both dormitory and the self-boarding group. In the dormitory group, nutrition labels were identified certainly 2.6%, sometimes 12.8%, and rarely 17.2%. In the self-boarding group, nutrition labels were identified certainly 1.7%, sometimes 18.0%, and rarely 24.8%. The necessity of nutrition education was high in both dormitory group (51.6%) and the self-boarding group (62.4%). Therefore, development of an educational program and application of the information from nutrition labels for male college students, especially self-boarding students will be effective in improving dietary life in order to maintain healthy dietary habits.
- 1. Bae YJ, Lee JC, Kim MH. Nutritioal status and dietary quality of college students by residing types in Samcheok. J Korean Diet Assoc 2007; 13(4): 311-330.
- 2. Bae YJ, Yeon JY. Dietary behaviors, processed food preferences and awareness levels of nutrition labels among female university students living in middle region by breakfast eating. J Korean Diet Assoc 2011; 17(4): 387-402.
- 3. Bolton-Smith C, Casey CE, Gey KF, Smith WC, Tunstall-Pedoe H. Antioxidant vitamin intakes assessed using a food-frequency questionnaire: correlation with biochemical status in smokers and non-smokers. Br J Nutr 1991; 65(3): 337-346.ArticlePubMed
- 4. Brevard PB, Ricketts CD. Residence of college students affects dietary intake, physical activity, and serum lipid levels. J Am Diet Assoc 1996; 96(1): 35-38.ArticlePubMed
- 5. Chang YK, Oh EJ, Sun YS. A study on the food habit & the health responses of college students to the todai health index. J Korean Home Econ Assoc 1988; 26(3): 43-51.
- 6. Choi JG, Shin MK, Seo ES. A study on self-evaluated obesity and food habits by residence type of college students in Ik-San area. J Korean Living Sci Assoc 2004; 13(1): 97-110.
- 7. Choi KS, Shin KO, Huh SM, Chung KH. Comparison of nutritional and physical status according to the residental type among college women in Seoul women's university and Sahmyook university. Korean J Nutr 2010; 43(1): 86-96.Article
- 8. Choi MK, Jun YS, Park MK. A study on eating patterns and nutrient intakes of college students by residences of self-boarding and home with parents in Chungnam. J Korean Diet Assoc 2000; 6(1): 9-16.
- 9. Han MJ, Cho HA. Dietary habit and perceived stress of college students in Seoul area. Korean J Diet Cult 1998; 13(4): 317-326.
- 10. Hwang JH, Lee HM. A study on lifestyles, dietary habits, nutrition knowledge and dietary behaviors of male university students according to residence type. Korean J Community Nutr 2007; 12(4): 381-395.
- 11. Jun YS, Choi MK, Kim MH. The effects of alcohol intake on nutritional intake status of college students in Chungnam. J Korean Diet Assoc 2002; 8(3): 240-249.
- 12. Jung HW, Jung LH. A study on use of processed food for high school students in Gwangju. Korean J Hum Ecol 2008; 11(1): 21-33.
- 13. Kim KH. A study of the dietary habits, the nutritional knowledge and the consumption patterns of convenience foods of university students in the Gwangiu area. Korean J Community Nutr 2003; 8(2): 181-191.
- 14. Kim MH, Jeong ES, Kim EJ, Chol HK, Bae YJ, Choi MK. Night eating status of university students in partial area of Chungnam. J East Asian Soc Diet Life 2011; 21: 563-576.
- 15. Kim K, Lee MJ, Kim JH, Shim YH. A study on weight control attempt and related factors among college female students. Korean J Community Nutr 1998; 3(1): 21-33.
- 16. Kim MH, Lee JC, Bae YS, Cho HK, Kim MH, Kim EY, Hong WJ, Sung SJ. Nutritional status and diet quality of female college students by living together with or without parents. J East Asian Soc Diet Life 2006; 16(6): 635-645.
- 17. Kim MS. A study on the eating behavior of the university students by type of residence in Taebaek city. J Korean Home Econ Assoc 2004; 42(10): 1-10.
- 18. Kim WY, Cho MS, Lee HS. Development and validation of mini dietary assessment index for Koreans. Korean J Nutr 2003; 36(1): 83-92.
- 19. Klesges RC, Eck LH, Isbell TR, Fulliton W, Hanson CL. Smoking status: effects on the dietary intake, physical activity, and body fat of adult men. Am J Clin Nutr 1990; 51(5): 784-789.ArticlePubMed
- 20. Korea Health Statistics [KHS]. Korea National Health and Nutrition Examination Survey (KNHANES V-2)(2011). 2012. p. 366. p. 368. p. 370. p. 387. p. 391.
- 21. Lee EJ. The effect of the middle school home economics curriculum on the students's perception of nutrition labels and their choice of processed food. Seoul, Korea: Dongguk University; 2008; MS Thesis.
- 22. Lee HS, Lee JA, Paik JJ. A study of food habits, physical status and related factors of college students in Chuncheon. Korean J Community Nutr 1998; 3(1): 34-43.
- 23. Lee IS, Choi BS, You DR, Park YM. College students characteristics and utilization of the nutrition labels on food package. Korean J Diet Cult 2002; 17(3): 299-308.
- 24. Lee MS, Woo MK. Changes in food habit, nutrition knowledge and nutrition attitude of university students during nutrition course. Korean J Nutr 1999; 32(6): 739-745.
- 25. Lee KA, Cho EJ, Yoon HS. A study on consumption of convenience foods of university students by residing types in Changwon and Masan area. J Korean Diet Assoc 2010; 16(3): 279-290.
- 26. Lee KJ, Lee YH. Consumer's recognition and using state about food-nutrition labeling system among twenties. J East Asian Soc Diet Life 2004; 14(1): 54-63.
- 27. Lee YN, Choi HM. A study on the relationship between body mass index and the food habits of college students. Korean J Diet Cult 1994; 9(1): 1-10.
- 28. Lee YN, Lee JS, Ko YM, Woo JS, Kim BH, Choi HM. Study on the food habits of college students by residences. Korean J Community Nutr 1996; 1(2): 189-200.
- 29. Lim YS, Park HR, Han GJ. Comparison of preference for convenience and dietary attitude in college students by sex in Seoul and Kyunggi-do area. J Korean Diet Assoc 2005; 11(1): 11-20.
- 30. McPhillips JB, Eaton CB, Gans KM, Derby CA, Lasater TM, McKenney JL, Carleton RA. Dietary differences in smokers and nonsmokers from two southeastern New England communities. J Am Diet Assoc 1994; 94(3): 287-292.ArticlePubMed
- 31. Misra R. Knowledge, attitudes, and label use among college students. J Am Diet Assoc 2007; 107(12): 2130-2134.ArticlePubMed
- 32. Park SS, Kim NY, Han MJ. Processed food preferences and food and nutrition labeling perceptions of middle school students. Korean J Food Cookery Sci 2008; 24(2): 164-173.
- 33. Satia JA, Galanko JA, Neuhouser ML. Food nutrition label use is associated with demographic, behavioral, and psychosocial factors and dietary intake among African-Americans in North Carolina. J Am Diet Assoc 2005; 105(3): 392-402.ArticlePubMed
- 34. The Korea National Statistical Office. Annual report on the cause of death statistics: based on vital registration. 2006.
- 35. Ryu ES. The study on the dietary behavior of university students in Busan area. Korean J Diet Cult 1993; 8(1): 43-54.
- 36. Yang J, Shon CM. Nutritional status and dietary quality by their residing types in college students. J Korean Living Sci Assoc 2009; 18(4): 959-970.Article
REFERENCES
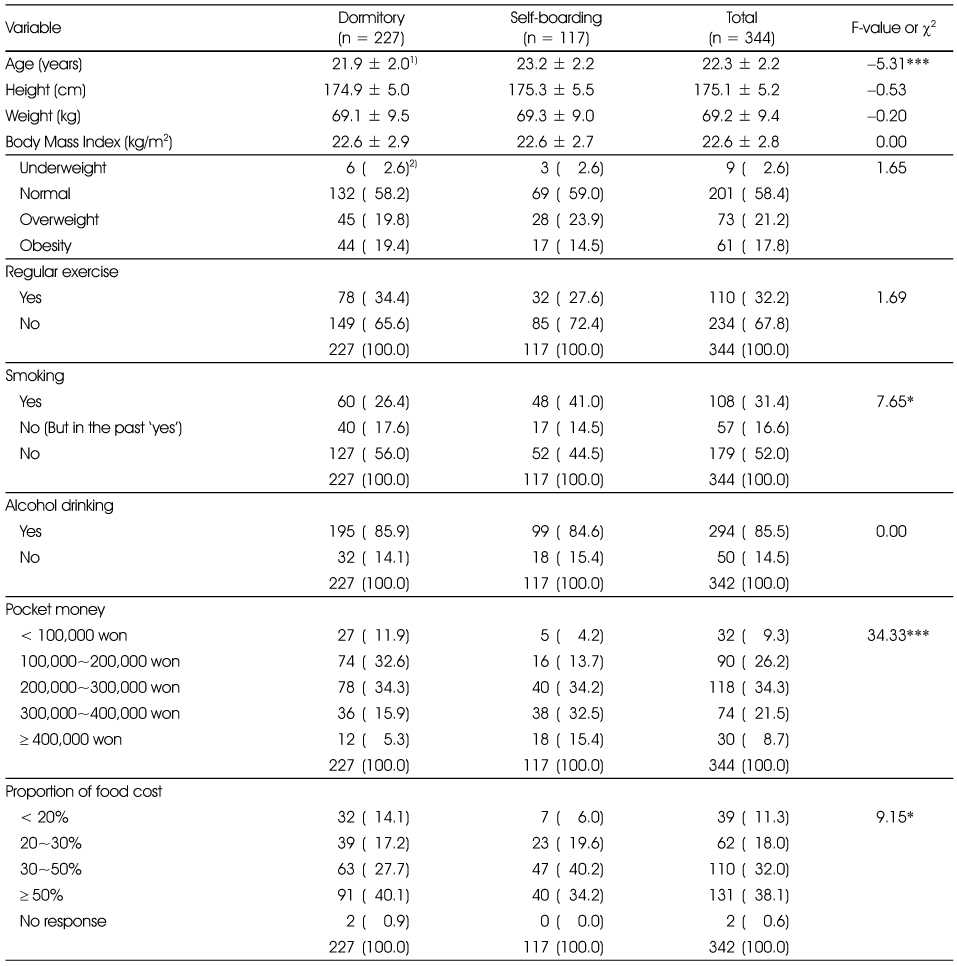
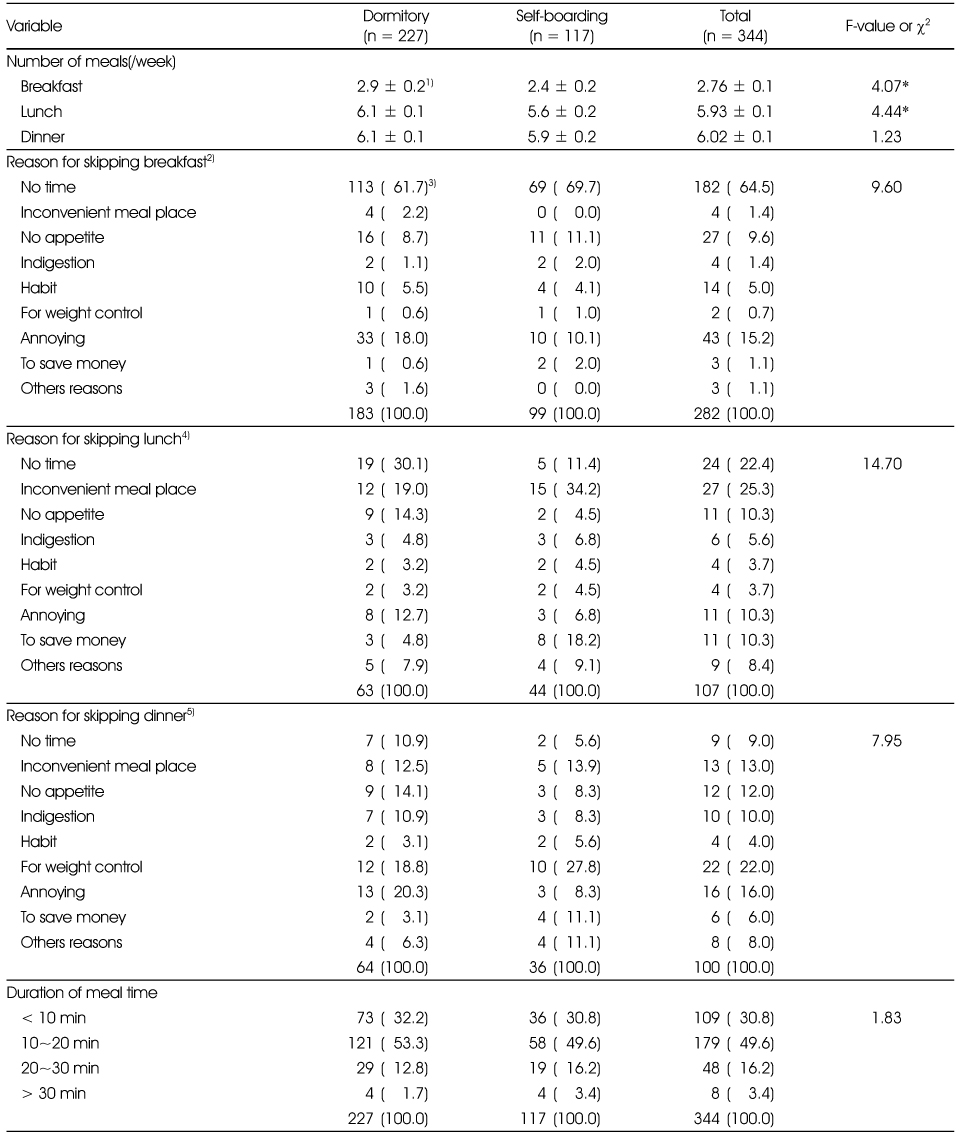

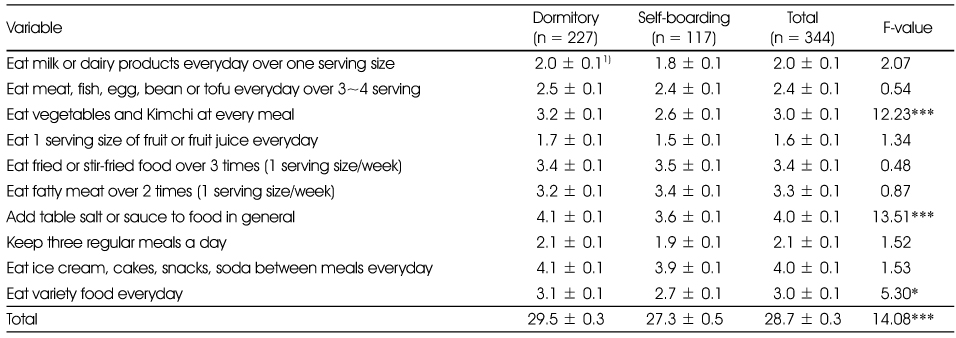


Figure & Data
REFERENCES
Citations
Citations to this article as recorded by 
- Differences in Nutritional Status According to the Residence Types among University Students in Gwangju
Geum-Bi Ryu, Young-Ran Heo
Journal of the Korean Society of Food Science and Nutrition.2024; 53(2): 207. CrossRef - Usage and Quality Satisfaction of Convenience Food at Convenience Stores according to the Eating Behavior of University Students in Southern Gyeonggi Province
Se-In Oh, Ok-Sun Kim
Journal of the East Asian Society of Dietary Life.2023; 33(6): 492. CrossRef - Sugar Intake and Perception of Sugar Reduction among University Students in Gwangju
Yeon-Ok Park
Journal of the Korean Society of Food Science and Nutrition.2023; 52(11): 1170. CrossRef - Application and effectiveness of a nutrition education program based on the 2020 Dietary Reference Intakes for Koreans for undergraduates in Gyeongsangnam-do and Gyeonggi-do
Mijoo Choi, Hyein Jung, Nayoung Kim, Sangah Shin, Taejung Woo, Eunju Park
Journal of Nutrition and Health.2023; 56(6): 730. CrossRef - Development of a campus-based intervention program to strengthen food literacy among university students: A qualitative formative study
Eunji Ko, Eunjin Jang, Jiwon Sim, Minjeong Jeong, Sohyun Park
Korean Journal of Community Nutrition.2023; 28(6): 495. CrossRef - Effect of Type of Nutrition Labeling on the Healthfulness Evaluation and Purchase Intentions of Home Meal Replacements (HMR) in South Korea
Mee-Young Joe
Korean Journal of Community Nutrition.2022; 27(5): 387. CrossRef - Actual Status of Mukbang Viewing and Food Habits of University Students in Wonju Area
Seung-Lim Lee, Sun Hee Lee
The Korean Journal of Community Living Science.2022; 33(4): 631. CrossRef - Association Between Health Literacy and Health Promoting Behavior (Eating Habits, Physical Activity, and Stress) of University Students
Yoon-Sun Kim
Korean Journal of Community Nutrition.2022; 27(2): 94. CrossRef - Analysis of Usage, Preference, and Satisfaction for Convenience
Store Dessert among University Students in Chungbuk Area
Go Eun Lee, Hye-In Yang, Yun-Jung Bae
Journal of Biotechnology and Bioindustry.2021; 9: 63. CrossRef - The Effect of Frequent Use of Convenience Food from Convenience Stores on the Diet Quality of Women’s University Students: Using the Nutrition Quotient for Korean Adults
Sun Hee Lee, Seung-Lim Lee
The Korean Journal of Community Living Science.2021; 32(4): 581. CrossRef - Change of dietary habits and the use of home meal replacement and delivered foods due to COVID-19 among college students in Chungcheong province, Korea
Mi-Hyun Kim, Jee-Young Yeon
Journal of Nutrition and Health.2021; 54(4): 383. CrossRef - Analysis of Dietary Behaviors, Food Consumption Frequency and Blood Clinical Indices by Residence Types of Female College Students in Seoul
Ru Zi Lee, Jung Hee Kim
Korean Journal of Community Nutrition.2019; 24(3): 183. CrossRef - Comparison of Dietary Behavior of Eating Alone in Single Households by Status of Workers and Age
Pil Kyoo Jo, Yu Jin Oh
Korean Journal of Community Nutrition.2019; 24(5): 408. CrossRef - Analysis of the Difference in Nutrients Intake, Dietary Behaviors and Food Intake Frequency of Single- and Non Single-Person Households: The Korea National Health and Nutrition Examination Survey (KNHANES), 2014–2016
Na-Yeon Kang, Bok-Mi Jung
Korean Journal of Community Nutrition.2019; 24(1): 1. CrossRef - Sleep Quality and Its Association with the Dietary Behavior and Lifestyle of University Students in Cheongju
Sewhan Jin, Munkyong Pae
Korean Journal of Community Nutrition.2019; 24(5): 395. CrossRef - Evaluation of the Nutrition Status and Metabolic Syndrome Prevalence of the Members according to the Number of Household Members based on the Korea National Health and Nutrition Examination Survey (2013–2014)
Jin-Young Lee, Soo-Kyong Choi, Jung-Sook Seo
Korean Journal of Community Nutrition.2019; 24(3): 232. CrossRef - Nutritional Evaluation of Convenience Meals in Convenience Stores near the Universities
Go-Na Shin, Yu-Ri Kim, Mi-Hyun Kim
Korean Journal of Community Nutrition.2017; 22(5): 375. CrossRef - Studies on Dietary Habits and Residence Students’ Satisfaction with University Dormitory Foodservice in Jeollabuk-do Iksan Area
Kyung-Jin Min, Il-Sook Choi
Journal of The Korean Society of Food Culture.2016; 31(5): 442. CrossRef - Comparison of Dietary Habits and Learning Flow According to Alcohol Drinking Status Among Male University Students in Jeonbuk Province
Sol Yoon, Mi Sung Kim, Cheong Min Sohn
Korean Journal of Human Ecology.2016; 25(3): 387. CrossRef - Relationship between thresholds and self-assessed preference for saltiness and sodium intake in young women
Eugene Shim, Yoon Jung Yang, Yoon Kyoun Yang
Journal of Nutrition and Health.2016; 49(2): 88. CrossRef - Dietary Habits and Perception Toward Food Additives according to the Frequency of Consumption of Convenience Food at Convenience Stores among University Students in Cheongju
Munkyong Pae
Korean Journal of Community Nutrition.2016; 21(2): 140. CrossRef - Lunch Eating Patterns and Dietary Habits of University Students according to Major Lunch Place
Hyunji Kim, Hongmie Lee
Journal of the Korean Dietetic Association.2016; 22(4): 261. CrossRef - Eating Habit and Stress Status according to Exercising Habits of Middle-Aged Adults in Chungnam
Se-Yune Kim, Yeon-Ja Seo, Mi-Hyun Kim, Mi-Kyeong Choi
The Korean Journal of Food And Nutrition.2016; 29(1): 43. CrossRef - Night Eating and Nutrient Intake Status according to Residence Type in University Students
Ye-Sook Jun, Mi-Kyeong Choi, Yun-Jung Bae
Journal of the Korean Society of Food Science and Nutrition.2015; 44(2): 216. CrossRef - Preference and the Frequency of Processed Food Intake according to the Type of Residence of College Students in Korea
Su-Jin Kim, So Young Bu, Mi-Kyeong Choi
Korean Journal of Community Nutrition.2015; 20(3): 188. CrossRef - Use and Awareness of Nutrition Labeling of Snacks based on One Serving Size among University Students in Chungbuk
Mi-Hyun Kim, Yeon Woo Lee, Hyewon Jung
The Korean Journal of Food And Nutrition.2015; 28(5): 858. CrossRef - Differences in Solo Eating Perceptions and Dietary Behaviors of University Students by Gender
Youngmee Lee, Yu Jin Oh, Wookyoun Cho, Pil Kyoo Jo
Journal of the Korean Dietetic Association.2015; 21(1): 57. CrossRef - Comparison of Processed Food Intake by Allowance Level in College Students in Chungnam
Yi-Yeong Kim, Su-Jin Kim, Mi-Kyeong Choi
Journal of the Korean Dietetic Association.2015; 21(4): 280. CrossRef - A Study on Sodium-related Dietary Attitude and Behaviors According to Sodium-related Nutrition Knowledge of University Students
Mi-Hyun Kim, Jee-Young Yeon, Jong Wook Kim, Jae-Eon Byun, So-Young Bu, Mi-Kyeong Choi, Yun-Jung Bae
Korean Journal of Community Nutrition.2015; 20(5): 327. CrossRef - Study on Sodium-related Dietary Attitude, Behaviors according to Practice of Dietary Guidelines of University Students
Yun-Jung Bae, Seung-Eun No, Jeong-Hwa Seo, Joo-Hee Son, Mi-Jin Lee, Da-Woon Jung
The Korean Journal of Food And Nutrition.2015; 28(3): 376. CrossRef - Energy Content Estimation by Collegians for Portion Standardized Foods Frequently Consumed in Korea
Jin Kim, Hee Jung Lee, Hyun Jung Lee, Sun Ha Lee, Jee-Young Yun, Mi-Kyeong Choi, Mi-Hyun Kim
Clinical Nutrition Research.2014; 3(1): 24. CrossRef - The Dietary and Late-night eating Behavior according to Residence Type of University Students in Daejeon
Huck Soon Joung, Nan Sook Koo
Korean Journal of Human Ecology.2014; 23(4): 721. CrossRef
 PubReader
 Cite
CiteFood Habits and Dietary Behavior Related to Using Processed Food among Male College Students Residing in Dormitory and Self-boarding in Gangwon
Food Habits and Dietary Behavior Related to Using Processed Food among Male College Students Residing in Dormitory and Self-boarding in Gangwon
General and lifestyle characteristics of the subjects
1) Mean ± SD
2) N (%)
*: p < 0.05, ***: p < 0.001 by F-test or χ2-test
Dietary habits of the subjects
1) Mean ± SD
2) Except for the subject that breakfast eat everyday
3) N (%)
4) Except for the subject that lunch eat everyday
5) Except for the subject that dinner eat everyday
All variables have been age-adjusted.
*: p < 0.05 by F-test or χ2-test
Frequency of out meal, snack and night-eating of the subjects
1) N (%)
*: p < 0.05, **: p < 0.01
Dietary assessment of the subjects
1) Mean ± SD
All variables have been age-adjusted.
*: p < 0.05, ***: p < 0.001
Preference and consideration factor for selecting processed food of the subjects
1) 1 = dislike very much, 5 = like very much
2) Mean ± SD
3) 1 = do not consider at all, 5 = certainly consider
All variables have been age-adjusted.
*: p < 0.05, **: p < 0.01
Use of processed food of the subjects
1) N (%)
Identification of nutrition labels on processed food by the subjects
1) N (%)
2) Except for the subject that not identify nutrition labels
3) Except for the subject that identify nutrition labels
Necessity of nutrition education and nutrition information related to the nutrition labels
1) N (%)
Table 1
General and lifestyle characteristics of the subjects
1) Mean ± SD 2) N (%) *: p < 0.05, ***: p < 0.001 by F-test or χ2-test
Table 2
Dietary habits of the subjects
1) Mean ± SD 2) Except for the subject that breakfast eat everyday 3) N (%) 4) Except for the subject that lunch eat everyday 5) Except for the subject that dinner eat everyday All variables have been age-adjusted. *: p < 0.05 by F-test or χ2-test
Table 3
Frequency of out meal, snack and night-eating of the subjects
1) N (%) *: p < 0.05, **: p < 0.01
Table 4
Dietary assessment of the subjects
1) Mean ± SD All variables have been age-adjusted. *: p < 0.05, ***: p < 0.001
Table 5
Preference and consideration factor for selecting processed food of the subjects
1) 1 = dislike very much, 5 = like very much 2) Mean ± SD 3) 1 = do not consider at all, 5 = certainly consider All variables have been age-adjusted. *: p < 0.05, **: p < 0.01
Table 6
Use of processed food of the subjects
1) N (%)
Table 7
Identification of nutrition labels on processed food by the subjects
1) N (%) 2) Except for the subject that not identify nutrition labels 3) Except for the subject that identify nutrition labels
Table 8
Necessity of nutrition education and nutrition information related to the nutrition labels
1) N (%)


