
Articles
- Page Path
- HOME > Korean J Community Nutr > Volume 18(6); 2013 > Article
-
Original Article
- Comparison of Salty Taste Assessment and High-Salt Dietary Behaviors among University Students and Chinese Students in Daegu, South Korea and University Students in Shenyang, China
- Lin Jiang, Yeon-Kyung Lee
-
Korean Journal of Community Nutrition 2013;18(6):555-564.
DOI: https://doi.org/10.5720/kjcn.2013.18.6.555
Published online: December 31, 2013
Department of Food Science and Nutrition, Kyungpook National University, Daegu, Korea.
- Corresponding author: Yeon-Kyung Lee, Department of Food Science and Nutrition, Kyungpook National University, Daegu 702-701, Korea. Tel: (053) 950-6234, Fax: (053) 950-6229, yklee@knu.ac.kr
• Received: September 27, 2013 • Revised: December 17, 2013 • Accepted: December 26, 2013
Copyright © 2013 The Korean Society of Community Nutrition
This is an Open-Access article distributed under the terms of the Creative Commons Attribution Non-Commercial License (http://creativecommons.org/licenses/by-nc/3.0/) which permits unrestricted non-commercial use, distribution, and reproduction in any medium, provided the original work is properly cited.
- 1,520 Views
- 2 Download
- 3 Crossref
Abstract
- The purpose of this study was to compare and analyze the assessment of salty taste and high-salt dietary behaviors of Korean university students and their Chinese counterparts. The researchers developed a taste assessment computer program focusing on preference for salty taste, and it was applied to 300 university students, including 100 Korean students, and 100 Chinese students in Daegu of South Korea, and 100 Chinese students in Shenyang of China (144 males and 156 females). The results of the taste assessment of Chinese and Korean university students are as follows. Among males, Koreans (36.0%), Chinese students in Korea (36.2%), and Chinese (40.4%) scored highest in the "a bit salty" followed by "normal." Among females, Koreans (36.0%), Chinese students in Korea (49.1%), and Chinese (28.3%) scored highest in the "normal". In terms of salt concentration in solution, among the male subjects, most Koreans favored the salt concentration of 0.31%, which is considered to be a "normal" concentration; most Chinese students in Korea favored 0.63%, which is considered to be "a bit salty", and most Chinese favored the concentration of 1.25%, which is considered to be "salty". As for the female subjects, Koreans, Chinese students studying abroad, and Chinese favored 0.31%, the "normal" level of concentration. Korean students scored higher than Chinese students in Korea and Chinese students both in males and females (p < 0.001, p < 0.01), in terms of high-salt dietary behaviors favored salty taste. This study suggests that Chinese university students need nutrition education in terms of modifying eating behaviors to reduce dietary salt intake.
- 1. Ahn EJ, Noh HY, Chung J, Paik HY. The effect of zinc status on salty taste acuity, salty taste preference, sodium intake and blood pressure in Korean young adults. Korean J Nutr 2010; 43(2): 132-140.Article
- 2. Berthoud HR, Lenard NR, Shin AC. Food reward, hyperphagia, and obesity. Am J Physiol Regul Integr Comp Physiol 2011; 300(6): R1266-R1277.ArticlePubMedPMC
- 3. Blaustein MP, Hamlyn JM. Role of natriuretic factor in essential hypertension : an hypothesis. Ann Intern Med 1983; 98(5 pt 2): 785-792.ArticlePubMed
- 4. Chang SO. Effect of a 6-month low sodium diet on the salt taste perception and pleasantness, blood pressure and the urinary sodium excretion in female college student. Korean J Nutr 2010; 43(5): 433-442.Article
- 5. China National Health and Nutrition Examination Survey. 2004; cited 2013 Aug 29]. Available from http://wenku.baidu.com/link?url=bWjMOoG8QdNUp4OjTulwpsKja2RW8ZjqujEnF0sFwSpc-KzE203LFWRvd_yW6PUVbVoB_Jb8eoF6NwQHhvkIVeFtDa5ytOFtHe4BnX_Cila.
- 6. Cho MK. Development of education materials for lowing sodium intake and analysis of educational effects for elementary students. Changwon University; 2007; MS Thesis.
- 7. Choi BS, Kim EJ, Park YS. Study on sodium intake and preference for salty taste in college women. J Korean Soc Food Sci Nutr 1997; 26(1): 154-160.
- 8. Chung EJ, Shim E. Salt-related dietary behaviors and sodium intakes of university students in Gyeonggi-do. J Korean Soc Food Sci Nutr 2008; 37(5): 578-588.Article
- 9. David G, Laing J, Bell GA, Gillmore R, Catherine J, John Best D, Allen S, Yoshida M, Yamazaki K. A cross-cultural study of taste discrimination with Australians and Japanese. Chem Senses 1993; 18(2): 161-168.Article
- 10. Department of Health. Choosing health: making health choices easier. UK: 2004.
- 11. Jung YY, Shin EK, Lee HJ, Lee NH, Chun BY, Ann MY, Lee YK. Development and evaluation of nutrition education program on sodium reduction in elementary school students. Korean J Community Nutr 2009; 14(6): 746-755.
- 12. Katz DB, Simon SA, Nicolelis MA. Dynamic and multimodal responses of gustatory cortical neurons in awake rats. J Neurosci 2001; 21(12): 4478-4489.ArticlePubMedPMC
- 13. Kim HH, Shin EK, Ann MY, Lee YK. Evaluation of the effectiveness of a salt reduction program for employees. Korean J Nutr 2009; 42(4): 350-357.Article
- 14. Kim HH, Shin EK, Lee HJ, Lee NH, Chun BY, Ahn MY, Lee YK. Analysis by delphi survey of a preformance evaluation indec for a salt reduction project. Korean J Nutr 2009; 42(5): 486-495.Article
- 15. Kim HH, Jung YY, Lee YK. A Comparison of salty taste assessments and dietary attitudes and dietary behaviors associated with high-salt diets in four regions in Korea. Korean J Community Nutr 2012; 17(1): 38-48.Article
- 16. Kim YS, Paik HY. Measurement of Na intake in Korean adult female. Korean J Nutr 1987; 20(5): 341-349.
- 17. Korea Health Statistics. Korea National Health and Nutrition Examination Survey (KNHANES V-2). 2011. p. 415. p. 296.
- 18. Korean Health Promotion Foundation. Press release. "Eat less salty food! We can do it. The direction of Korean salt reduction project. 2012. p. 10.
- 19. Kwon CS, Jang HS. A study on the nutritional knowledge, food habits, food preferences and nutrient intakes of rural housewives. J East Asian Soc Diet Life 1994; 4: 31-40.
- 20. Laatikainen T, Pietinen P, Valsta L, Sundvall J, Reinivuo H, Tuomilehto J. Sodium in the Finnish diet: 20-year trends in urinary sodium excretion among the adult population. Eur J Clin Nutr 2006; 60(8): 965-970.ArticlePubMedPDF
- 21. Law MR, Frost CD, Wald NJ. By how much does dietary salt reduction lower blood pressure: analysis of observational data among populations. BMJ 1991; 302(6780): 811-815.ArticlePubMedPMC
- 22. Lee KH. Comparisons of functional brain mapping in sensory and affective aspects following taste stimulation. Korean J Sci Emot Sensibility 2012; 15(4): 585-592.
- 23. Lee YK, Shin EK, Lee HJ. Salty taste assessment tool. Patent 10-2007-0116957. 2007.
- 24. Lee YK, Jung YY, Jiang L. Development of computer program for salty taste assessment. 2012. C-2012-010586.
- 25. Lee YK, Son SM, Lee JJ, Lee HJ, Shin EK, Park MJ. A study on a scheme to reduce sodium intake, report of management center for health promotion. Report of Korean Health Promotion Center. 2007.
- 26. Liu LS, Xie JX, Fang WQ. Urinary cations and blood pressure: a collaborative study of 16 districts in China. J Hypertens Suppl 1988; 6(4): S587-S590.PubMed
- 27. Ministry of Food and Drug Safety. A new story about sugar, a sodium story for me - teachers' guide. 2008.
- 28. Nam HW, Lee KY. A study on the sodium and potassium intakes and their metabolism of the pregnant women in Korea. Korean J Nutr 1985; 18(3): 194-200.
- 29. National Bureau of Statistics of China. Death rate and composition by cause of major diseases in urban and rural areas. 2009; cited 2013 Aug 29]. Available from http://data.stats.gov.cn/workspace/index?a=q&type=global&dbcode=hgnd&m=hgnd&dimension=zb&code=A0O0G020J®ion=000000&time=2009,2009.
- 30. Ogawa H, Ito S, Murayama N, Hasegawa K. Taste area in granular and dysgranular insular cortices in the rat identified by stimulation of the entire oral cavity. Neurosci Res 1990; 9(3): 196-201.ArticlePubMed
- 31. Park HJ, Kwak EJ, Cho MH, Lee KH. A cross-cultural study of the awareness and the preference on salinity among the Northest Asians. J East Asian Soc Diet Life 2009; 19(4): 525-532.
- 32. Intersalt Cooperative Research Group. Intersalt: an international study of electrolyte excretion and blood pressure. Results for 24 hour urinary sodium and potassium excretion. BMJ 1988; 297: 319-328.ArticlePubMedPMC
- 33. Shin EK, Lee HJ, Ahn MY, Lee YK. Study on the development and evaluation of validity of salty taste assessment tool. Korean J Nutr 2008; 41(2): 184-191.
- 34. Shin EK, Lee HJ, Jun SY, Park EJ, Jung YY. Development and evaluation of nutrition education program for sodium reduction in foodservice operations. Korean J Community Nutr 2008; 13(2): 216-227.
- 35. Shin EK, Lee HJ, Lee JJ, Ann MY, Son SM, Lee YK. Estimation of sodium intake of adult female by 24-hour urine analysis, dietary records and dish frequency questionnaire (DFQ 55). Korean J Nutr 2010; 43(1): 79-85.
- 36. Smith DV, St John SJ. Neural coding of gustatory information. Curr Opin Neurobiol 1999; 9(4): 427-435.PubMed
- 37. Son SM, Park YS, Lim WJ, Kim SB, Jeong YS. Sodium intakes of Korean adults with 24-hour urine analysis and dish frequency questionnaire and comparison of sodium intakes according to the regional area and dish group. Korean J Community Nutr 2007; 12(5): 545-558.
- 38. Song MR, Lee KJ. Salinity and consumption patterns of kimchi and soup, stew in Jeonju area. Korean J Food Cookery Sci 2008; 24(1): 84-91.
- 39. Stapleton JR, Lavine ML, Wolpert RL, Nicolelis MA, Simon SA. Rapid taste responses in the gustatory cortex during licking. J Neurosci 2006; 26(15): 4126-4138.PubMedPMC
- 40. Verhagen JV, Kadohisa M, Rolls ET. Primate insular/opercular taste cortex: neuronal representations of the viscosity, fat texture, grittiness, temperature, and taste of foods. J Neurophysiol 2004; 92(3): 1685-1699.PubMed
- 41. Xie JX, Hao JS, Liu LS. Relationship between urinary electroytes and blood pressure in 16 regions of China. Chin J Hypertens 2002; 10(2): 172-175.
- 42. Yamamoto T, Matsuo R, Kiyomitsu Y, Kitamura R. Taste responses of cortical neurons in freely ingesting rats. J Neurophysiol 1989; 61(6): 1244-1258.PubMed
- 43. Yim JE, Cho MR, Yin CS, Seo BK, Koh HG, Choue RW. Nutrients and salt consumption of hypertension patients according to treatment status. Korean J Nutr 2005; 38(9): 706-716.
- 44. Yoon HS, Choi YS, Lee KH. Nutrition knowledge, dietary habits and nutrition attitudes of elementary and middle schoolteachers in Masan city. J Korean Soc Food Sci Nutr 2002; 31(1): 160-169.
REFERENCES
Fig. 1
Comparison of salty taste assessment scores between Korean university students and Chinese university students.
Chinese 1: Chinese living in Korea, Chinese 2: Chinese living in China
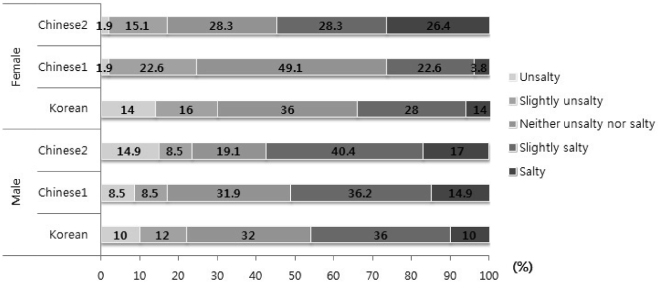
Table 1Anthropometric characteristics of Korean and Chinese groups
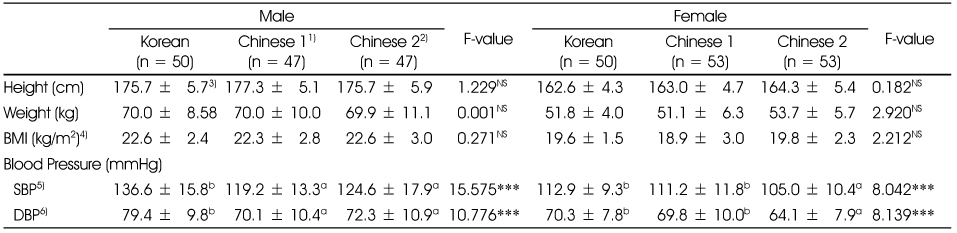
1) Chinese 1: Chinese living in Korea
2) Chinese 2: Chinese living in China
3) Mean ± SD
4) BMI: Body Mass Index, [weight(kg)/height(m2)
5) SBP: Systolic Blood Pressure
6) DBP: Diastolic Blood Pressure
***: p < 0.001
ab: Values with the different small letter are significantly different among 3 groups by Duncan's multiple range test at p < 0.001
NS: not significant
Table 2Comparison of the intensity1) of saltiness between male and female groups
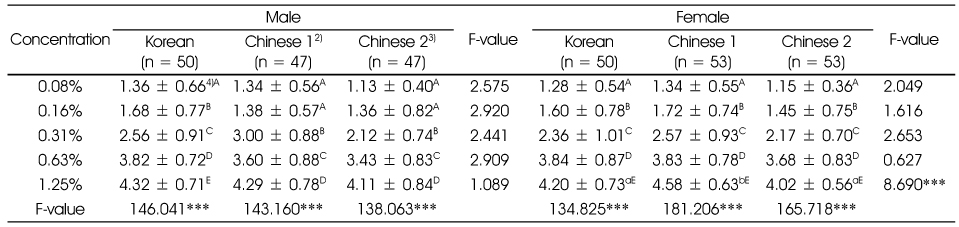
1) Unsalty; 1, slightly unsalty; 2, neither unsalty nor salty; 3, slightly salty; 4, salty; 5
2) Chinese 1: Chinese living in Korea
3) Chinese 2: Chinese living in China
4) Mean ± SD
***: p < 0.001
ABC: Values with the different capital letter are significantly different among concentrations by Duncan's multiple range test at p < 0.001.
ab: Values with the different small letter are significantly different among 3 groups by Duncan's multiple range test at p < 0.001.
Table 3Comparison of taste preference1) between male and female groups
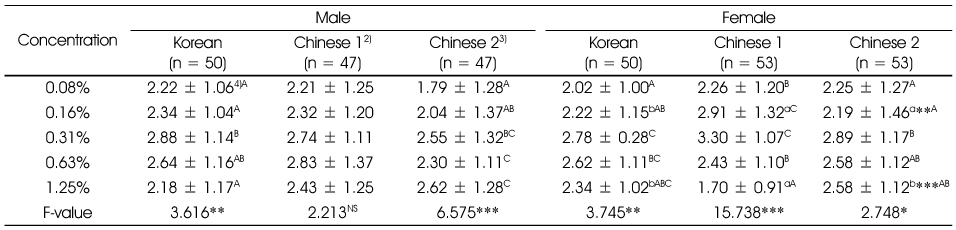
1) Dislike; 1, Slightly dislike; 2, Ordinary; 3, Sightly like; 4, Like; 5
2) Chinese 1: Chinese living in Korea
3) Chinese 2: Chinese living in China
4) Mean ± SD
**: p < 0.01, ***: p < 0.001
ABC: Values with the different capital letter are significantly different among concentrations by Duncan's multiple range test at p < 0.001.
abc: Values with the different small letter are significantly different among 3 groups by Duncan's multiple range test at p < 0.001.
Table 4Comparison of high-salt eating behavior related to salty foods between Korean and Chinese groups
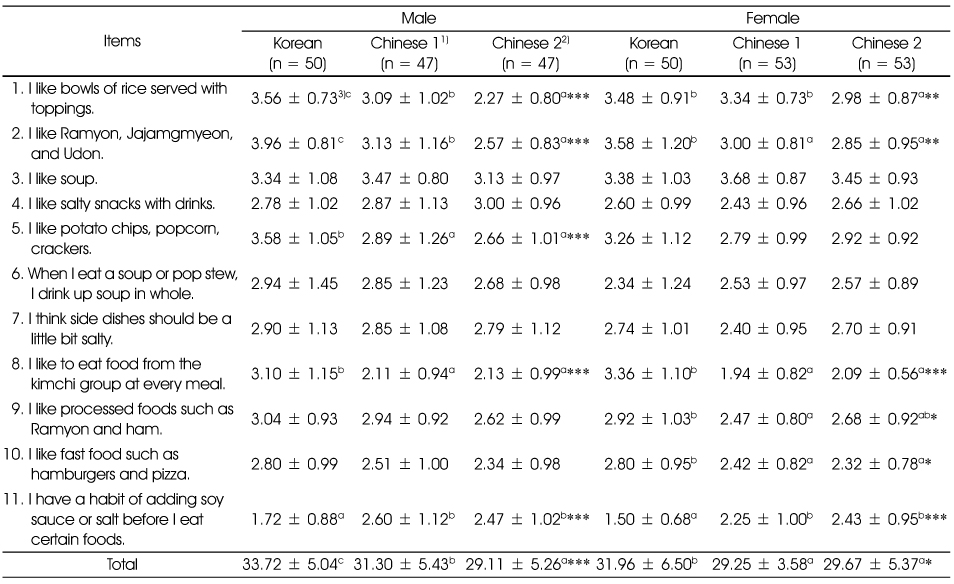
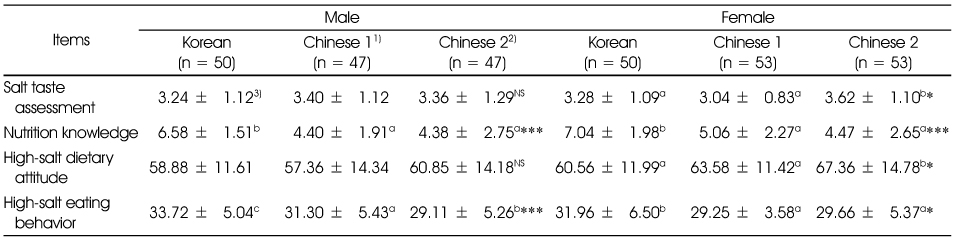
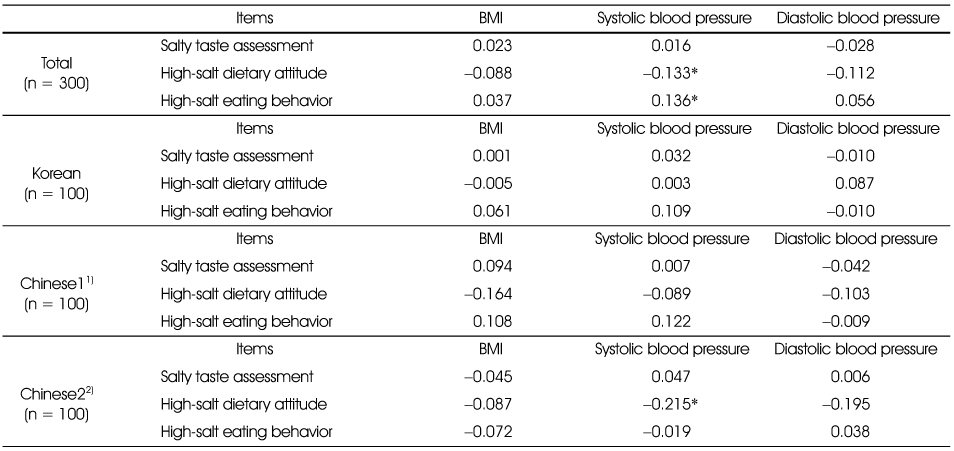
Figure & Data
REFERENCES
Citations
Citations to this article as recorded by 
- Comparison of Sodium-Related Dietary Behavior and Low-Salt Dietary Attitude Based on the Gender and Salty Taste Assessment of Chinese International Students in the Jeonbuk Area
Qi Li, Ji Eun Lee, Jeong Ok Rho
Journal of the East Asian Society of Dietary Life.2021; 31(2): 91. CrossRef - Comparison Study of Dietary Behavior, Nutrition Knowledge, and Body Weight Perception of Female High School Students in Jeonju, Korea and Jinan, China
Eun-Jung Joo, Eun-Sook Park
Korean Journal of Human Ecology.2016; 25(1): 121. CrossRef - Correlations Among Threshold and Assessment for Salty Taste and High-salt Dietary Behavior by Age
Lin Jiang, Yun-Young Jung, Yeon-Kyung Lee
Korean Journal of Community Nutrition.2016; 21(1): 75. CrossRef
 Cite
CiteComparison of Salty Taste Assessment and High-Salt Dietary Behaviors among University Students and Chinese Students in Daegu, South Korea and University Students in Shenyang, China

Fig. 1
Comparison of salty taste assessment scores between Korean university students and Chinese university students.
Chinese 1: Chinese living in Korea, Chinese 2: Chinese living in China
Fig. 1
Comparison of Salty Taste Assessment and High-Salt Dietary Behaviors among University Students and Chinese Students in Daegu, South Korea and University Students in Shenyang, China
Anthropometric characteristics of Korean and Chinese groups
1) Chinese 1: Chinese living in Korea
2) Chinese 2: Chinese living in China
3) Mean ± SD
4) BMI: Body Mass Index, [weight(kg)/height(m2)
5) SBP: Systolic Blood Pressure
6) DBP: Diastolic Blood Pressure
***: p < 0.001
ab: Values with the different small letter are significantly different among 3 groups by Duncan's multiple range test at p < 0.001
NS: not significant
Comparison of the intensity1) of saltiness between male and female groups
1) Unsalty; 1, slightly unsalty; 2, neither unsalty nor salty; 3, slightly salty; 4, salty; 5
2) Chinese 1: Chinese living in Korea
3) Chinese 2: Chinese living in China
4) Mean ± SD
***: p < 0.001
ABC: Values with the different capital letter are significantly different among concentrations by Duncan's multiple range test at p < 0.001.
ab: Values with the different small letter are significantly different among 3 groups by Duncan's multiple range test at p < 0.001.
Comparison of taste preference1) between male and female groups
1) Dislike; 1, Slightly dislike; 2, Ordinary; 3, Sightly like; 4, Like; 5
2) Chinese 1: Chinese living in Korea
3) Chinese 2: Chinese living in China
4) Mean ± SD
**: p < 0.01, ***: p < 0.001
ABC: Values with the different capital letter are significantly different among concentrations by Duncan's multiple range test at p < 0.001.
abc: Values with the different small letter are significantly different among 3 groups by Duncan's multiple range test at p < 0.001.
Comparison of high-salt eating behavior related to salty foods between Korean and Chinese groups
1) Chinese 1: Chinese living in Korea
2) Chinese 2: Chinese living in China
3) Mean ± SD
*: p < 0.05, **: p < 0.01, ***: p < 0.001
abc: Values with the different letter are significantly different among 3 groups by Duncan's multiple range test at p < 0.001
Comparison of the salty taste assessment, nutrition knowledge, high-salt dietary attitude and high-salt dietary behaviors between Korean and Chinese students groups
1) Chinese 1: Chinese living in Korea
2) Chinese 2: Chinese living in China
3) Mean ± SD
*: p < 0.05, ***: p < 0.001
abc: Values with the different letter are significantly different among 3 groups by Duncan's multiple range test at p < 0.001
NS: not significant
Correlation between salty taste assessment, BMI, systolic blood pressure, diastolic blood pressure, high-salt dietary attitude, and high-salt dietary behaviors
1) Chinese 1: Chinese living in Korea
2) Chinese 2: Chinese living in China
*: p < 0.05
Table 1
Anthropometric characteristics of Korean and Chinese groups
1) Chinese 1: Chinese living in Korea 2) Chinese 2: Chinese living in China 3) Mean ± SD 4) BMI: Body Mass Index, [weight(kg)/height(m2) 5) SBP: Systolic Blood Pressure 6) DBP: Diastolic Blood Pressure ***: p < 0.001 ab: Values with the different small letter are significantly different among 3 groups by Duncan's multiple range test at p < 0.001 NS: not significant
Table 2
Comparison of the intensity1) of saltiness between male and female groups
1) Unsalty; 1, slightly unsalty; 2, neither unsalty nor salty; 3, slightly salty; 4, salty; 5 2) Chinese 1: Chinese living in Korea 3) Chinese 2: Chinese living in China 4) Mean ± SD ***: p < 0.001 ABC: Values with the different capital letter are significantly different among concentrations by Duncan's multiple range test at p < 0.001. ab: Values with the different small letter are significantly different among 3 groups by Duncan's multiple range test at p < 0.001.
Table 3
Comparison of taste preference1) between male and female groups
1) Dislike; 1, Slightly dislike; 2, Ordinary; 3, Sightly like; 4, Like; 5 2) Chinese 1: Chinese living in Korea 3) Chinese 2: Chinese living in China 4) Mean ± SD **: p < 0.01, ***: p < 0.001 ABC: Values with the different capital letter are significantly different among concentrations by Duncan's multiple range test at p < 0.001. abc: Values with the different small letter are significantly different among 3 groups by Duncan's multiple range test at p < 0.001.
Table 4
Comparison of high-salt eating behavior related to salty foods between Korean and Chinese groups
1) Chinese 1: Chinese living in Korea 2) Chinese 2: Chinese living in China 3) Mean ± SD *: p < 0.05, **: p < 0.01, ***: p < 0.001 abc: Values with the different letter are significantly different among 3 groups by Duncan's multiple range test at p < 0.001
Table 5
Comparison of the salty taste assessment, nutrition knowledge, high-salt dietary attitude and high-salt dietary behaviors between Korean and Chinese students groups
1) Chinese 1: Chinese living in Korea 2) Chinese 2: Chinese living in China 3) Mean ± SD *: p < 0.05, ***: p < 0.001 abc: Values with the different letter are significantly different among 3 groups by Duncan's multiple range test at p < 0.001 NS: not significant
Table 6
Correlation between salty taste assessment, BMI, systolic blood pressure, diastolic blood pressure, high-salt dietary attitude, and high-salt dietary behaviors
1) Chinese 1: Chinese living in Korea 2) Chinese 2: Chinese living in China *: p < 0.05


