
Articles
- Page Path
- HOME > Korean J Community Nutr > Volume 18(6); 2013 > Article
-
Original Article
- Blood Pressure, Sodium Intake and Dietary Behavior Changes by Session Attendance on Salt Reduction Education Program for Pre-hypertensive Adults in a Public Health Center
- Eun-Jin Jung, Jong-Sook Kwon, So-Hyun Ahn, Sook Mee Son
-
Korean Journal of Community Nutrition 2013;18(6):626-643.
DOI: https://doi.org/10.5720/kjcn.2013.18.6.626
Published online: December 31, 2013
Department of Food Science & Nutrition, The Catholic University of Korea, Bucheon, Korea.
1Department of Food & Nutrition, Shingu College, Songnam, Korea.
- Corresponding author: Sook Mee Son, Department of Food Science & Nutrition, The Catholic University of Korea, 43 Jibong-ro, Womi-gu Bucheon-Si, Gyeonggi-do 420-743, Korea. Tel: (02) 2164-4318, Fax: (02) 2164-4310, sonsm@catholic.ac.kr
• Received: August 19, 2013 • Revised: October 31, 2013 • Accepted: November 13, 2013
Copyright © 2013 The Korean Society of Community Nutrition
This is an Open-Access article distributed under the terms of the Creative Commons Attribution Non-Commercial License (http://creativecommons.org/licenses/by-nc/3.0/) which permits unrestricted non-commercial use, distribution, and reproduction in any medium, provided the original work is properly cited.
- 1,131 Views
- 2 Download
- 10 Crossref
Abstract
- This study was performed to evaluate the differences in blood pressure, sodium intake and dietary behavior changes according to the extent of session attendance on sodium reduction education program for pre-hypertensive adults in a public health center. Sodium reduction education program consisted of 8 sessions for 8 weeks. Fifty three patients who completed the pre and post nutritional assessments were classified into 2 groups according to the session attendance rate. Nineteen participants who attended the education program 3 times or less (≤ 3) were categorized into the less attendance (LA) group and 34 participants attended 4 times or more (≥ 4) into the more attendance (MA) group. Blood pressure, anthropometric measurements, serum lipid profile, nutrient intakes including sodium, nutrition knowledge and dietary behavior score were assessed before and after the nutrition education program. Mean sodium intakes (p < 0.001), systolic/diastolic blood pressure (p < 0.001), and weight (p < 0.001) were significantly decreased in the MA group after sodium reduction education program. Compared to the MA group, mean sodium intakes, systolic/diastolic blood pressure were not significantly changed after the education program even with significantly increased nutrition knowledge (p < 0.05) and dietary behavior score (p < 0.01) in the LA group. It appears that pre-hypertensive adults need to attend the sodium reduction education program for at least 4 times or more to gain beneficial effects from the intervention. Positive feedback of healthcare team or offering more cooking classes may be needed to raise the attendance rate in the sodium reduction education program.
- 1. Ard JD, Svetkey LP. Diet and blood pressure: Applying the evidence to clinical practice. Am Heart J 2005; 149(5): 804-812.ArticlePubMed
- 2. Beauchamp GK, Engelman K. High salt intake. Sensory and behavioral factors. Hypertension 1991; 17: 1 Suppl. I176-I181.ArticlePubMed
- 3. Blaustein MP, Hamlyn JM. Pathogenesis of essential hypertension : A link between dietary salt and high blood pressure. Hypertension 1991; 18(5 Suppl): III184-III195.ArticlePubMed
- 4. Carvalho JM, Baruzzi RG, Howard PF, Poulter N, Alpers MP, Franco LJ, Marcopito LF, Spooner VJ, Dyer AR, Elliott P, Stamler J, Stamler R. Blood presure in four remote populations in the INTERSALT study. Hypertension 1989; 14: 238-246.ArticlePubMed
- 5. Cutler JA, Follmann D, Allender PS. Randomized trials of sodium reduction: an overview. Am J Clin Nutr 1997; 65: 2 Suppl. 643S-651S.ArticlePubMed
- 6. De Wardener HE, MacGregor GA. Harmful effects of the dietary salt in addition to hypertension. J Human Hypertens 2002; 16: 213-223.
- 7. Evers SE, Bass M, Donner A, McWhinney IR. Lack of impact of salt restriction advice on hypertensive patients. Prev Med 1987; 16: 213-220.ArticlePubMed
- 8. Fielding JE. Effectiveness of employee health improvement programs. J Occup Med 1982; 24: 907-916.PubMed
- 9. Huff LS, Zitterman L, DeAlleaume L, Bernstein J, Chavez R, Sutte C, LeBlanc WG, Parnes B. What keeps patients from adhering to home blood pressure program. J Am Board Fam Med 2011; 24(4): 370-379.PubMed
- 10. Jung YY, Shin EK, Lee HJ, Lee NH, Chun BY, Ann MY, Lee YK. Development and evaluation of nutrition education program on sodium reduction in elementary school students. Korean J Community Nutr 2009; 14(6): 746-755.
- 11. Jung EJ, Son SM, Kwon JS. The effect of sodium reduction program of a public health center on blood pressure, blood biochemical profile and sodium intake of hypertensive adults. Korean J Community Nutr 2012; 17(6): 752-771.Article
- 12. Kearney PM, Whelton M, Reynolds K, Muntner P, Whelton PK, He J. Global burden of hypertension: analysis of worldwide data. Lancet 2005; 365(9455): 217-223.ArticlePubMed
- 13. Kim YS, Paik HY. Measurement of Na intake in Korean adult females. Korean J Nutr 1987; 20(5): 341-349.
- 14. Kolasa KM. Summary of the JNC 7 guidelines for the prevention and treatment of high blood pressure. J Nutr Educ Behav 2003; 35(5): 226-227.ArticlePubMed
- 15. Luft FC, Morris CD, Weinberger MH. Compliance to a low salt diet. Am J Clin Nutr 1997; 65: suppl. 698S-703S.ArticlePubMed
- 16. Mattes RD. The taste for salt in humans. Am J Clin Nutr 1997; 65: suppl. 692S-697S.ArticlePubMed
- 17. Ministry of Health and Welfare. Korea Centers for Disease Contol and Prevention. Korea health statistics 2010: Korea National Health and Nutrition Examination Survey (KNHANES V-1 2010). 2011.
- 18. Moon EH. Implementation and evaluation of nutrition education program for hypertensive patients among adults aged 50 and over. Seoul Women's University; 2005; 18-53 MS thesis.
- 19. Moon EH, Kim KW. Evaluation of nutrition education for hypertension patients aged 50 years and over. Korean J Community Nutr 2011; 16(1): 62-74.Article
- 20. Obarzanek E, Sacks FM, Vollmer WM. Effects of blood lipids of a blood pressure-lowering diet: the dietary approaches to stop hypertension (DASH) trial. Am J Clin Nutr 2001; 74: 80-89.PubMed
- 21. Park YS, Son SM, Lim WJ, Kim SB, Chung YS. Comparison of dietary behaviors related to sodium intake by gender and age. Korean J Community Nutr 2008; 13(1): 1-12.
- 22. Ruppert M, Diehl J, Kolloch R, Overlack A, Kratf K, Gobel B, Hitte N, Stumpe KO. Short term dietary sodium restriction increases serum lipids and insulin in salt-sensitive and salt resistant normotensive adults. Klin Wochenschr 1991; 69: Suppl 25. 51-57.PubMed
- 23. Sacks FM, Svetkey LP, Vollmer WM, Appel LJ, Bray GA, Harsha D, Obarzanek E, Conlin PR, Miller ER, Simons-Morton D. Effects on blood pressure of reduced dietary sodium and the dietary approaches to stop hypertension (DASH) diet. N Engl J Med 2001; 344: 3-10.ArticlePubMed
- 24. Shin EK, Lee HJ, Jun SY, Park EJ, Jung YY, Ahn MY, Lee YK. Development and evaluation of nutrition education program for sodium reduction in food service operations. Korean J Community Nutr 2008; 13(2): 216-227.
- 25. Son SM, Huh GY, Lee HS. Development and evaluation of validity of dish frequency questionnaire (DFQ) and short DFQ using Na index for estimation of habitual sodium intake. Korean J Community Nutr 2005; 10(5): 677-692.
- 26. Son SM, Huh GY. Dietary risk factors associated with hypertension in patients. Korean J Community Nutr 2006; 11(5): 661-672.
- 27. Son SM, Park YS, Lim HJ, Kim SB, Jeong YS. Pilot study for low salt consumption projects for Korean people. Ministry of Health & Welfare; 2006.
- 28. Son SM, Park YS, Lim HJ, Kim SB, Jeong YS. Sodium intakes of Korean adults with 24-hour urine analysis and dish frequency questionnaire and comparison of sodium intakes according to the regional area and dish group. Korean J Community Nutr 2007; 12(5): 545-558.
- 29. Song DY, Park JE, Shim JE, Lee JE. Trends in the major dish groups and food groups contributing to sodium intake in the Korea national health and nutrition examination suvey 1998-2010. Korean J Nutr 2013; 46(1): 72-85.Article
- 30. Stamler J, Stamler R, Neaton JD. Blood pressure, systolic and diastolic, and cardiovascular risk: US populatuib data. Arch Intern Med 1993; 153: 598-615.ArticlePubMed
- 31. Svetkey LP, Harsha DW, Vollmer WM, Stevens VJ, Obarzanek E, Elmer PJ. A comprehensive lifestyle modification for blood pressure control: Rationale, design and baseline characteristics. Ann Epidemiol 2003; 13: 462-471.PubMed
- 32. The Korean Nutrition Society. Dietary reference intakes for Koreans. 1st revision. Seoul: The Korean Nutrition Society; 2010. p. 367.
- 33. Wee LE, Koh GC. The effect of neighborhood, socioeconomic status and a community based program on multi-disease health screening in an Asian population: a controlled intervention study. Prev Med 2011; 53(1-2): 64-69.ArticlePubMed
- 34. Whelton PK, HE J, Appel LJ. Primary prevention of hypertension: Clinical and public health advisory from the national high blood pressure education program. JAMA 2002; 288: 1882-1888.ArticlePubMed
- 35. Yim KS. Analysis of the characteristics of an attendee in an elderly nutrition education program. Korean J Community Nutr 1998; 3(4): 609-621.
- 36. Yim KS. The effects of a nutrition education program for hypertensive female elderly at the public health center. Korean J Community Nutr 2008; 13(5): 640-652.
REFERENCES
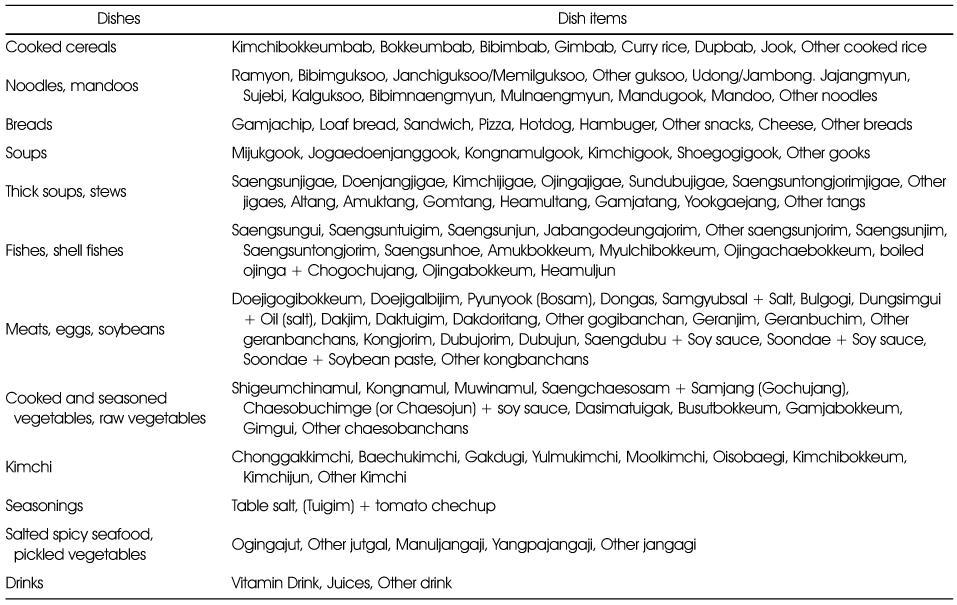
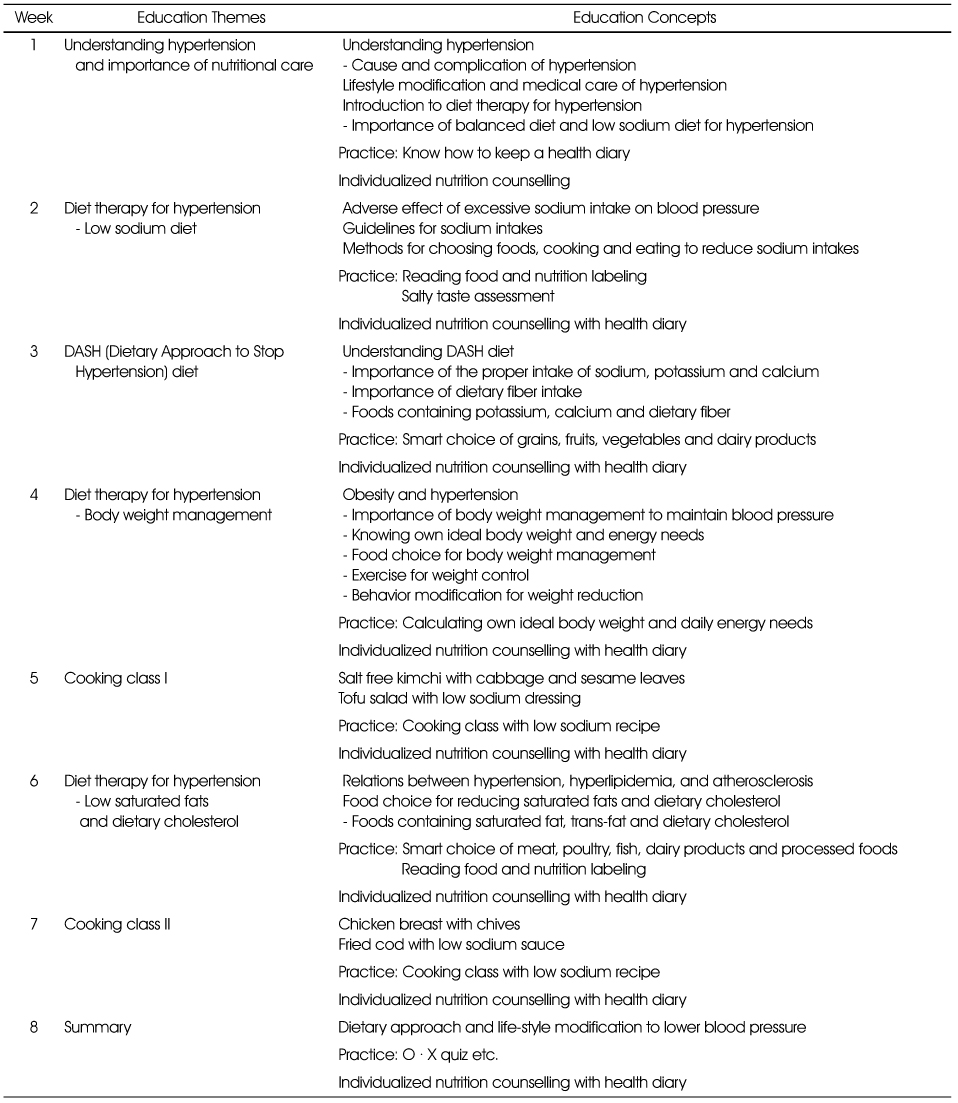
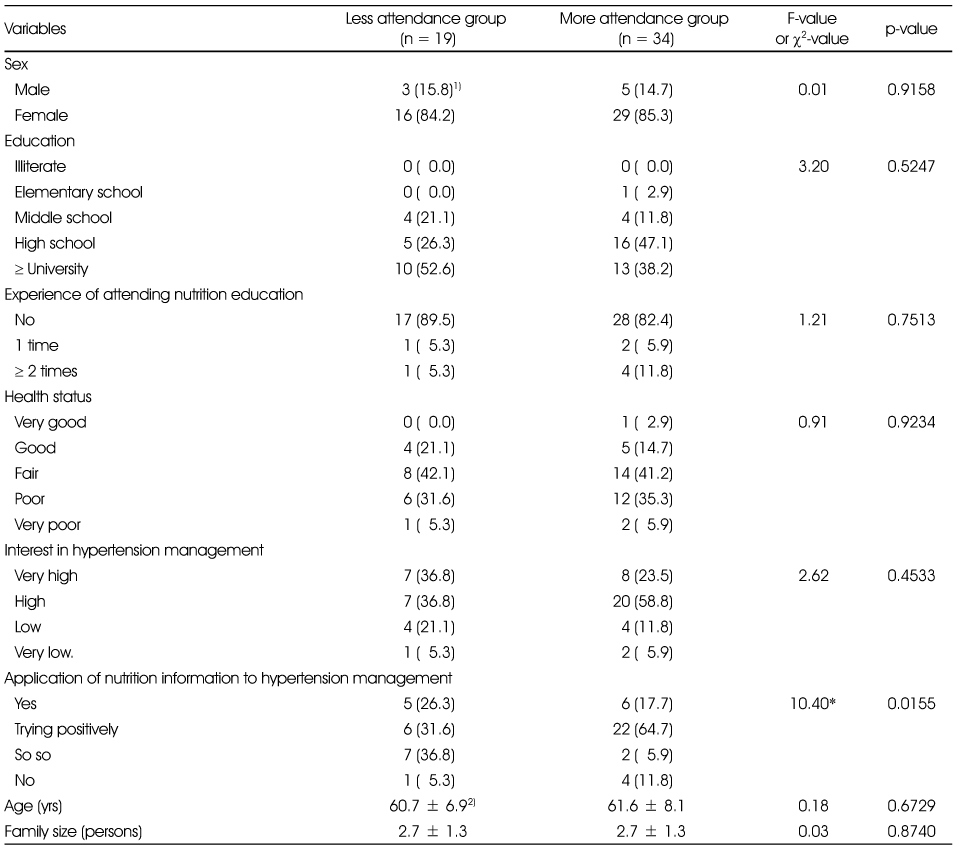
Table 4Changes of anthropometric characteristics during the nutrition education program between less attendance and more attendance groups
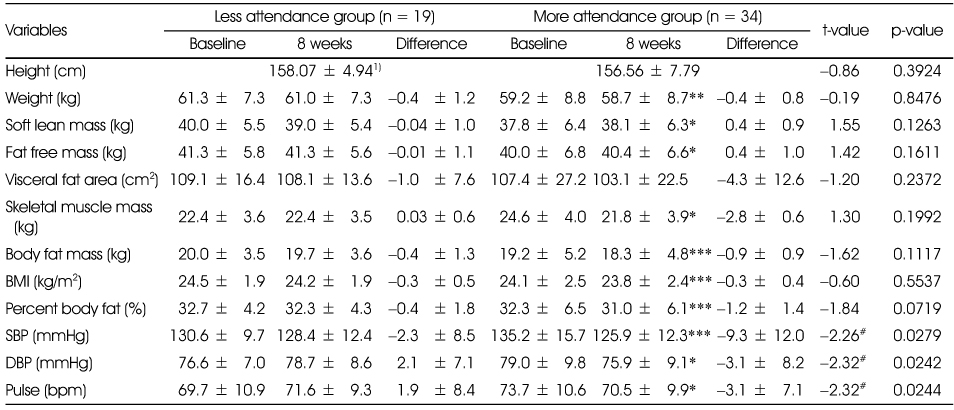
Table 5Changes of biochemical characteristics during the nutrition education program between less attendance and more attendance groups
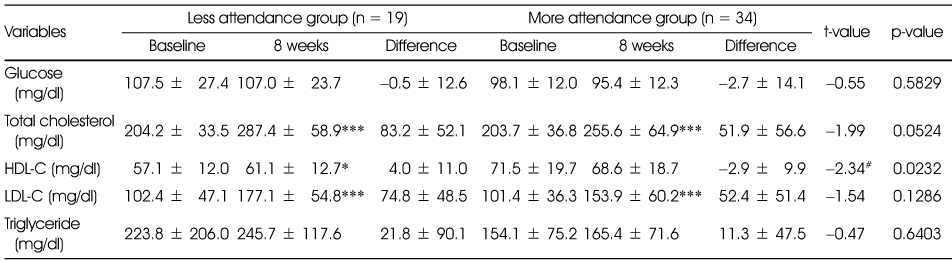
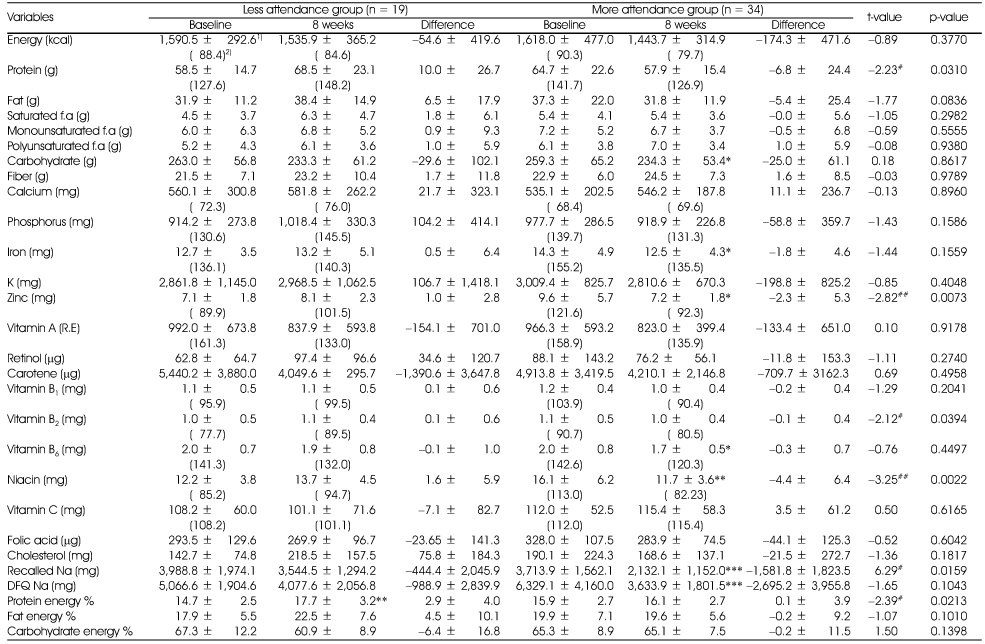
Table 6Changes of nutrients intakes during the nutrition education program between less attendance and more attendance groups
1) Mean ± SD
2) Mean % of RNI(Recommended Nutrient Intake for Dietary Reference Intake for Koreans)
*: p < 0.05, **: p < 0.01, ***: p < 0.001 by paired t-test between baseline and 8 weeks within group
#: p < 0.05, ##: p < 0.01 by t-test between differences of less attendance and more attendance group
Table 7Changes of Nutrients intakes per 1000kcal during the nutrition education program between less attendance and more attendance groups
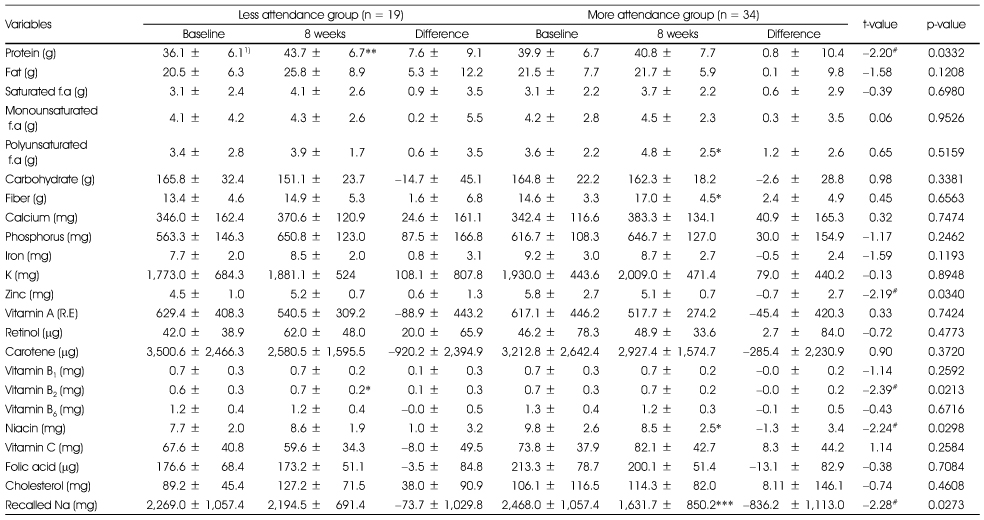
Table 8Changes of dish consumption frequencies during the nutrition education program for less attendance and more attendance groups
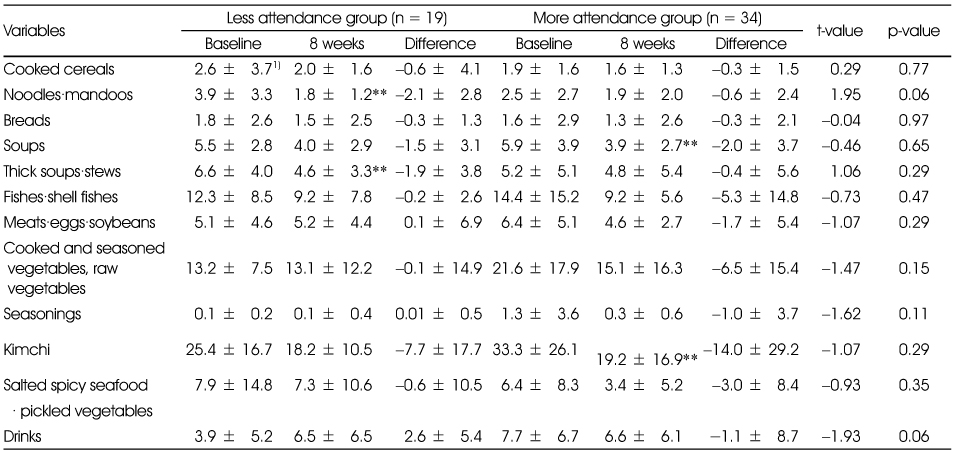
Table 9Changes of nutrition knowledge related to hypertension or sodium intakes between less attendance and more attendance groups
1) Mean ± SD
2) Summated score of each item. Full score = 100, the correct answer for each question was scored 10, incorrect answer 0
*: p < 0.05, **: p < 0.01, ***: p < 0.001 by paired t-test between baseline and 8 weeks within group
1. Nutrition labeling shows sodium contents of processed food
2. Canned foods and instant foods contain lots of sodium
3. Using spices such as vinegar, mustard or soybean sauce instead of salt can reduce sodium intake
4. Salt substitute is a good way to reduce sodium intake
5. Increased risk of hypertension is associated with high level of serum triglycerides
6. Having family history of hypertension can elevate incidence of hypertension to descendent
7. Lowering body weight can reduce blood pressure
8. All the elderly has high blood pressure
9. Stress can lead to elevate blood pressure
10. Pregnancy can lead to elevated blood pressure in females
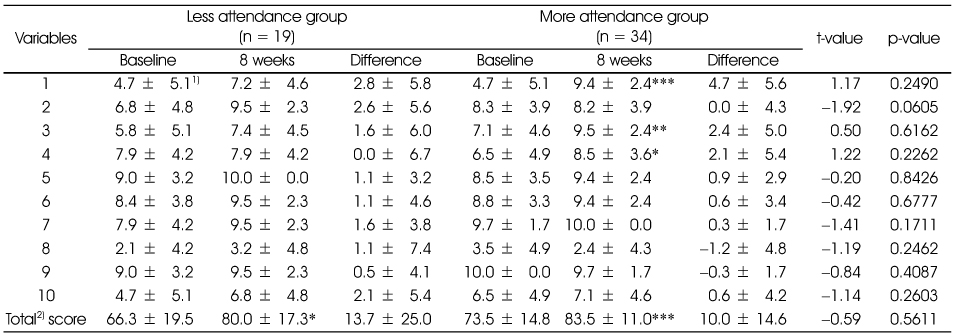
Table 10Changes of dietary behavior related to sodium intakes during the nutrition education program between less attendance and more attendance groups
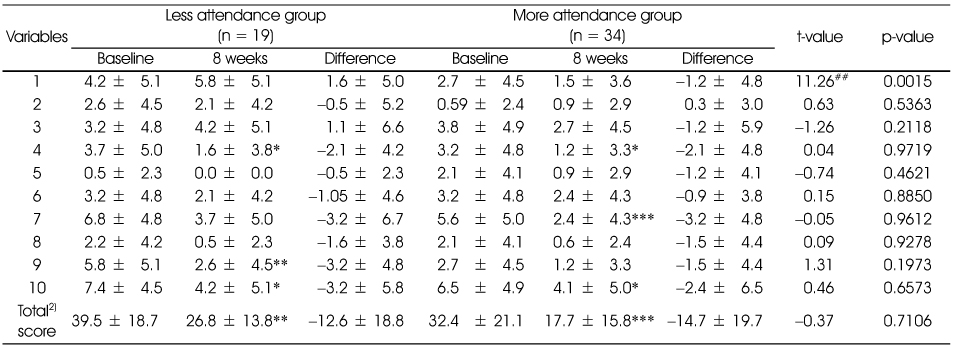
1) Mean ± SD
2) Summated score of each item. Total score = 100, 'yes' answer for each item was scored 10, 'no' answer 0
*: p < 0.05, **: p < 0.01, ***: p < 0.001 by paired t-test between baseline and 8 weeks within group
##: p < 0.01 by t-test between differences of less attendance and more attendance group
1. Enjoy dried seafood or seasoned fish
2. Enjoy salted fish such as salted spicy pollack roe
3. Enjoy cooked rice topped with seasoned meats/seafood or one-dish meal
4. Usually eat all the broth of soup or stew
5. Enjoy instant foods such as ramyon, canned food, or ham.
6. Eating-out or taking delivery dishes more than twice a week
7. Enjoy Kimchi and pickled vegetables
8. Adding lots of soy-sauce or vinegar-hot pepper paste to fried foods, pan-fried foods or sashimi
9. Enjoy salty taste and thinking that salty taste is important one
10. Usually us soy-sauce rather than vinegar when cooking vegetables
Table 11Changes of general dietary habits during the nutrition education program between less attendance and more attendance groups
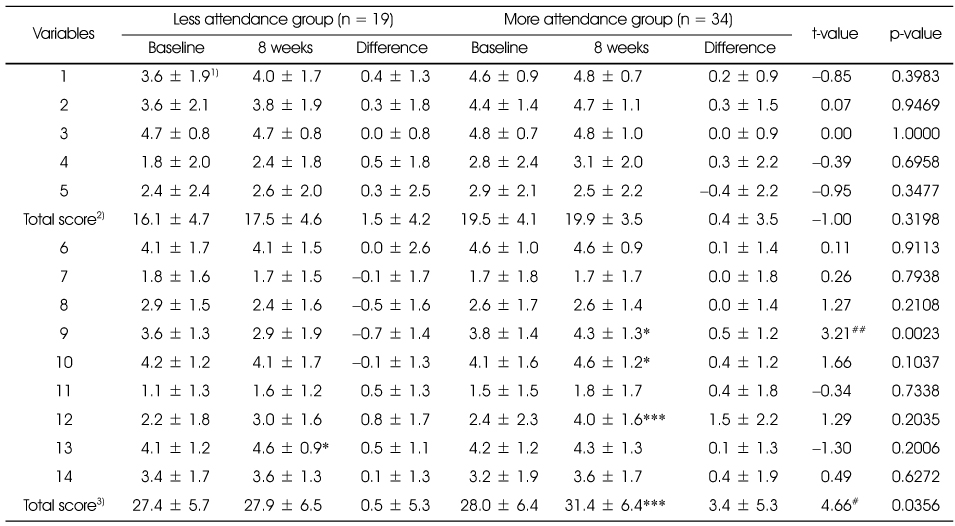
1) Mean ± SD
2) Summated score of each item. Full score of general dietary habits = 25
3) Summated score of each item. Full score of well-balanced dietary habits = 45
'yes' answer for each item (except 4 and 5) was scored 5, 'no' answer 0
'no' answer for each item 4 and 5 was scored 5, 'yes' answer 0
*: p < 0.05, ** : p < 0.01, *** : p < 0.001 by paired t-test between baseline and 8 weeks within group
#: p < 0.05, ##: p < 0.01 by t-test between differences of less attendance and more attendance group
1. Having 3 meals a day without missing any meal
2. Having breakfast everyday
3. Having enough time when eating
4. Having meals often after 10 PM.
5. Eating until feeling full.
6. Having cereals such as rice, breads, noodles, potatoes every meal.
7. Having meats or eggs more than once a day.
8. Having fishes more than once a day
9. Having soybean products such as tofu or soymilk everyday
10. Having vegetable dishes (except kimchi) everyday
11. Having dishes cooked with oils every meal
12. Having milk or dairy products everyday
13. Having fruits everyday
14. Trying to have various foods in a day
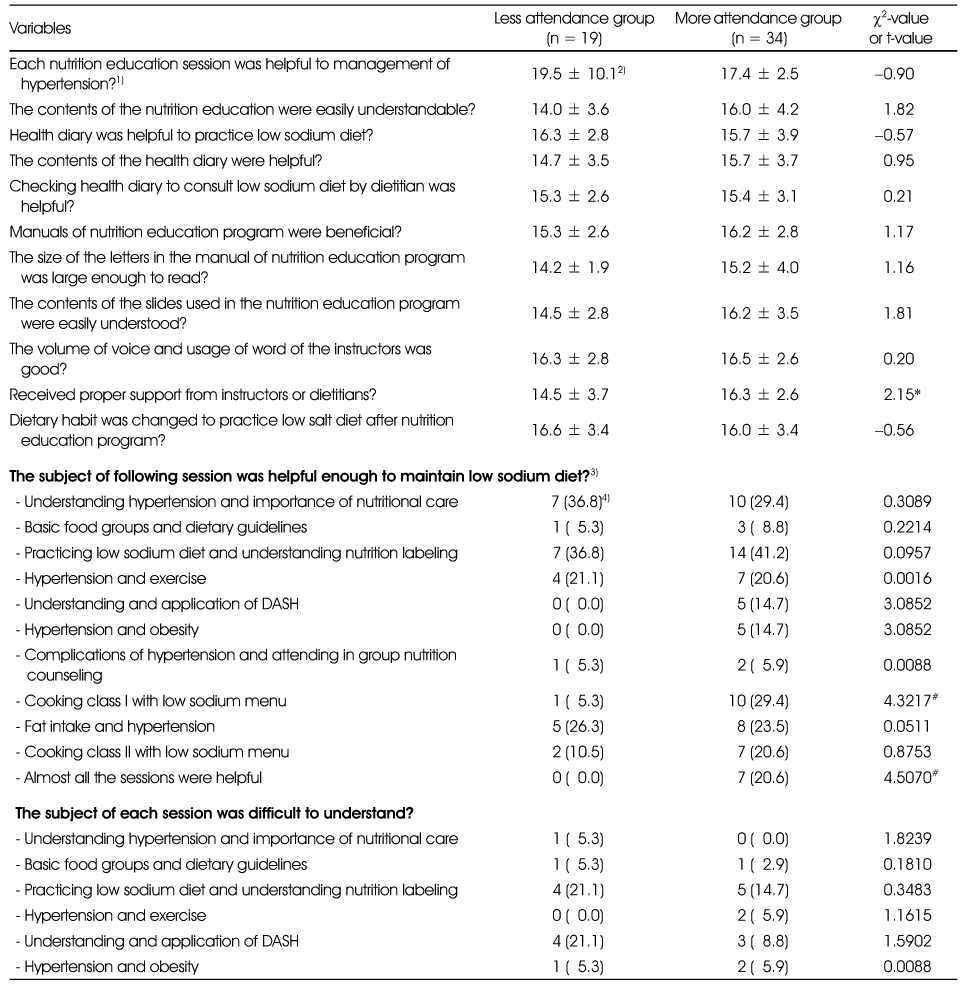
Figure & Data
REFERENCES
Citations
Citations to this article as recorded by 
- Effect of nutrition education in reducing sodium intake and increasing potassium intake in hypertensive adults
You-Sin Lee, Moo-Yong Rhee, Sim-Yeol Lee
Nutrition Research and Practice.2020; 14(5): 540. CrossRef - Status of Recognition, Effort, and Satisfaction of Customers on Low-Sodium Diet in Industry Foodservice
Sang Jin Yoon, Kun Og Kang
Journal of the East Asian Society of Dietary Life.2017; 27(2): 168. CrossRef - Study of the characteristics of dietary behavior and the effects of nutrition education for sodium reduction according to the stages of behavioral change in sodium reduction of male adult subjects in Gwangju·Jeonnam regions
Young Ran Heo, Hyun Young Oh, Hee Kyong Ro
Journal of Nutrition and Health.2017; 50(5): 472. CrossRef - The Effects of Hypertension Health School Program on Hypertension-related Knowledge, Self-efficacy, Self-care Behavior and Physiological Parameters in Hypertensive Patients
Koung Oh Chang
Journal of muscle and joint health.2016; 23(1): 49. CrossRef - Food Safety and Nutrition Education Program for Elderly and Assessment of Program Effectiveness Based on Health Belief Model
Jung-Hwa Choi, Eun-Sil Lee, Yoon-Jin Lee, Hye-Sang Lee, Hye-Ja Chang, Kyung-Eun Lee, Na-Young Yi, Yoon Ahn, Tong-Kyung Kwak
Journal of the Korean Society of Food Science and Nutrition.2016; 45(9): 1366. CrossRef - Dietary Life related to Sodium of Participants in Hypertension and Diabetes Preventive Education at the Public Health Center
Hee-Ok Pak, Chun-Young Sohn, Jung-Hwa Park
The Korean Journal of Food And Nutrition.2015; 28(2): 219. CrossRef - A Study on Eating Out Behavior and Recognition of Salinity in Restaurant Food in Jecheon Area
Soojin Park, Sung Hee Min
Journal of The Korean Society of Food Culture.2015; 30(1): 20. CrossRef - Nutrition knowledge, eating attitudes, nutrition behavior, self-efficacy of childcare center foodservice employees by stages of behavioral change in reducing sodium intake
Yun Ahn, Kyung Won Kim, Kyungmin Kim, Jinwon Pyun, Ikhyun Yeo, Kisun Nam
Journal of Nutrition and Health.2015; 48(5): 429. CrossRef - The Study on Dietary Behavior and Health Related Behaviors of Self Perceived Sodium Intake Groups
Juhyeon Kim, Hei-Ryeo Yoon, Nam-E Kang
Journal of The Korean Society of Food Culture.2014; 29(6): 511. CrossRef - The Relationship between Dietary Behaviors/health Risk Factors and Preference for Salty Taste among Korean Elderly People Living in Rural Areas
Mee Sook Lee
Korean Journal of Community Nutrition.2014; 19(5): 448. CrossRef
 Cite
CiteBlood Pressure, Sodium Intake and Dietary Behavior Changes by Session Attendance on Salt Reduction Education Program for Pre-hypertensive Adults in a Public Health Center
Blood Pressure, Sodium Intake and Dietary Behavior Changes by Session Attendance on Salt Reduction Education Program for Pre-hypertensive Adults in a Public Health Center
Kinds of dish items included in each dish group
Salt reduction nutrition education program for the hypertension
General characteristics of the subjects
1) N (%)
2) Mean ± SD
*: p < 0.05 by χ2 test
Changes of anthropometric characteristics during the nutrition education program between less attendance and more attendance groups
1) Mean ± SD
*: p < 0.05, **: p < 0.01, ***: p < 0.001 by paired t-test between baseline and 8 weeks within group
# p < 0.05 by t-test between differences of less attendance and more attendance group
Changes of biochemical characteristics during the nutrition education program between less attendance and more attendance groups
1) Mean ± SD
*: p < 0.05, ***: p < 0.001 by paired t-test between baseline and 8 weeks within group
# p < 0.05 by t-test between differences of less attendance and more attendance group
Changes of nutrients intakes during the nutrition education program between less attendance and more attendance groups
1) Mean ± SD
2) Mean % of RNI(Recommended Nutrient Intake for Dietary Reference Intake for Koreans)
*: p < 0.05, **: p < 0.01, ***: p < 0.001 by paired t-test between baseline and 8 weeks within group
#: p < 0.05, ##: p < 0.01 by t-test between differences of less attendance and more attendance group
Changes of Nutrients intakes per 1000kcal during the nutrition education program between less attendance and more attendance groups
1) Mean ± SD
*: p < 0.05, **: p < 0.01, ***: p < 0.001 by paired t-test between baseline and 8 weeks within group
#: p < 0.05 by t-test between differences of less attendance and more attendance group
Changes of dish consumption frequencies during the nutrition education program for less attendance and more attendance groups
1) Mean ± SD
**: p < 0.01 by paired t-test between baseline and 8 weeks within group
Changes of nutrition knowledge related to hypertension or sodium intakes between less attendance and more attendance groups
1) Mean ± SD
2) Summated score of each item. Full score = 100, the correct answer for each question was scored 10, incorrect answer 0
*: p < 0.05, **: p < 0.01, ***: p < 0.001 by paired t-test between baseline and 8 weeks within group
1. Nutrition labeling shows sodium contents of processed food
2. Canned foods and instant foods contain lots of sodium
3. Using spices such as vinegar, mustard or soybean sauce instead of salt can reduce sodium intake
4. Salt substitute is a good way to reduce sodium intake
5. Increased risk of hypertension is associated with high level of serum triglycerides
6. Having family history of hypertension can elevate incidence of hypertension to descendent
7. Lowering body weight can reduce blood pressure
8. All the elderly has high blood pressure
9. Stress can lead to elevate blood pressure
10. Pregnancy can lead to elevated blood pressure in females
Changes of dietary behavior related to sodium intakes during the nutrition education program between less attendance and more attendance groups
1) Mean ± SD
2) Summated score of each item. Total score = 100, 'yes' answer for each item was scored 10, 'no' answer 0
*: p < 0.05, **: p < 0.01, ***: p < 0.001 by paired t-test between baseline and 8 weeks within group
##: p < 0.01 by t-test between differences of less attendance and more attendance group
1. Enjoy dried seafood or seasoned fish
2. Enjoy salted fish such as salted spicy pollack roe
3. Enjoy cooked rice topped with seasoned meats/seafood or one-dish meal
4. Usually eat all the broth of soup or stew
5. Enjoy instant foods such as ramyon, canned food, or ham.
6. Eating-out or taking delivery dishes more than twice a week
7. Enjoy Kimchi and pickled vegetables
8. Adding lots of soy-sauce or vinegar-hot pepper paste to fried foods, pan-fried foods or sashimi
9. Enjoy salty taste and thinking that salty taste is important one
10. Usually us soy-sauce rather than vinegar when cooking vegetables
Changes of general dietary habits during the nutrition education program between less attendance and more attendance groups
1) Mean ± SD
2) Summated score of each item. Full score of general dietary habits = 25
3) Summated score of each item. Full score of well-balanced dietary habits = 45
'yes' answer for each item (except 4 and 5) was scored 5, 'no' answer 0
'no' answer for each item 4 and 5 was scored 5, 'yes' answer 0
*: p < 0.05, ** : p < 0.01, *** : p < 0.001 by paired t-test between baseline and 8 weeks within group
#: p < 0.05, ##: p < 0.01 by t-test between differences of less attendance and more attendance group
1. Having 3 meals a day without missing any meal
2. Having breakfast everyday
3. Having enough time when eating
4. Having meals often after 10 PM.
5. Eating until feeling full.
6. Having cereals such as rice, breads, noodles, potatoes every meal.
7. Having meats or eggs more than once a day.
8. Having fishes more than once a day
9. Having soybean products such as tofu or soymilk everyday
10. Having vegetable dishes (except kimchi) everyday
11. Having dishes cooked with oils every meal
12. Having milk or dairy products everyday
13. Having fruits everyday
14. Trying to have various foods in a day
Evaluation for the nutrition education program between less attendance and more attendance groups
1) Strongly disagree: 0, moderately disagree: 5, neutral: 10. moderately agree: 15, strongly agree: 20
2) Mean ± SD
3) Numbers of the subjects who responded 'yes'
4) N (%)
*: p < 0.05 by t-test between groups
#: p < 0.05 by χ2-test between groups
Table 1
Kinds of dish items included in each dish group
Table 2
Salt reduction nutrition education program for the hypertension
Table 3
General characteristics of the subjects
1) N (%) 2) Mean ± SD *: p < 0.05 by χ2 test
Table 4
Changes of anthropometric characteristics during the nutrition education program between less attendance and more attendance groups
1) Mean ± SD *: p < 0.05, **: p < 0.01, ***: p < 0.001 by paired t-test between baseline and 8 weeks within group # p < 0.05 by t-test between differences of less attendance and more attendance group
Table 5
Changes of biochemical characteristics during the nutrition education program between less attendance and more attendance groups
1) Mean ± SD *: p < 0.05, ***: p < 0.001 by paired t-test between baseline and 8 weeks within group # p < 0.05 by t-test between differences of less attendance and more attendance group
Table 6
Changes of nutrients intakes during the nutrition education program between less attendance and more attendance groups
1) Mean ± SD 2) Mean % of RNI(Recommended Nutrient Intake for Dietary Reference Intake for Koreans) *: p < 0.05, **: p < 0.01, ***: p < 0.001 by paired t-test between baseline and 8 weeks within group #: p < 0.05, ##: p < 0.01 by t-test between differences of less attendance and more attendance group
Table 7
Changes of Nutrients intakes per 1000kcal during the nutrition education program between less attendance and more attendance groups
1) Mean ± SD *: p < 0.05, **: p < 0.01, ***: p < 0.001 by paired t-test between baseline and 8 weeks within group #: p < 0.05 by t-test between differences of less attendance and more attendance group
Table 8
Changes of dish consumption frequencies during the nutrition education program for less attendance and more attendance groups
1) Mean ± SD **: p < 0.01 by paired t-test between baseline and 8 weeks within group
Table 9
Changes of nutrition knowledge related to hypertension or sodium intakes between less attendance and more attendance groups
1) Mean ± SD 2) Summated score of each item. Full score = 100, the correct answer for each question was scored 10, incorrect answer 0 *: p < 0.05, **: p < 0.01, ***: p < 0.001 by paired t-test between baseline and 8 weeks within group 1. Nutrition labeling shows sodium contents of processed food 2. Canned foods and instant foods contain lots of sodium 3. Using spices such as vinegar, mustard or soybean sauce instead of salt can reduce sodium intake 4. Salt substitute is a good way to reduce sodium intake 5. Increased risk of hypertension is associated with high level of serum triglycerides 6. Having family history of hypertension can elevate incidence of hypertension to descendent 7. Lowering body weight can reduce blood pressure 8. All the elderly has high blood pressure 9. Stress can lead to elevate blood pressure 10. Pregnancy can lead to elevated blood pressure in females
Table 10
Changes of dietary behavior related to sodium intakes during the nutrition education program between less attendance and more attendance groups
1) Mean ± SD 2) Summated score of each item. Total score = 100, 'yes' answer for each item was scored 10, 'no' answer 0 *: p < 0.05, **: p < 0.01, ***: p < 0.001 by paired t-test between baseline and 8 weeks within group ##: p < 0.01 by t-test between differences of less attendance and more attendance group 1. Enjoy dried seafood or seasoned fish 2. Enjoy salted fish such as salted spicy pollack roe 3. Enjoy cooked rice topped with seasoned meats/seafood or one-dish meal 4. Usually eat all the broth of soup or stew 5. Enjoy instant foods such as ramyon, canned food, or ham. 6. Eating-out or taking delivery dishes more than twice a week 7. Enjoy Kimchi and pickled vegetables 8. Adding lots of soy-sauce or vinegar-hot pepper paste to fried foods, pan-fried foods or sashimi 9. Enjoy salty taste and thinking that salty taste is important one 10. Usually us soy-sauce rather than vinegar when cooking vegetables
Table 11
Changes of general dietary habits during the nutrition education program between less attendance and more attendance groups
1) Mean ± SD 2) Summated score of each item. Full score of general dietary habits = 25 3) Summated score of each item. Full score of well-balanced dietary habits = 45 'yes' answer for each item (except 4 and 5) was scored 5, 'no' answer 0 'no' answer for each item 4 and 5 was scored 5, 'yes' answer 0 *: p < 0.05, ** : p < 0.01, *** : p < 0.001 by paired t-test between baseline and 8 weeks within group #: p < 0.05, ##: p < 0.01 by t-test between differences of less attendance and more attendance group 1. Having 3 meals a day without missing any meal 2. Having breakfast everyday 3. Having enough time when eating 4. Having meals often after 10 PM. 5. Eating until feeling full. 6. Having cereals such as rice, breads, noodles, potatoes every meal. 7. Having meats or eggs more than once a day. 8. Having fishes more than once a day 9. Having soybean products such as tofu or soymilk everyday 10. Having vegetable dishes (except kimchi) everyday 11. Having dishes cooked with oils every meal 12. Having milk or dairy products everyday 13. Having fruits everyday 14. Trying to have various foods in a day
Table 12
Evaluation for the nutrition education program between less attendance and more attendance groups
1) Strongly disagree: 0, moderately disagree: 5, neutral: 10. moderately agree: 15, strongly agree: 20 2) Mean ± SD 3) Numbers of the subjects who responded 'yes' 4) N (%) *: p < 0.05 by t-test between groups #: p < 0.05 by χ2-test between groups


