Articles
- Page Path
- HOME > Korean J Community Nutr > Volume 19(5); 2014 > Article
-
Research Article
- The relationship between Intake of Health Foods and Dietary Behavior in Middle-Aged Women
- Mi-Hee Kim, Hye-Jin Lee, Mi-Jeong Kim, Kyung-Hea Lee
-
Korean Journal of Community Nutrition 2014;19(5):436-447.
DOI: https://doi.org/10.5720/kjcn.2014.19.5.436
Published online: October 31, 2014
1Department of Food and Nutrition, Changwon National University, Gyeongnam, Korea.
2Department of Food and Nutrition, Silla University, Busan, Korea.
- Corresponding author: Kyung-Hea Lee. Department of Food and Nutrition, Changwon National University, 20, Changwondaehak-ro, Uichang-gu, Changwon, Gyeongnam 641-773, Korea. Tel: (055) 213-3514, Fax: (055) 281-7480, khl@changwon.ac.kr
Copyright © 2014 The Korean Society of Community Nutrition
This is an Open-Access article distributed under the terms of the Creative Commons Attribution Non-Commercial License (http://creativecommons.org/licenses/by-nc/3.0/) which permits unrestricted non-commercial use, distribution, and reproduction in any medium, provided the original work is properly cited.
- 369 Views
- 0 Download
- 2 Crossref
Abstract
-
Objectives
- The purpose of this study was to investigate the health food consumption patterns and their relationship to dietary behavior in middle-aged women (45-60 years).
-
Methods
- The exclusive face-to-face interviews by well-trained interviewers guaranteed a scientific data collection and the quality of survey data of 731 women. Subjects were divided into two groups according to the intake of the health foods, 'Intake' group (≥ 3.2, n = 488) and 'Non-intake' group (n = 243). Data were analyzed using the SPSS 20.0 program.
-
Results
- The average age of the subjects was 49.8 years and 66.8% of subjects were taking the health foods. Vitamins and minerals were consumed by the subjects. The major reason for intake of health foods was that they provide nutrient supplements may prevent diseases. More than 70% of the subjects reported checking nutrition information, ingredients, recommended daily intakes, instructions, when they bought the health foods. The average dietary life score of the intake group was significantly higher (p < 0.05) than that of the non-intake group. In analysis of exploratory factors of dietary life, the intake group showed significantly higher score (p < 0.001) in 'moderation of food intake' among the 4 exploratory factors.
-
Conclusions
- These results showed that women who took health foods had better dietary behavior than others suggesting a positive relation between the dietary behavior and the health food consumption. Therefore, we suggest that developing guidelines and then educating women about those guidelines could improve the ability of choosing health foods appropriately for their own benefit.
Acknowledgments
Acknowledgments
- 1. An CS, Nam CH. A study on awareness of health food in community people of urban area. J Korean Public Health Assoc 1990; 16(2): 43-55.
- 2. Archer SL, Stamler J, Moag-Stahlberg A, Van Horn L, Garside D, Chan Q, Buffington JJ, Dyer AR. Association of dietary supplement use with specific micronutrient intakes among middle-aged American men and women: the INTERMAP Study. J Am Diet Assoc 2005; 105(7): 1106-1114.Article
- 3. Baek SS. An analysis of the relationship of enopausal symptoms of midlife women between urban area and rural area. J Korean Acad Womens Health Nurs 1998; 4(3): 332-347.
- 4. Brustad M, Braaten T, Lund E. Predictors for cod-liver oil supplement use--the Norwegian Women and Cancer Study. Eur J Clin Nutr 2004; 58(1): 128-136.ArticlePubMedPDF
- 5. Chang HK, Han YB. A study on the climacteric symptoms and dietary patterns in middle-aged women. J Korean Home Econ Assoc 2002; 40(1): 125-134.
- 6. Dwyer JT, Garcea AO, Evans M, Li D, Lytle L, Hoelscher D, Nicklas TA, Zive M. Do adolescent vitamin-mineral supplement users have better nutrient intakes than nonusers? Observations from the CATCH tracking study. J Am Diet Assoc 2001; 101(11): 1340-1346.ArticlePubMed
- 7. Ishihara J, Sobue T, Yamamoto S, Sasaki S, Tsugane S. JPHC Study Group. Demographics, lifestyles, health characteristics, and dietary intake among dietary supplement users in Japan. Int J Epidemiol 2003; 32(4): 546-553.ArticlePubMed
- 8. Ju H, Seo J, Hwang J, Park H, Lee E, Hwang S. Comparative study on climacteric symptoms, knowledge of menopause and menopausal management of middle aged women between urban and rural areas. Korean J Women Health Nurs 2005; 11(1): 27-37.ArticlePDF
- 9. Kim CI, Jang YA, Kim BH, Lee HS, Lee YN. Development of dietary guidelines for prevention and management of chronic disease for Korean population (2003: Dietary action guides for infants & toddlers, pregnant & lactating women, children, and adolescents). Cheongju: Korea Health Industry Development Institute; 2003. p. 36. Revision of dietary guidelines for Koreans.
- 10. Kim HC, Kim MR. Intake patterns and information-seeking behaviors of the elderly regarding health foods. J East Asian Soc Diet Life 2007; 17(4): 499-510.
- 11. Kim H, Kim M. A study on health-functional foods intake pattern of consumers in Busan and Gyengnam region. J Korean Living Sci Assoc 2006; 15(2): 341-352.
- 12. Kim HR. Provisional national nutrition targets and strategies for health promotion of Koreans. Korean J Community Nutr 1996; 1(2): 161-177.
- 13. Kim HS, Yoon KH, Lee MJ, Seo BH. Intake and awareness of the functional health food among housewives in Cheongju area. J Hum Ecol 2005; 9(2): 179-196.
- 14. Kim NS, Song HJ. Women's chronic diseases and policy implications in Korea. Health Welf Policy Forum 2004; 93: 39-46.
- 15. Kim SH. Patterns of vitamin/mineral supplements usage among the middle-aged in Korea. Korean J Nutr 1994; 27(3): 236-252.
- 16. Kim SH. A study on the use of health functional foods and its related influencing factors of university students in Korea. Korean J Food Cult 2010; 25(2): 150-159.
- 17. Kim SH, Han JH, Kim WY. Health functional food use and related variables among the middle-aged in Korea. Korean J Nutr 2010; 43(3): 294-303.Article
- 18. Kim SK, Sunwoo JG. The analysis of the dietary factors related to climacteric symptoms in middle-aged women. Korean J Community Nutr 2007; 12(1): 25-39.
- 19. Kim SY, You JS, Chang KJ. Consumption of health functional food and dietary habits, nutrient intake and dietary quality of college students in Incheon. Korean J Nutr 2013; 46(2): 166-176.Article
- 20. Koo NS, Park JY. Consumption pattern of health food by adults in Taejon. Korean J Community Nutr 2000; 5(3): 452-460.
- 21. Lee BR, Jeong BY, Kim IS, Moon SK. A study on the relationship between health food and health-related factors by residence and sex in Tong-Yeong area. J Korean Soc Food Sci Nutr 2005; 34(6): 840-849.Article
- 22. Lee EJ, Ro SO, Lee CH. A survey on the consumer attitude toward health food in Korea (II) consumer preception on health foods. Korean J Diet Cult 1996; 11(4): 487-495.
- 23. Lee HJ, Lee KH. The impacts of dietary habits on selfperceived health-related physical fitness in middle-aged women -Focused on Changwon province-. J Korean Soc Food Sci Nutr 2014; 43(6): 916-925.Article
- 24. Lee HS, Han JH, Kim SH. A survey on the consumption of vitamin and mineral supplements as health functional foods and related factors by Korean adolescents. Korean J Diet Cult 2013; 28(4): 415-423.Article
- 25. Lee JE, Yang YJ, Seo S, Kwon O. Health/functional food consumption factors of 20's Korea women based on social cognitive theory. Korean J Nutr 2012; 45(2): 170-180.
- 26. Lee MY, Kim JS, Lee JH, Cheong SH, Chang KJ. A study on usage of dietary supplements and related factors in college students attending web class via internet. Korean J Nutr 2001; 34(8): 946-955.
- 27. Lee SG, Lee SM, Kong EH, Choi JS. The functional food usage and relation with fatigue for male workers. Korean J Fam Med 2011; 32(2): 120-127.
- 28. Lee YH, Choi SJ. A study of factors influencing health perception in the elderly. J Korean Acad Nurs 2000; 30(4): 880-892.
- 29. Ministry of Food and Drug Safety. Definition of health functional food. 2014; cited February 3, 2014]. Available from http://www.foodnara.go.kr/hfoodi/.
- 30. Ministry of Health and Welfare, Korea Centers for Disease Control and Prevention. Korea Health Statistics 2012: Korea National Health and Nutrition Examination Survey (KNHANES V-3). 2013; cited June 12, 2014]. Available from http://knhanes.cdc.go.kr.
- 31. Ohn J, Kim JH. Intake pattern and needs assessment for the development of web-contents on health functional foods according to age of adults. Korean J Community Nutr 2012; 17(1): 26-37.
- 32. Polk MR. The dietitian vs. food faddism: an educational challenge. J Am Diet Assoc 1985; 85(10): 1335-1337.PubMed
- 33. Reaves L, Steffen LM, Dwyer JT, Webber LS, Lytle LA, Feldman HA, Hoelscher DM, Zive MM, Osganian SK. Vitamin supplement intake is related to dietary intake and physical activity: the Child and Adolescent Trial for Cardiovascular Health (CATCH). J Am Diet Assoc 2006; 106(12): 2018-2023.PubMed
- 34. Reinert A, Rohrmann S, Becker N, Linseisen J. Lifestyle and diet in people using dietary supplements: a German cohort study. Eur J Nutr 2007; 46(3): 165-173.PubMed
- 35. Smith C, Wilson NC, Parnell WR. Dietary supplements: characteristics of supplement users in New Zealand. Nutr Diet 2005; 62(4): 123-129.
- 36. Song BC, Kim MK. Patterns of vitamin-mineral supplement usage by the elderly in Korea. Korean J Nutr 1997; 30(2): 139-146.
- 37. Stang J, Story MT, Harnack L, Neumark-Sztainer D. Relationships between vitamin and mineral supplement use, dietary intake, and dietary adequacy among adolescents. J Am Diet Assoc 2000; 100(8): 905-910.PubMed
- 38. Troppmann L, Gray-Donald K, Johns T. Supplement use: Is there any nutritional benefit? J Am Diet Assoc 2002; 102(6): 818-825.PubMed
- 39. Yang JH. A study on health behavior experience of middle-aged women in rural area. J Korean Acad Nurs 2002; 32(5): 694-705.
- 40. Yeun EJ. A study on the health promoting lifestyle practices of middle-aged women in Korea. J Korean Soc Health Educ Promot 2000; 17(1): 41-59.
- 41. Yi HH, Park HA, Kang JH, Kang JH, Kim KW, Cho YG, Song HR, Lee JS. What types of dietary supplements are used in Korea? Data from the Korean National Health and Nutritional Examination Survey 2005. Korean J Fam Med 2009; 30(12): 934-943.
- 42. Yoo YJ, Hong WS, Youn SJ, Choi YS. The experience of health food usage for adults in Seoul. Korean J Soc Food Cookery Sci 2002; 18(2): 136-146.
REFERENCES
Figure & Data
REFERENCES
- 1. An CS, Nam CH. A study on awareness of health food in community people of urban area. J Korean Public Health Assoc 1990; 16(2): 43-55.
- 2. Archer SL, Stamler J, Moag-Stahlberg A, Van Horn L, Garside D, Chan Q, Buffington JJ, Dyer AR. Association of dietary supplement use with specific micronutrient intakes among middle-aged American men and women: the INTERMAP Study. J Am Diet Assoc 2005; 105(7): 1106-1114.Article
- 3. Baek SS. An analysis of the relationship of enopausal symptoms of midlife women between urban area and rural area. J Korean Acad Womens Health Nurs 1998; 4(3): 332-347.
- 4. Brustad M, Braaten T, Lund E. Predictors for cod-liver oil supplement use--the Norwegian Women and Cancer Study. Eur J Clin Nutr 2004; 58(1): 128-136.ArticlePubMedPDF
- 5. Chang HK, Han YB. A study on the climacteric symptoms and dietary patterns in middle-aged women. J Korean Home Econ Assoc 2002; 40(1): 125-134.
- 6. Dwyer JT, Garcea AO, Evans M, Li D, Lytle L, Hoelscher D, Nicklas TA, Zive M. Do adolescent vitamin-mineral supplement users have better nutrient intakes than nonusers? Observations from the CATCH tracking study. J Am Diet Assoc 2001; 101(11): 1340-1346.ArticlePubMed
- 7. Ishihara J, Sobue T, Yamamoto S, Sasaki S, Tsugane S. JPHC Study Group. Demographics, lifestyles, health characteristics, and dietary intake among dietary supplement users in Japan. Int J Epidemiol 2003; 32(4): 546-553.ArticlePubMed
- 8. Ju H, Seo J, Hwang J, Park H, Lee E, Hwang S. Comparative study on climacteric symptoms, knowledge of menopause and menopausal management of middle aged women between urban and rural areas. Korean J Women Health Nurs 2005; 11(1): 27-37.ArticlePDF
- 9. Kim CI, Jang YA, Kim BH, Lee HS, Lee YN. Development of dietary guidelines for prevention and management of chronic disease for Korean population (2003: Dietary action guides for infants & toddlers, pregnant & lactating women, children, and adolescents). Cheongju: Korea Health Industry Development Institute; 2003. p. 36. Revision of dietary guidelines for Koreans.
- 10. Kim HC, Kim MR. Intake patterns and information-seeking behaviors of the elderly regarding health foods. J East Asian Soc Diet Life 2007; 17(4): 499-510.
- 11. Kim H, Kim M. A study on health-functional foods intake pattern of consumers in Busan and Gyengnam region. J Korean Living Sci Assoc 2006; 15(2): 341-352.
- 12. Kim HR. Provisional national nutrition targets and strategies for health promotion of Koreans. Korean J Community Nutr 1996; 1(2): 161-177.
- 13. Kim HS, Yoon KH, Lee MJ, Seo BH. Intake and awareness of the functional health food among housewives in Cheongju area. J Hum Ecol 2005; 9(2): 179-196.
- 14. Kim NS, Song HJ. Women's chronic diseases and policy implications in Korea. Health Welf Policy Forum 2004; 93: 39-46.
- 15. Kim SH. Patterns of vitamin/mineral supplements usage among the middle-aged in Korea. Korean J Nutr 1994; 27(3): 236-252.
- 16. Kim SH. A study on the use of health functional foods and its related influencing factors of university students in Korea. Korean J Food Cult 2010; 25(2): 150-159.
- 17. Kim SH, Han JH, Kim WY. Health functional food use and related variables among the middle-aged in Korea. Korean J Nutr 2010; 43(3): 294-303.Article
- 18. Kim SK, Sunwoo JG. The analysis of the dietary factors related to climacteric symptoms in middle-aged women. Korean J Community Nutr 2007; 12(1): 25-39.
- 19. Kim SY, You JS, Chang KJ. Consumption of health functional food and dietary habits, nutrient intake and dietary quality of college students in Incheon. Korean J Nutr 2013; 46(2): 166-176.Article
- 20. Koo NS, Park JY. Consumption pattern of health food by adults in Taejon. Korean J Community Nutr 2000; 5(3): 452-460.
- 21. Lee BR, Jeong BY, Kim IS, Moon SK. A study on the relationship between health food and health-related factors by residence and sex in Tong-Yeong area. J Korean Soc Food Sci Nutr 2005; 34(6): 840-849.Article
- 22. Lee EJ, Ro SO, Lee CH. A survey on the consumer attitude toward health food in Korea (II) consumer preception on health foods. Korean J Diet Cult 1996; 11(4): 487-495.
- 23. Lee HJ, Lee KH. The impacts of dietary habits on selfperceived health-related physical fitness in middle-aged women -Focused on Changwon province-. J Korean Soc Food Sci Nutr 2014; 43(6): 916-925.Article
- 24. Lee HS, Han JH, Kim SH. A survey on the consumption of vitamin and mineral supplements as health functional foods and related factors by Korean adolescents. Korean J Diet Cult 2013; 28(4): 415-423.Article
- 25. Lee JE, Yang YJ, Seo S, Kwon O. Health/functional food consumption factors of 20's Korea women based on social cognitive theory. Korean J Nutr 2012; 45(2): 170-180.
- 26. Lee MY, Kim JS, Lee JH, Cheong SH, Chang KJ. A study on usage of dietary supplements and related factors in college students attending web class via internet. Korean J Nutr 2001; 34(8): 946-955.
- 27. Lee SG, Lee SM, Kong EH, Choi JS. The functional food usage and relation with fatigue for male workers. Korean J Fam Med 2011; 32(2): 120-127.
- 28. Lee YH, Choi SJ. A study of factors influencing health perception in the elderly. J Korean Acad Nurs 2000; 30(4): 880-892.
- 29. Ministry of Food and Drug Safety. Definition of health functional food. 2014; cited February 3, 2014]. Available from http://www.foodnara.go.kr/hfoodi/.
- 30. Ministry of Health and Welfare, Korea Centers for Disease Control and Prevention. Korea Health Statistics 2012: Korea National Health and Nutrition Examination Survey (KNHANES V-3). 2013; cited June 12, 2014]. Available from http://knhanes.cdc.go.kr.
- 31. Ohn J, Kim JH. Intake pattern and needs assessment for the development of web-contents on health functional foods according to age of adults. Korean J Community Nutr 2012; 17(1): 26-37.
- 32. Polk MR. The dietitian vs. food faddism: an educational challenge. J Am Diet Assoc 1985; 85(10): 1335-1337.PubMed
- 33. Reaves L, Steffen LM, Dwyer JT, Webber LS, Lytle LA, Feldman HA, Hoelscher DM, Zive MM, Osganian SK. Vitamin supplement intake is related to dietary intake and physical activity: the Child and Adolescent Trial for Cardiovascular Health (CATCH). J Am Diet Assoc 2006; 106(12): 2018-2023.PubMed
- 34. Reinert A, Rohrmann S, Becker N, Linseisen J. Lifestyle and diet in people using dietary supplements: a German cohort study. Eur J Nutr 2007; 46(3): 165-173.PubMed
- 35. Smith C, Wilson NC, Parnell WR. Dietary supplements: characteristics of supplement users in New Zealand. Nutr Diet 2005; 62(4): 123-129.
- 36. Song BC, Kim MK. Patterns of vitamin-mineral supplement usage by the elderly in Korea. Korean J Nutr 1997; 30(2): 139-146.
- 37. Stang J, Story MT, Harnack L, Neumark-Sztainer D. Relationships between vitamin and mineral supplement use, dietary intake, and dietary adequacy among adolescents. J Am Diet Assoc 2000; 100(8): 905-910.PubMed
- 38. Troppmann L, Gray-Donald K, Johns T. Supplement use: Is there any nutritional benefit? J Am Diet Assoc 2002; 102(6): 818-825.PubMed
- 39. Yang JH. A study on health behavior experience of middle-aged women in rural area. J Korean Acad Nurs 2002; 32(5): 694-705.
- 40. Yeun EJ. A study on the health promoting lifestyle practices of middle-aged women in Korea. J Korean Soc Health Educ Promot 2000; 17(1): 41-59.
- 41. Yi HH, Park HA, Kang JH, Kang JH, Kim KW, Cho YG, Song HR, Lee JS. What types of dietary supplements are used in Korea? Data from the Korean National Health and Nutritional Examination Survey 2005. Korean J Fam Med 2009; 30(12): 934-943.
- 42. Yoo YJ, Hong WS, Youn SJ, Choi YS. The experience of health food usage for adults in Seoul. Korean J Soc Food Cookery Sci 2002; 18(2): 136-146.
Citations

- Association of milk and dairy product consumption with the incidence of cardio-cerebrovascular disease incidence in middle-aged and older Korean adults: a 16-year follow-up of the Korean Genome and Epidemiology Study
Yeseung Jeong, Kyung Won Lee, Hyekyeong Kim, Yuri Kim
Nutrition Research and Practice.2023; 17(6): 1225. CrossRef - The Association between 10-Year Atherosclerotic Cardiovascular Diseases Risk Score Calculated Using 2013 American College of Cardiology/American Heart Association Guidelines and Serum 25-Hydroxyvitamin D Level among Aged 40–79 Years in Korea: The Sixth K
Mun Hee Kim, Young Sang Kim, Hye Jin Oh, Yu Ri Kwon, Hye Won Kim
Korean Journal of Family Medicine.2018; 39(3): 174. CrossRef
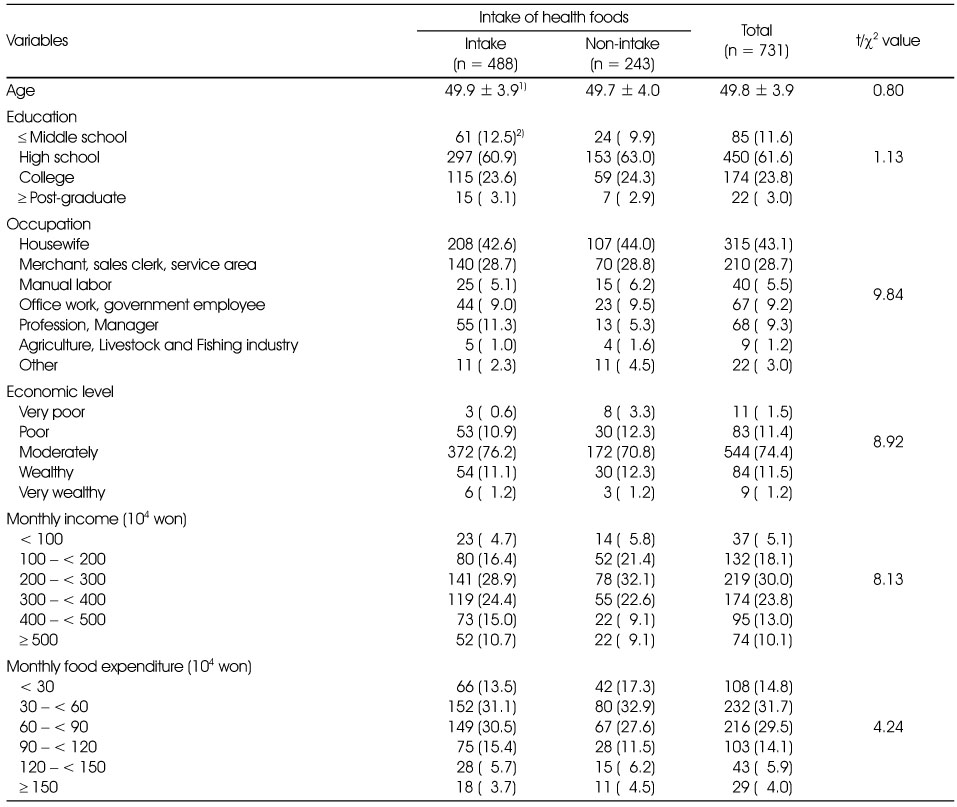
General characteristics of subjects according to intake of health foods
1) Mean ± SD
2) N (%)
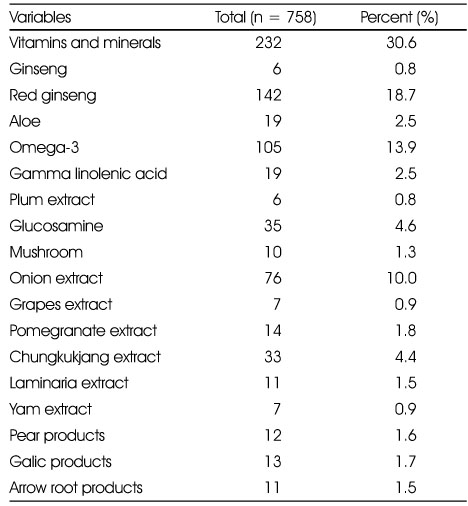
Kinds of health food intake by the subjects1)
1) Multiple responses
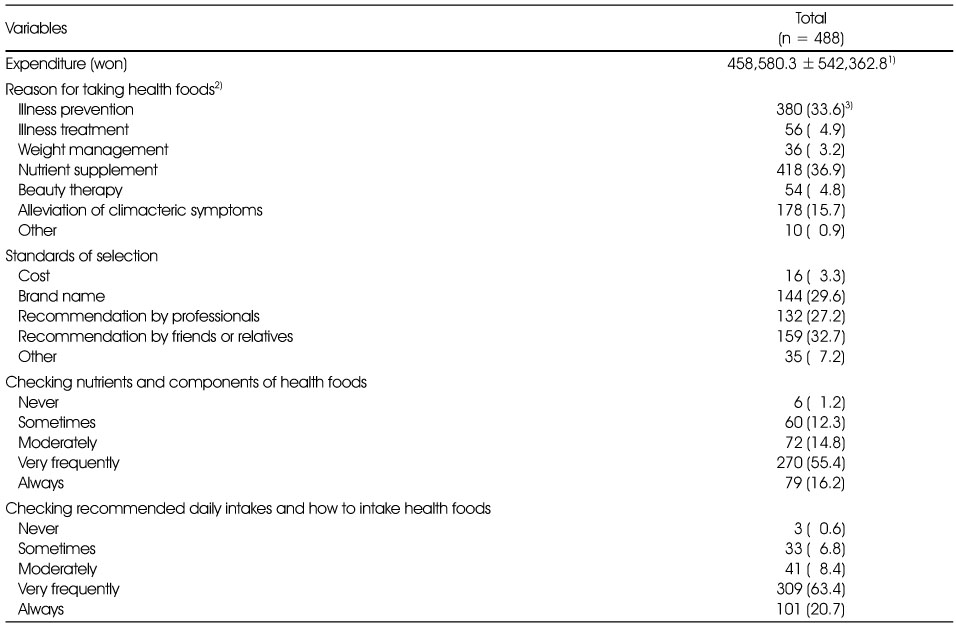
Attitude toward health foods
1) Mean ±SD
2) Multiple responses
3) N (%)
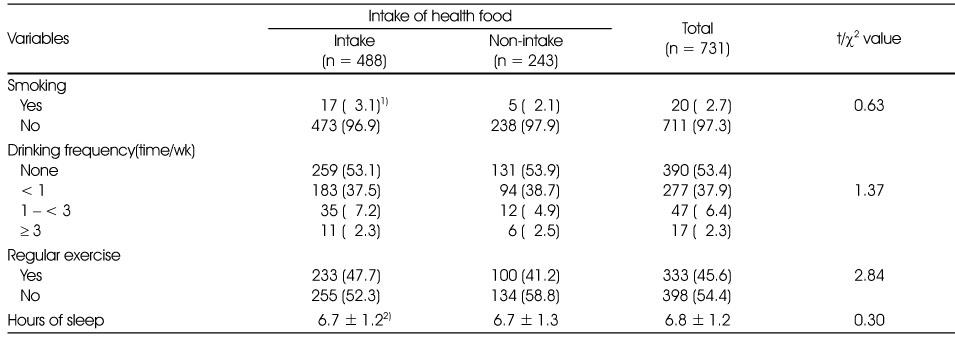
Health behavior of subjects according to intake of health foods
1) N (%)
2) Mean ± SD
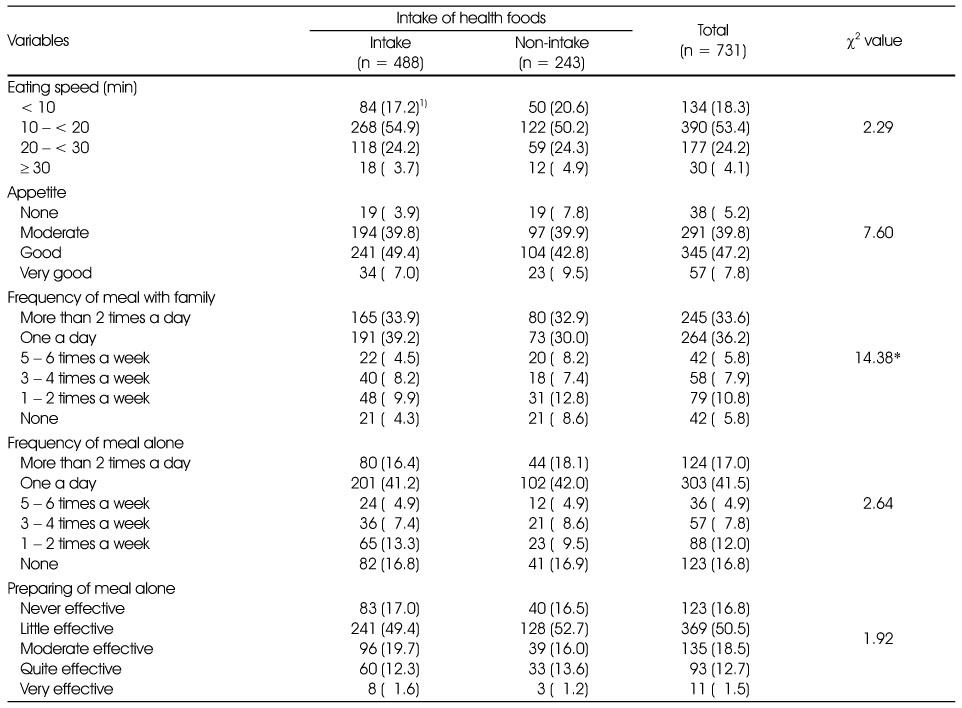
Dietary habits of subjects according to intake of health foods
1) N (%)
*: p < 0.05
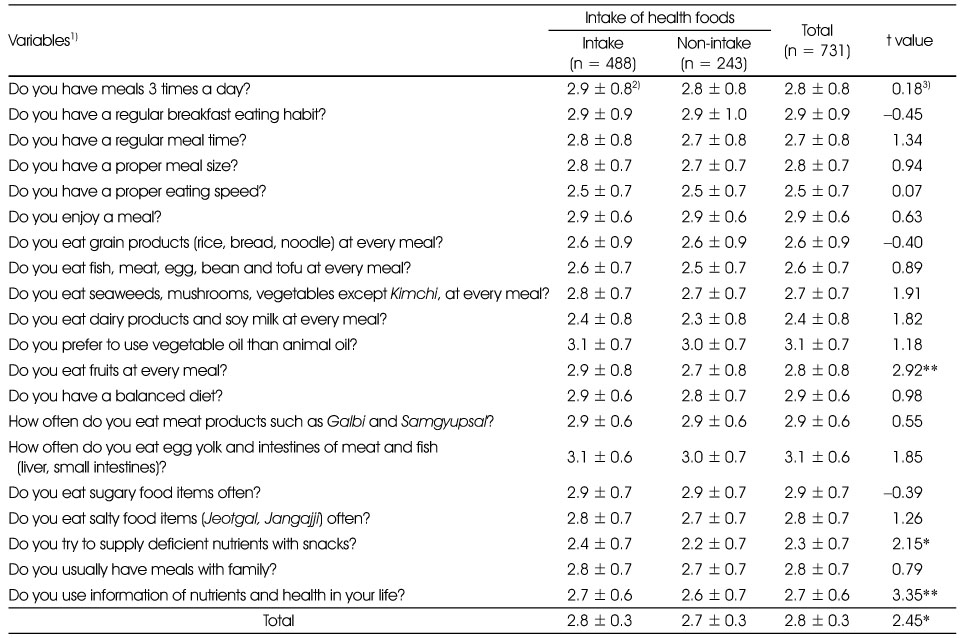
Dietary life of subjects according to intake of health foods
1) 4-point Likert scale (1: Not at all, 4: Very much)
2) Mean ± SD
*: p < 0.05, **: p < 0.01
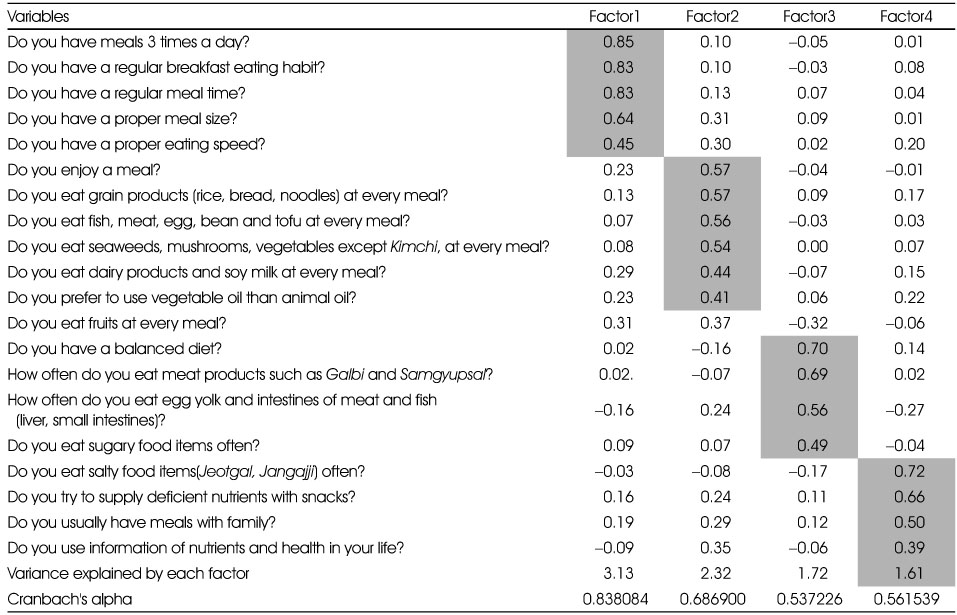
Factor analysis of dietary life associated questions
Factor scores of dietary life associated questions
1) Mean ±SD
***: p < 0.001
1) Mean ± SD
2) N (%)
1) Multiple responses
1) Mean ±SD
2) Multiple responses
3) N (%)
1) N (%)
2) Mean ± SD
1) N (%)
*: p < 0.05
1) 4-point Likert scale (1: Not at all, 4: Very much)
2) Mean ± SD
*: p < 0.05, **: p < 0.01
1) Mean ±SD
***: p < 0.001

 KSCN
KSCN

 PubReader
 Cite
Cite


