
Articles
- Page Path
- HOME > Korean J Community Nutr > Volume 19(6); 2014 > Article
-
Research Article
- The Risk of Metabolic Syndrome by Dietary Patterns of Middle-aged Adults in Gyeonggi Province
- You-Sin Lee, Moo-Yong Lee, Sim-Yeol Lee
-
Korean Journal of Community Nutrition 2014;19(6):527-536.
DOI: https://doi.org/10.5720/kjcn.2014.19.6.527
Published online: December 31, 2014
1Department of Home Economics Education, Dongguk University, Seoul, Korea.
2Cardiovascular Center, Dongguk University Ilsan Hospital, Goyang, Korea.
- Corresponding author: Sim-Yeol Lee. Department of Home Economics Education, Dongguk University, Seoul 110-715, Korea. Tel: (02) 2260-3413, Fax: (02) 2265-1170, slee@dongguk.edu
• Received: November 27, 2014 • Revised: December 23, 2014 • Accepted: December 30, 2014
Copyright © 2014 The Korean Society of Community Nutrition
This is an Open-Access article distributed under the terms of the Creative Commons Attribution Non-Commercial License (http://creativecommons.org/licenses/by-nc/3.0/) which permits unrestricted non-commercial use, distribution, and reproduction in any medium, provided the original work is properly cited.
- 1,442 Views
- 0 Download
- 4 Crossref
Abstract
-
Objectives
- The aim of this study was to assess how nutrient intakes are related to risk factors for metabolic syndrome according to dietary patterns in the middle-aged adults.
-
Methods
- The subjects (n = 187; 47 men, 140 women) consisted of middle-aged adults over 30 years old in Ilsan area. The metabolic syndrome was diagnosed according to the data collected from each subject, including anthropometric measurements and blood analyses. The dietary patterns were derived from the average of two-day dietary intake data.
-
Results
- Factor analysis identified three major dietary patterns which were "Meats and alcohol", "Mixed grains, vegetables and fruits", and "Rice, Kimchi and fish & shellfish". The daily intakes of energy, protein, and sodium increased across quartiles of "Meats and alcohol" pattern scores (p < 0.05), whereas the intakes of carbohydrates, potassium, calcium, and fiber increased across quartiles of "Mixed grains, vegetables and fruits" pattern scores (p < 0.001). The "Meats and alcohol" pattern scores were positively correlated with protein and sodium intakes but inversely correlated with carbohydrates, fiber and potassium intakes which were adjusted for age, sex and energy (p < 0.05). The highest quartile pattern score of "Meats and alcohol" pattern had elevated odds ratio of abdominal obesity and metabolic syndrome (p < 0.05). The risk of hypertriglyceridemia decreased in the highest quartile of "Mixed grains, vegetables and fruits" pattern (OR 0.35, 95% CI 0.12-1.00).
-
Conclusions
- Our results suggested that reducing the consumption of meat and alcohol along with increasing fruits, vegetables and mixed grains would be helpful for preventing the metabolic syndrome and chronic diseases.
- 1. Buyck JF, Blacher J, Kesse-Guyot E, Castetbon K, Galan P, Safar M, Hercberg S, Czernichow S. Differential associations of dietary sodium and potassium intake with blood pressure: a focus on pulse pressure. J Hypertens 2009; 27(6): 1158-1164.ArticlePubMed
- 2. Esmaillzadeh A, Kimiagar M, Mehrabi Y, Azadbakht L, Hu FB, Willett WC. Fruit and vegetable intakes, C-reactive protein, and the metabolic syndrome. Am J Clin Nutr 2006; 84(6): 1489-1497.ArticlePubMed
- 3. Flint AJ, Hu FB, Glyn RJ, Jensen MK, Franz M, Sampson L, Rimm EB. Whole grains and incident hypertension in men. Am J Clin Nutr 2009; 90(3): 493-498.ArticlePubMedPMC
- 4. Han BK, Kang YM, Ju SH, Shin MY, Kim JM, Rha SY, Joung KH, Lee JH, Kim KS, Kim HJ, Ku BJ. Effects of green whole grain mixed diet on body weight and waist circumference in patients with type 2 diabetes. Korean J Obes 2014; 23(1): 41-49.Article
- 5. Hoffmann IS, Cubeddu LX. Salt and the metabolic syndrome. Nutr Metab Cardiovasc Dis 2009; 19(2): 123-128.ArticlePubMed
- 6. Hong SY, Song YJ, Lee KH, Lee HS, Lee MS, Jee SH, Joung HJ. A fruit and dairy dietary pattern is associated with a reduced risk of metabolic syndrome. Metabolism 2012; 61(6): 883-890.ArticlePubMed
- 7. Hu FB. Dietary pattern analysis: a new direction in nutritional epidemiology. Curr Opin Lipidol 2002; 13(1): 3-9.ArticlePubMed
- 8. Jones JM, Reicks M, Adams J, Fulcher G, Weaver G, Kanter M, Marquart L. The importance of promoting a whole grain foods message. J Am coll nutr 2002; 21(4): 293-297.ArticlePubMed
- 9. Kang M, Joumg HJ, Lim JH, Lee YS, Song YJ. Secular trend in dietary patterns in a Korean adult population, using the 1998, 2001, and 2005 Korean National Health and Nutrition Examination Survey. Korean J Nutr 2011; 44(2): 152-161.Article
- 10. Kant AK. Dietary patterns and health outcomes. J Am Diet Assoc 2004; 104(4): 615-635.ArticlePubMed
- 11. Kim JH, JO IH. Grains, vegetables, and fish dietary pattern is inversely associated with the risk of metabolic syndrome in South Korean adults. J Am Diet Assoc 2011; 111(8): 1141-1149.ArticlePubMed
- 12. Lee S, Park HS, Kim SM, Kwon HS, Kim DY, Kim DJ, Cho GJ, Han JH, Kim SR, Park CY, Oh SJ, Lee CB, Kim KS, Oh SW, Kim YS, Choi WH, Yoo HJ. Cut-off Points of waist circumference for defining abdominal obesity in the Korean population. Korean J Obes 2006; 15(1): 1-9.
- 13. Lee SY, Park HS, Kim DJ, Han JH, Kim SM, Cho GJ, Kim DY, Kwon HS, Kim SR, Lee CB, Oh SJ, Park CY, Yook HJ. Appropriate waist circumference cutoff points for central obesity in Korean adults. Diabetes Res Clin Pract 2007; 75(1): 72-80.ArticlePubMed
- 14. Lee TY, Yoo HJ, Joo NS. Daily calcium intake and obesity in middle-aged Koreans. Korean J Obes 2009; 18(2): 59-64.
- 15. Lim HJ. A study on the sodium and potassium intakes and urinary excretion of adults in Busan. Korean J Community Nutr 2012; 17(6): 737-751.Article
- 16. Lim S, Shin H, Song JH, Kwak SH, Kang SM, Yoon JW, Choi SH, Cho SI, Park KS, Lee HK, Jang HC, Koh KK. Increasing prevalence of metabolic syndrome in Korea: the Korean National Health and Nutrition Examination Survey for 1998-2007. Diabetes care 2011; 34(6): 1323-1328.PubMedPMC
- 17. Moon HK, Kong JE. Assessment of nutrient intake for middle aged with and without metabolic syndrome using 2005 and 2007 Korean National Health and Nutrition Survey. Korean J Nutr 2010; 43(1): 69-78.Article
- 18. Mozumdar A, Liguori G. Persistent increase of prevalence of metabolic syndrome among U.S. adult: NHANES III to NHANES 1999-2006. Diabetes Care 2011; 34(1): 216-219.PubMed
- 19. Muzio F, Mondazzi L, Harris WS, Sommariva D. Effects of moderate variations in the macronutrient content of the diet on cardiovascular disease risk factors in obese patients with the metabolic syndrome. Am J Clin Nutr 2007; 86(4): 946-951.ArticlePubMed
- 20. National Cholesterol Education Program (NCEP), Expert Panel on Detection, Evaluation, and Treatment of High Blood Cholesterol in Adults (Adult Treatment Panel III). Third report of the National Cholesterol Education Program (NCEP) expert panel on detection, evaluation, and treatment of high blood cholesterol in adults (adult treatment panel III) final report. Circulation 2002; 106(25): 3143-3421.ArticlePubMed
- 21. Newby PK, Tucker KL. Empirically derived eating patterns using factor or cluster analysis: a review. Nutr Rev 2004; 62(5): 177-203.ArticlePubMed
- 22. Park YW, Zhu S, Palaniappan L, Heshka S, Carnethon MR, Heymsfield SB. The metabolic syndrome: prevalence and associated risk factor findings in the US population from the Third National Health and Nutrition Examination Survey, 1988-1994. Arch Intern Med 2003; 163(4): 427-436.ArticlePubMedPMC
- 23. Riccardi G, Giacco R, Rivellese AA. Dietary fat, insulin sensitivity and the metabolic syndrome. Clin Nutr 2004; 23(4): 447-456.ArticlePubMed
- 24. Rizzo NS, Sabaté J, Jaceldo-Siegl K, Fraser GE. Vegetarian dietary patterns are associated with a lower risk of metabolic syndrome: the adventist health study 2. Diabetes care 2011; 34(5): 1225-1227.PubMedPMC
- 25. Rumawas ME, Meigs JB, Dwyer JT, McKeown NM, Jacques PF. Mediterranean-style dietary pattern, reduced risk of metabolic syndrome traits, and incidence in the Framingham Offspring Cohort. Am J Clin Nutr 2009; 90(6): 1608-1614.ArticlePubMedPMC
- 26. Sacks FM, Svetkey LP, Vollmer WM, Appel LJ, Bray GA, Harsha D, Obarzanek E, Conlin PR, Miller ER, Simons-Morton DG, Karanja N, Lin PH. Effects on blood pressure of reduced dietary sodium and the dietary approaches to stop hypertension (DASH) diet. N Engl J Med 2001; 344(1): 3-10.ArticlePubMed
- 27. Sahyoun NR, Jacques PF, Zhang XL, Juan W, McKeown NM. Whole-grain intake is inversely associated with the metabolic syndrome and mortality in older adults. Am J Clin Nutr 2006; 83(1): 124-131.ArticlePubMed
- 28. Shin KO, Oh SY, Park HS. Empirically derived major dietary patterns and their associations with overweight in Korean preschool children. Br J Nutr 2007; 98(2): 416-421.ArticlePubMed
- 29. Son SH, Lee HJ, Park K, Ha TY, Seo JS. Nutritional evaluation and its relation to the risk of metabolic syndrome according to the consumption of cooked rice and cooked rice with multi-grains in Korean adults: based on 2007-2008 Korean National Health and Nutrition Examination Survey. Korean J Community Nutr 2013; 18(1): 77-87.Article
- 30. Song YJ, Joung HJ, Paik HY. Socioeconomic, nutrient, and health risk factors associated with dietary patterns in adult populations from 2001 Korean National Health and Nutrition Survey. Korean J Nutr 2005; 38(3): 219-225.
- 31. Statistics Korea. The statistics of mortality and the causes. 2013; cited November 25, 2014]. Available from http://www.kostat.go.kr.
- 32. The Korean Nutrition Society. Computer Aided Nutritional Analysis Program 4.0 for Professionals. 2011.
- 33. Van dam RM, Rimm EB, Willett WC, Stampfer MJ, Hu FB. Dietary patterns and risk for type 2 diabetes mellitus in U.S. men. Ann Intern Med 2002; 136(3): 201-209.ArticlePubMedLink
- 34. Wirfält E, Hedblad B, Gullberg B, Mattisson I, Andrén C, Rosander U, Janzon L, Berglund G. Food patterns and components of the metabolic syndrome in men and women: a cross-sectional study within the malmö diet and cancer cohort. Am J Epidemiol 2001; 154(12): 1150-1159.PubMed
- 35. Yang EJ, Kerver JM, Song WO. Dietary patterns of Korean Americans described by factor analysis. J Am Coll Nutr 2005; 24(2): 115-121.ArticlePubMed
- 36. Yoo H, Kim YH. A study on the characteristics of nutrient intake in metabolic syndrome subjects. Korean J Nutr 2008; 41(6): 510-517.
REFERENCES
Table 1Factor loading matrix for the 3 major dietary patterns according to intake amounts of food or food groups
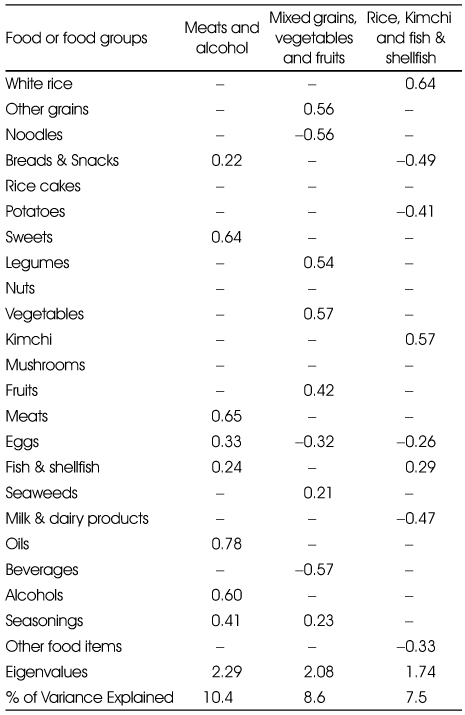
Table 2Comparison of characteristics by quartile scores of dietary patterns1)
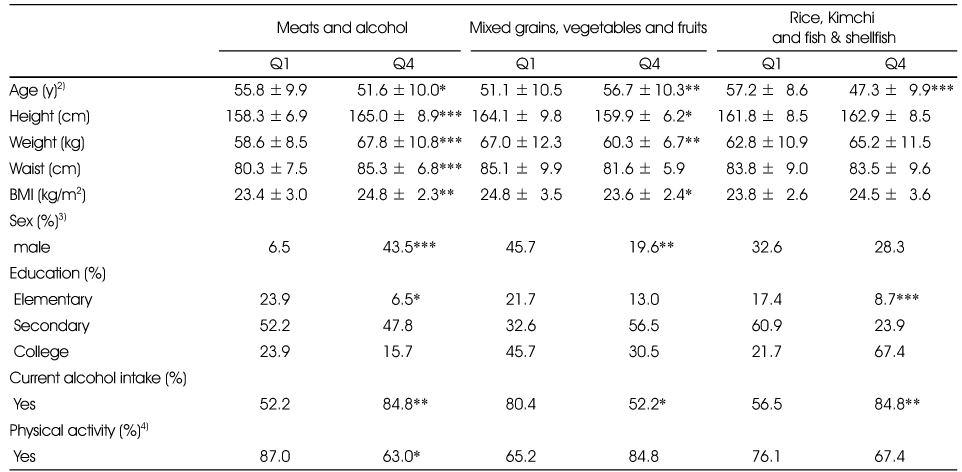
BMI: Body mass index
1) Factor score of each subject for a given factor was obtained by the sum of products of factor loading and standardized score of each variable, 2) Mean±SD, tested by linear trend test using generalized linear model, 3) %, tested by chi-square test, 4) Physical activity was assigned "Yes" if subjects engaged in physical activity at least 2 days or more per week.
*: p < 0.05, **: p < 0.01, ***: p < 0.001
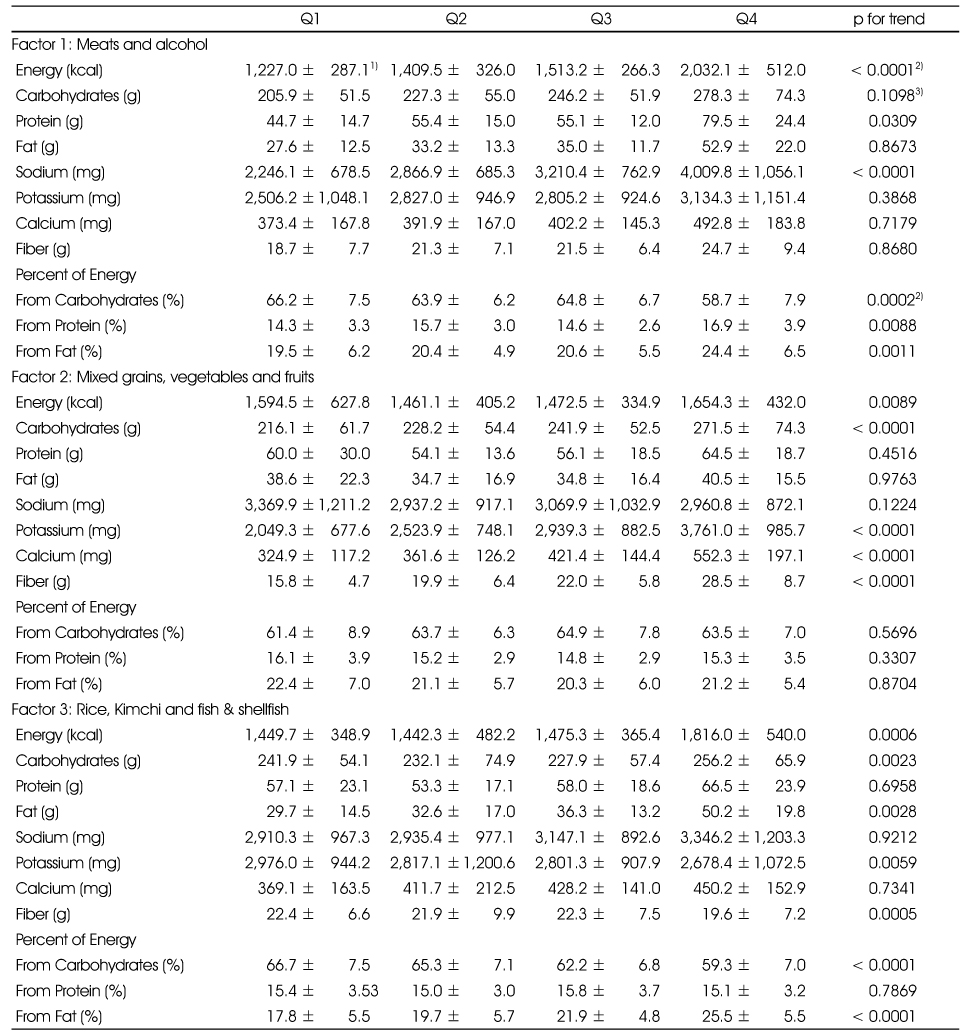
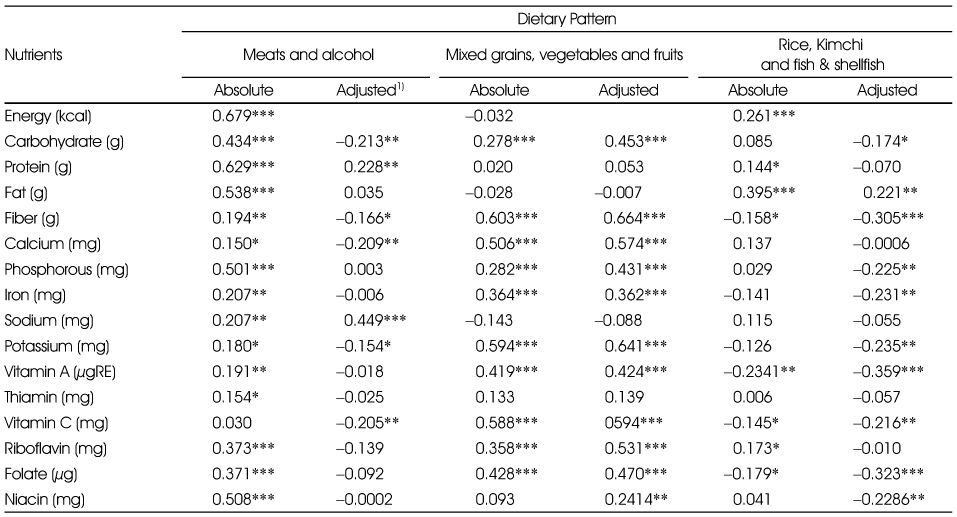
Table 5Odds ratios for metabolic syndrome and its components by quartile scores of dietary patterns
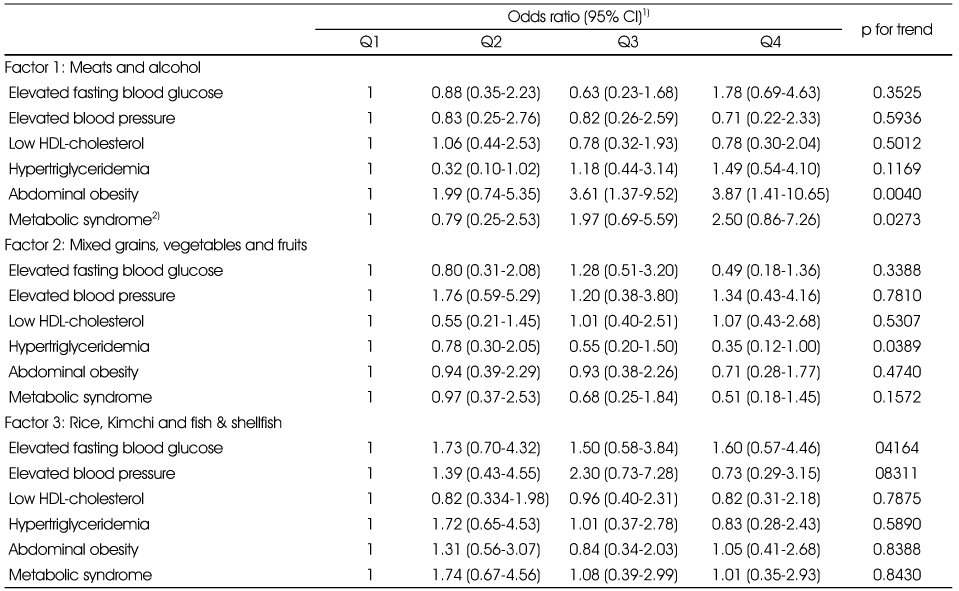
1) Odds ratios were adjusted by age, sex using logistic regression.
2) Serum fasting blood glucose ≥ 100 mg/dL; Systolic blood pressure ≥ 130 mm Hg or diastolic blood pressure ≥ 85 mm Hg; Low serum HDL cholesterol < 50 mg/dL for women or < 40 mg/dL for men; Serum TG ≥ 150 mg/dL; Waist circumference ≥ 85 cm for women or ≥ 90 cm for men.
Figure & Data
REFERENCES
Citations
Citations to this article as recorded by 
- Association between the Korean Healthy Diet Score and Metabolic Syndrome: Effectiveness and Optimal Cutoff of the Korean Healthy Diet Score
Soo-Hyun Kim, Hyojee Joung
Nutrients.2024; 16(19): 3395. CrossRef - The Relationship between Meal Regularity and Oral Health and Metabolic Syndrome of Adults in Single Korean Households
Jin-Ah Jung, Hye-Won Cheon, On-Ju Ju
Journal of Dental Hygiene Science.2021; 21(3): 185. CrossRef - Metabolic Syndrome Risk by Dietary Fat Energy Ratio in Middle-aged Men - Using the 2012~2013 Korean National Health and Nutrition Examination Survey Data -
Eun-Sil Her
The Korean Journal of Food And Nutrition.2016; 29(6): 1030. CrossRef - Reduction of Plasma Triglycerides and Cholesterol in High Fat Diet-Induced Hyper-Lipidemic Mice by n-3 Fatty Acid from Bokbunja (Rubus coreanus Miquel) Seed Oil
Hyelin Jeon, Su-Jin Oh, Hyun Soo Nam, Yoon Seok Song, Kyung-Chul Choi
Journal of the Korean Society of Food Science and Nutrition.2015; 44(7): 961. CrossRef
 Cite
CiteThe Risk of Metabolic Syndrome by Dietary Patterns of Middle-aged Adults in Gyeonggi Province
The Risk of Metabolic Syndrome by Dietary Patterns of Middle-aged Adults in Gyeonggi Province
Factor loading matrix for the 3 major dietary patterns according to intake amounts of food or food groups
Factor loadings less than ±0.20 are not shown for simplicity.
Comparison of characteristics by quartile scores of dietary patterns1)
BMI: Body mass index
1) Factor score of each subject for a given factor was obtained by the sum of products of factor loading and standardized score of each variable, 2) Mean±SD, tested by linear trend test using generalized linear model, 3) %, tested by chi-square test, 4) Physical activity was assigned "Yes" if subjects engaged in physical activity at least 2 days or more per week.
*: p < 0.05, **: p < 0.01, ***: p < 0.001
Nutrient intakes by quartile scores of dietary patterns
1) Mean±SD, 2) Adjusted for age, sex, 3) Adjusted for age, sex and energy intake
Correlation coefficients between nutrient intakes and scores of dietary patterns
1) Adjusted for age, sex and energy intake.
*: p < 0.05, **: p < 0.01, ***: p < 0.001
Odds ratios for metabolic syndrome and its components by quartile scores of dietary patterns
1) Odds ratios were adjusted by age, sex using logistic regression.
2) Serum fasting blood glucose ≥ 100 mg/dL; Systolic blood pressure ≥ 130 mm Hg or diastolic blood pressure ≥ 85 mm Hg; Low serum HDL cholesterol < 50 mg/dL for women or < 40 mg/dL for men; Serum TG ≥ 150 mg/dL; Waist circumference ≥ 85 cm for women or ≥ 90 cm for men.
Table 1
Factor loading matrix for the 3 major dietary patterns according to intake amounts of food or food groups
Factor loadings less than ±0.20 are not shown for simplicity.
Table 2
Comparison of characteristics by quartile scores of dietary patterns1)
BMI: Body mass index 1) Factor score of each subject for a given factor was obtained by the sum of products of factor loading and standardized score of each variable, 2) Mean±SD, tested by linear trend test using generalized linear model, 3) %, tested by chi-square test, 4) Physical activity was assigned "Yes" if subjects engaged in physical activity at least 2 days or more per week. *: p < 0.05, **: p < 0.01, ***: p < 0.001
Table 3
Nutrient intakes by quartile scores of dietary patterns
1) Mean±SD, 2) Adjusted for age, sex, 3) Adjusted for age, sex and energy intake
Table 4
Correlation coefficients between nutrient intakes and scores of dietary patterns
1) Adjusted for age, sex and energy intake. *: p < 0.05, **: p < 0.01, ***: p < 0.001
Table 5
Odds ratios for metabolic syndrome and its components by quartile scores of dietary patterns
1) Odds ratios were adjusted by age, sex using logistic regression. 2) Serum fasting blood glucose ≥ 100 mg/dL; Systolic blood pressure ≥ 130 mm Hg or diastolic blood pressure ≥ 85 mm Hg; Low serum HDL cholesterol < 50 mg/dL for women or < 40 mg/dL for men; Serum TG ≥ 150 mg/dL; Waist circumference ≥ 85 cm for women or ≥ 90 cm for men.


