Articles
- Page Path
- HOME > Korean J Community Nutr > Volume 21(3); 2016 > Article
-
Research Article
- Diet and Health Status of Elderly Women According to the Family Type
-
Mi-Kyeong Choi, Myung-Hwa Kang, Mi-Hyun Kim

-
Korean Journal of Community Nutrition 2016;21(3):256-264.
DOI: https://doi.org/10.5720/kjcn.2016.21.3.256
Published online: June 30, 2016
1Division of Food Science, Kongju National University, Yesan, Korea.
2Department of Food Science and Nutrition, Hoseo University, Asan, Korea.
3Department of Food and Nutrition, Korea National University of Transportation, Jeungpyeong, Korea.
- Corresponding author: Mi-Hyun Kim. Department of Food and Nutrition, Korea National University of Transportation, 61 Daehak-ro, Jeungpyeong-gun, Chungbuk 16106, Korea. Tel: (043) 820-5335, Fax: (043) 820-5335, mhkim1129@ut.ac.kr
Copyright © 2016 The Korean Society of Community Nutrition
This is an Open-Access article distributed under the terms of the Creative Commons Attribution Non-Commercial License (http://creativecommons.org/licenses/by-nc/3.0/) which permits unrestricted non-commercial use, distribution, and reproduction in any medium, provided the original work is properly cited.
- 581 Views
- 0 Download
- 8 Crossref
Abstract
-
Objectives
- This study aimed to evaluate the diet and health status of elderly women according to the family type.
-
Methods
- A total of 307 elderly women participated in this study were divided into one of three groups according to their family type: residing with spouse (RSP; n=88), residing with son or daughter (RSD; n=119), and residing alone (RAL; n=100). Chi-square test was used to assess dietary habits and health status of the subjects by the family types.
-
Results
- Results demonstrated significant associations between eating regular meals, person preparing meals, coffee intake, and bone fracture experience and family type. Among the three groups, the RSP and RAL groups had a higher percentage for preparing meals by themselves (p<0.001) than the RSD group. The RAL group had a lower percentage for eating regular meals (p<0.01) but a higher percentage for bone fracture experience (p<0.05) than the other groups. There were no significant differences in monthly allowance, self-estimated health status, physical activity, exercise, drinking, and dietary habits such as frequency of consumption of dairy, beans, eggs, fish, meat, fruits, and vegetables among the three groups.
-
Conclusions
- The results showed that elderly women residing alone without a son, daughter, or spouse had more diet-related and health problems such as irregular meals and high bone fracture experience. These findings suggested that elderly women residing alone need more attention and support.
- 1. Statistics Korea. 2014 Statistics of elderly in Korea [internet]. 2015; cited 2016 Mar 16]. Available from: http://www.kostat.go.kr/portal/korea/kor_nw/2/1/index.board?bmode=read&aSeq=330349.
- 2. Kang Y, Kim M, Lee E. The relationship of perceived health status, activities of daily living and nutrition status in the community-dwelling Korea elderly. J Korean Acad Nurs 2008; 38(1): 122-130.Article
- 3. Yang EJ, Bang HM. Nutritional status and health risks of low income elderly women in Gwangju area. Korean J Nutr 2008; 41(1): 65-76.
- 4. Park JK, Son SM. The dietary behaviors, depression rates and nutrient intakes of the elderly females living alone. Korean J Community Nutr 2003; 8(5): 716-725.
- 5. Lim YJ, Choi YS. Seasonal nutrient intakes of elderly women living alone as compared to those living with family in the Gyeongbuk rural area. Korean J Community Nutr 2007; 12(1): 58-67.
- 6. Shin SK, Kim HJ, Choi BY, Lee SS. A comparison of food frequency for the elderly regarding different family types: based on Community Health Survey for 2008. Korean J Nutr 2012; 45(3): 264-273.Article
- 7. Tak YJ, Kim YJ, Lee SY, Lee JG, Jung DW, Yi YH. Health care behavior of people 60 years and older in Korea according to family type and sociodemographic factors - the 5th Korea National Health and Nutrition Examination Survey. J Korean Geriatr Soc 2013; 17(1): 7-17.Article
- 8. Korea Institute for Health and Social Affairs. 2014 Survey of Korean elderly [internet]. 2014; cited 2016 Mar 16]. Available from: http://www.mohw.go.kr/front_new/jb/sjb030301vw.jsp.
- 9. Lee YJ, Kwon MK, Baek HJ, Lee SS. Comparative analysis of food intake according to the family type of elderly women in Seoul area. J Nutr Health 2015; 48(3): 277-288.Article
- 10. Lee S, Lee KW, Oh JE, Cho MS. Nutritional and health consequences are associated with food insecurity among Korean elderly: based on the fifth (2010) Korea National Health and Nutrition Examination Survey (KNHANES V-1). J Nutr Health 2015; 48(6): 519-529.Article
- 11. de Morais C, Oliveira B, Afonso C, Lumbers M, Raats M, de Almeida MD. Nutritional risk of European elderly. Eur J Clin Nutr 2013; 67(11): 1215-1219.ArticlePubMedPDF
- 12. Yim KS, Lee TY. Sociodemographic factors associated with nutrients intake of elderly in Korea. Korean J Nutr 2004; 37(3): 210-222.
- 13. Kwak CS, Yon M, Lee MS, Oh SI, Park SC. Anthropometric index and nutrient intake in Korean aged 50 plus years living in Kugoksoondam longevity-belt region in Korea. Korean J Community Nutr 2010; 15(3): 308-328.
- 14. Jang JS, Hong MS. A study on health-related lifestyle, dietary habits, nutritional knowledge and food intake of the elder in Gyeong-gi area. Korean J Food Nutr 2015; 28(6): 1056-1064.
- 15. Walker D, Beauchene RE. The relationship of loneliness, social isolation, and physical health to dietary adequacy of independently living elderly. J Am Diet Assoc 1991; 91(3): 300-304.
- 16. Hawkley LC, Cacioppo JT. Loneliness and pathways to disease. Brain Behav Immun 2003; 17: Suppl 1. S98-S105.
- 17. Perissinotto CM, Stijacic Cenzer I, Covinsky KE. Loneliness in older persons: a predictor of functional decline and death. Arch Intern Med 2012; 172(14): 1078-1084.PubMedPMC
- 18. Sahni S, Mangano KM, McLean RR, Hannan MT, Kiel DP. Dietary approaches for bone health: Lessons from the Framingham osteoporosis study. Curr Osteoporos Rep 2015; 13(4): 245-255.
- 19. Kelly G. Aerobic exercise and lumbar spine bone mineral density in postmenopausal women: a meta-analysis. J Am Geriatr Soc 1998; 46(2): 143-152.PubMed
- 20. Lee HS, Chang MJ. Effect of family type on the nutrient intake and nutritional status in elderly women. J Korean Soc Food Sci Nutr 1999; 28(4): 934-941.
- 21. Kharicha K, Iliffe S, Harari D, Swift C, Gillmann G, Stuck AE. Health risk appraisal in older people 1: are older people living alone an "at-risk" group? Br J Gen Pract 2007; 57(537): 271-276.PubMedPMC
- 22. Fox CM, Harper AP, Hyner GC, Lyle RM. Loneliness, emotional repression, marital quality, and major life events in women who develop breast cancer. J Community Health 1994; 19(6): 467-482.PubMed
- 23. Hawkley LC, Thisted RA, Masi CM, Cacioppo JT. Loneliness predicts increased blood pressure: five-year cross-lagged analyses in middle-aged and older adults. Psychol Aging 2010; 25(1): 132-141.
- 24. Del Brutto OH, Tettamanti D, Del Brutto VJ, Zambrano M, Montalvan M. Living alone and cardiovascular health status in residents of a rural village of coastal Ecuador (The Atahualpa Project). Environ Health Prev Med 2013; 18(5): 422-425.PubMedPMC
- 25. Udell JA, Steg PG, Scirica BM, Smith SC, Ohman EM, Eagle KA. Living alone and cardiovascular risk in outpatients at risk of or with atherothrombosis. Arch Intern Med 2012; 172(14): 1086-1095.PubMed
- 26. Michael YL, Berkman LF, Colditz GA, Holmes MD, Kawachi I. Social networks and health-related quality of life in breast cancer survivors: A prospective study. J Psychosom Res 2002; 52(5): 285-293.PubMed
- 27. Chung MS, Kang KJ. A survey on the health, food perceptions, and food habits of urban elderly men: with special reference to elderly men in the Tap-gol park. J Korean Soc Food Cult 1996; 11(4): 455-463.
REFERENCES
Figure & Data
REFERENCES
Citations

- Mental Health and Handgrip Strength Among Older Adults: A Nationwide Study
Yeunhee Kwak, Yoonjung Kim
INQUIRY: The Journal of Health Care Organization, Provision, and Financing.2022;[Epub] CrossRef - Health and nutrition intake status of the Korean elderly according to their food security level: data from the 7th Korea National Health and Nutrition Examination Survey (KNHANES VII), 2016–2018
Ahreum Maeng, Jeehyun Lee, Eunju Yoon
Journal of Nutrition and Health.2021; 54(2): 179. CrossRef - Sex-Associated Differences in the Handgrip Strength of Elderly Individuals
Yeunhee Kwak, Yoonjung Kim, Haekyung Chung
Western Journal of Nursing Research.2020; 42(4): 262. CrossRef - Social participation, health‐related behavior, and depression of older adults living alone in Korea
Seojin Won, Hyemee Kim
Asian Social Work and Policy Review.2020; 14(1): 61. CrossRef - Evaluation of the Nutrition Status and Metabolic Syndrome Prevalence of the Members according to the Number of Household Members based on the Korea National Health and Nutrition Examination Survey (2013–2014)
Jin-Young Lee, Soo-Kyong Choi, Jung-Sook Seo
Korean Journal of Community Nutrition.2019; 24(3): 232. CrossRef - Quality of life and subjective health status according to handgrip strength in the elderly: a cross-sectional study
Yeunhee Kwak, Yoonjung Kim
Aging & Mental Health.2019; 23(1): 107. CrossRef - Eating alone and metabolic syndrome: A population-based Korean National Health and Nutrition Examination Survey 2013–2014
A Rom Kwon, Yeong Sook Yoon, Kyong Pil Min, Yoon Kyung Lee, Ji Ho Jeon
Obesity Research & Clinical Practice.2018; 12(2): 146. CrossRef - Effects of the Elderly's Health Statuses, Health Behavior, and Social Relations on Their Health-related Quality of Life: Focusing on Family Types
Young Bum Kim, Seung-Hee Lee
Journal of Korean Academy of Community Health Nursing.2018; 29(3): 310. CrossRef
General characteristics of the elderly women according to family type
1) Mean±SD
2) F-value analyzed by ANOVA test
3) N (%)
a, b:Different superscript letters in a row indicate significant difference computed by Duncan's multiple range test at α=0.05
*: p < 0.05, ***: p < 0.001
Anthropometry of the elderly women according to family type
1) Mean±SD
2) Body mass index
3) N (%)
4) χ2-value analyzed by χ2 test
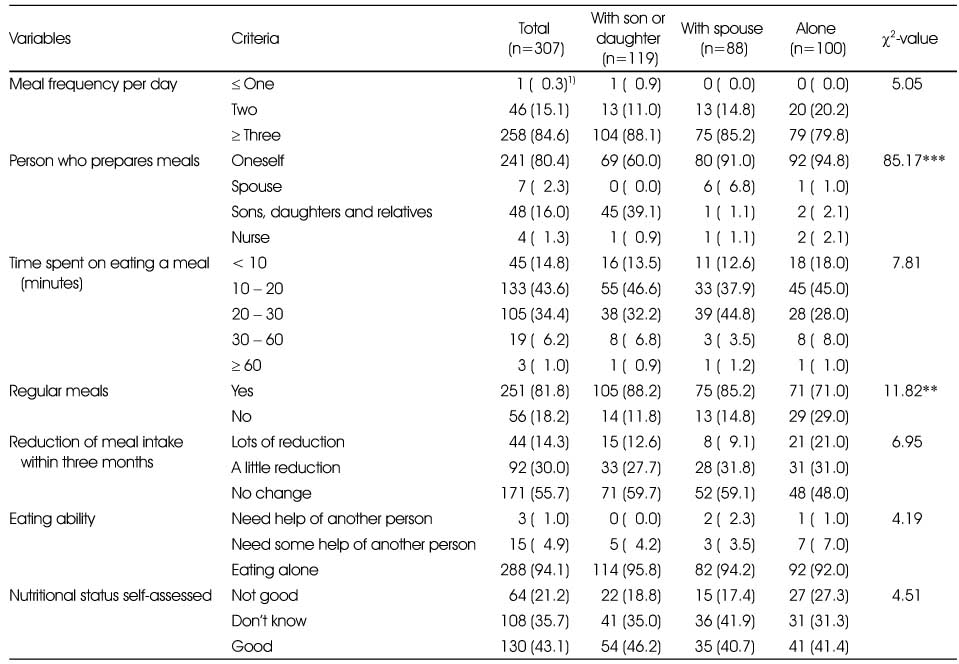
Dietary behaviors of the elderly women according to family type
1) N (%)
**: p < 0.01, ***: p < 0.001
Dietary habits of the elderly women according to family type
1) N (%)
2) Mean±SD
3) F-value analyzed by ANOVA test
a, b: Different superscript letters in a row indicate significant difference computed by Duncan's multiple range test at α=0.05
*: p < 0.05
Perceived health status of the elderly women according to family type
1) N (%)
*: p < 0.05
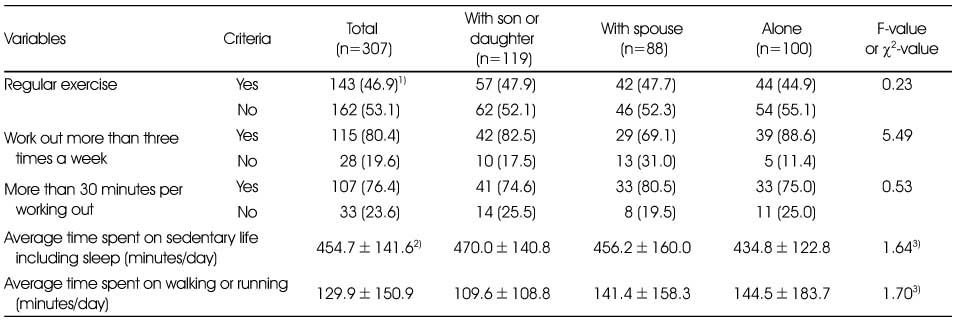
Activity and exercise status of the elderly women according to family type
1) N (%)
2) Mean±SD
3) F-value analyzed by ANOVA test
1) Mean±SD 2) F-value analyzed by ANOVA test 3) N (%) a, b:Different superscript letters in a row indicate significant difference computed by Duncan's multiple range test at α=0.05 *: p < 0.05, ***: p < 0.001
1) Mean±SD 2) Body mass index 3) N (%) 4) χ2-value analyzed by χ2 test
1) N (%) **: p < 0.01, ***: p < 0.001
1) N (%) 2) Mean±SD 3) F-value analyzed by ANOVA test a, b: Different superscript letters in a row indicate significant difference computed by Duncan's multiple range test at α=0.05 *: p < 0.05
1) N (%) *: p < 0.05
1) N (%) 2) Mean±SD 3) F-value analyzed by ANOVA test

 KSCN
KSCN


 PubReader
 Cite
Cite


