Articles
- Page Path
- HOME > Korean J Community Nutr > Volume 24(6); 2019 > Article
-
Research Article
- Effects of Low-Calorie Diet Including High Protein-Low Carbohydrate Protein Bar on Weight Loss and Serum Lipid Indicators in Overweight Women according to Dietary Compliance
-
Dasom Park
 , Hyun Joo Lee
 , Sook Mee Son
-
Korean Journal of Community Nutrition 2019;24(6):485-496.
DOI: https://doi.org/10.5720/kjcn.2019.24.6.485
Published online: December 31, 2019
1Department of Clinical Nutrition, Seoul National University Bundang Hospital, Seongnam, Korea, Internship.
2Department of Food Science and Nutrition, The Catholic University of Korea, Bucheon, Korea, graduate student.
3Department of Food Science and Nutrition, The Catholic University of Korea, Bucheon, Korea, Professor.
- Corresponding author: Sook Mee Son. Department of Food Science and Nutrition, 43, Jibong-ro, Bucheon-si, Gyeonggi-do 14662, Korea. Tel: (02) 2164-4318, Fax: (02) 2164-6583, sonsm@catholic.ac.kr
Copyright © 2019 The Korean Society of Community Nutrition
This is an Open-Access article distributed under the terms of the Creative Commons Attribution Non-Commercial License (http://creativecommons.org/licenses/by-nc/3.0/) which permits unrestricted non-commercial use, distribution, and reproduction in any medium, provided the original work is properly cited.
- 842 Views
- 9 Download
- 1 Crossref
Abstract
-
Objectives
- This study was conducted to investigate the effect of a 6-week low-calorie diet (LCD) program including high protein-low carbohydrate protein bar on weight loss, blood pressure, and blood lipid profile in 40 overweight women according to dietary compliance.
-
Methods
- Subjects were 62 healthy overweight women (BMI ≥ 23.0 or body fat percentage ≥ 28%), aged 20~59 yrs who were provided a high protein-low carbohydrate protein bar (each 35 g, 154 kcal, protein energy %: 28.6%, carbohydrate energy %: 38.7%) as part of dinner for 6 weeks. Forty subjects who completed the whole diet program were categorized into high compliance (HC) group (days of eating protein bar ≥ 5 weeks) or low compliance (LC) group (days < 5 weeks).
-
Results
- Energy intake significantly decreased from 1,867.5 kcal at baseline to 1,137.4 kcal at 6 weeks for the HC group and from 1,971.7 kcal to 1,362.2 kcal for the LC group, respectively. On the other hand, a significant increase in protein energy percentage was observed in each group (HC group: 3.5%, LC group: 2.2%). Both groups showed significant decreases in weight (HC group: 1.8 kg, LC group: 1.1 kg), BMI, fat mass, systolic blood pressure, total cholesterol, and LDL-cholesterol. Reduction of body fat percentage and diastolic blood pressure were only observed in the HC group.
-
Conclusions
- The inclusion of a high protein-low carbohydrate protein bar as part of a low-calorie diet for a short period can be effective to achieve weight loss and concomitantly improve blood cholesterol level without serious physiological side effects. More evident results can be achieved by eating a diet with low calorie diet including high protein-low carbohydrate protein bar for more than 5 weeks.
- 1. Flegal KM. Epidemiologic aspects of overweight and obesity in the United States. Physiol Behav 2005; 86(5): 599-602.ArticlePubMed
- 2. The Ministry of Health and Welfare, Centers for Disease Control and Prevention. Korea health statistics 2016: Korea National Health and Nutrition Examination Survey (KNHANES VII-1). Sejong: The Ministry of Health and Welfare; 2017. p. 39.
- 3. Wilson PW, D'Agostino RB, Sullivan L, Parise H, Kannel WB. Overweight and obesity as determinants of cardiovascular risk: the Framingham experience. Arch Intern Med 2002; 162(16): 1867-1872.ArticlePubMed
- 4. Renehan AG, Suerjumataram I. Obesity as an avoidable cause of cancer (Attributable risk). Recent Results Cancer Res 2016; 208: 243-256.PubMed
- 5. Bacon SL, Sherwood A, Hinderliter A, Blumenthal JA. Effects of exercise, diet and weight loss on high blood pressure. Sports Med 2004; 34(5): 307-316.ArticlePubMed
- 6. Feingold KR, Grunfeld C. Obesity and dyslipidemia [Internet]. MDTxet.com Inc.; 2018; cited 2019 11 25]. Available from: www.endotext.org.
- 7. Knowler WC, Barrett Connor E, Fowler SE, Hamman RF, Lachin JM, Walker EA, et al. Reduction in the incidence of type 2 diabetes with lifestyle intervention or metformin. N Engl J Med 2002; 346(6): 393-403.ArticlePubMedPMC
- 8. Epstein LH, Valoski A, Wing RR, McCurley J. Ten-year follow-up of behavioral, family-based treatment for obese children. JAMA 1990; 264(19): 2519-2523.ArticlePubMed
- 9. Son SM, Kim HJ. Effect of 12-week low calorie diet and behavior modification on the anthropometric indices and biochemical nutritional status of obese woman. Korean J Community Nutr 2005; 10(4): 525-535.
- 10. Dansinger ML, Gleason JA, Griffith JL, Selker HP, Schaefer EJ. Comparison of the Akins, Ornish, Weight Watchers and Zone diets for weight loss and heart disease risk reduction: a randomized trials. JAMA 2005; 293(1): 43-53.ArticlePubMed
- 11. Sayer R, Peters JC, Pan Z, Wyatt HR, Hill JD. Hunger, food cravings, and diet satisfaction are related to changes in body weight during a 6-month behavioral weight loss intervention: The beef WISE study. Nutrients 2018; 10(6): 700-712.ArticlePubMedPMC
- 12. Holt SHA, Miller JCB, Petocz P. Interrelationships among postprandial satiety, glucose and insulin responses and change in subsequent food intake. Eur J Clin Nutr 1996; 50(12): 788-797.PubMed
- 13. Eckel RH. The dietary approach to obesity: is it diet or disorder. Am J Clin Nutr 2005; 293(1): 96-97.
- 14. Brehm BJ, D'Alessio DA. Benefits of high protein weight loss diet: enough evidence for practice. Curr Opin Endocrinol Diabetes Obes 2008; 15(5): 416-421.PubMed
- 15. Westerterp-Plantenga MS, Rolland V, Wilson SA, Westerterp KR. Satiety related to 24-hr diet-induced thermogenesis during high protein/carbohydrate vs high fat diets measured in respiration center. Eur J Clin Nutr 1999; 53(6): 495-502.ArticlePubMedPDF
- 16. Cho YG, Kang JH. Effectiveness and safety of low-carbohydrate diets. Korean Med Assoc 2017; 60(1): 43-46.ArticlePDF
- 17. Westerterp-Plantenga MS, Luscombe-Marsh N, Lejeune MPGM, Diepvens K, Nieuwenhuizen A, Engelen MPKJ, et al. Dietary protein, metabolism, and body weight regulation: dose-response effects. Int J Obesity 2006; 30: S16-S23.ArticlePDF
- 18. Soenen S, Bonomi AG, Lemmens SG, Scholte J, Thjssen MA, van Berkum F, et al. Relatively high protein or low carb energy restricted diets for body weight loss and body weight maintenance. Physiol Behav 2012; 107(3): 374-380.ArticlePubMed
- 19. Feinman RD, Pogozelski WK, Astrup A, Bernstein RK, Fine EJ, Westman EC, et al. Dietary carbohydrate restriction as the first approach in diabetes management: Critical review and evidence base. Nutrition 2015; 31(1): 1-13.ArticlePubMed
- 20. Song S, Lee JE, Song WO, Paik HY, Song Y. Carbohydrate intake and refined-grain consumption are associated with metabolic syndrome in the Korean adult population. J Acad Nutr Diet 2014; 114(1): 54-62.ArticlePubMed
- 21. The Ministry of Health and Welfare, The Korean Nutrition Society. Dietary reference intake for Koreans. 2nd version. Seoul: The Korean Nutrition Society; 2010.
- 22. Xi MZ, Zhang YL, Choi YB, Jeong GH, Kim GW, Park YW, et al. Effects of whey protein-rich meal substitute in 4-week diet trial on body weight, body fat, and body composition of overweight or obese females. J East Asian Soc Dietary Life 2016; 26(1): 25-33.Article
- 23. Heymsfield SB, van Mierlo CAJ, van der Knaap HCM, Heo M, Frier HI. Weight management using a meal replacement strategy: Meta and pooling analysis from six studies. Int J Obes 2003; 27(5): 537-549.ArticlePDF
- 24. Miller PE, Alexander DD, Perez V. Effects of whey protein and resistance exercise on body composition: A meta-analysis of randomized controlled trials. J Am Coll Nutr 2014; 33(2): 163-175.ArticlePubMed
- 25. Mattes RD. Ready-to-eat cereal used as a meal replacement promotes weight loss in humans. J Am Coll Nutr 2002; 21(6): 570-577.ArticlePubMed
- 26. Fuller NR, Fong M, Gerofi J, Leung L, Leung C, Denyer G, et al. A randomized controlled trial to determine the efficacy of a high carbohydrate and high protein ready-to-eat food product for weight loss. Clin Obes 2016; 6(2): 108-116.ArticlePubMed
- 27. Trumbo P, Schlicker S, Yates AA, Poos M. Dietary reference intakes for energy, carbohydrate, fiber, fat, fatty acids, cholesterol, protein and amino acids. J Am Diet Assoc 2002; 102(11): 1621-1630.ArticlePubMed
- 28. Westerterp-Plantenga MS, Rolland V, Wilson SAJ, Westerterp KR. Satiety related to 24 h diet induced thermogenesis during high protein/carbohydrate vs high fat diets measured in a respiration chamber. Eur J Clin Nutr 1999; 53(6): 495-502.ArticlePubMedPDF
- 29. Lejeune MPGM, Kovacs EMR, Westerterp-Plantenga MS. Additional protein intake limits weight regain after weight loss in humans. Br J Nutr 2005; 93(2): 281-289.ArticlePubMed
- 30. Pullar JD, Webster AJF. The energy cost of fat and protein deposition in the rat. Br J Nutr 1977; 37(3): 355-363.ArticlePubMed
- 31. Atkins RC. Dr Atkins new diet revolution. 1st Quil ed. New York: Quill; 2002.
- 32. Lee BG, Lee KR, Song MK, Park MH, Whang SJ. Short-term weight management using meal replacements (Meal replacements trial in Korean obese women). Korean J Obes 2002; 11(2): 131-141.
- 33. Son SM, Lim HS, Kim JH, Seou JS, Son JM. Clinical nutrition. 3rd ed. Paju: Kyomunsa; 2014. p. 284-285.
- 34. Lee MS, Kim JH, Lee BS, Lee YN, Son SM, Lee JW. Nutritional assessment. Paju: Kyomunsa; 2016.
- 35. Knutson KL. Does inadequate sleep play a role in vulnerability to obesity? Am J Hum Biol 2012; 24(3): 361-371.ArticlePubMedPMC
- 36. de Wardener HE, MacGregor GA. Harmful effects of dietary salt in addition to hypertension. J Hum Hypertens 2002; 16(4): 213-223.ArticlePubMedPDF
- 37. Moon SJ, Kim HS, Kim JH, Park GS, You YH. The effect of weight control on obese women. Korean J Nutr 1995; 28(8): 759-770.
- 38. Taku K, Umegaki K, Sato Y, Taki Y, Endoh K, Watanabe S. Soy isoflavones lower serum total and LDL cholesterol in humans: a meta-analysis of 11 randomized controlled trials. Am J Clin Nutr 2007; 85(4): 1148-1156.ArticlePubMed
- 39. Potter SM. Overview of proposed mechanisms for the hypocholesterolemic effect of soy. J Nutr 1995; 125(3): 606s-611s.ArticlePubMed
REFERENCES
Changes of body composition and blood pressure of each group comparing baseline, 3 weeks and 6weeks
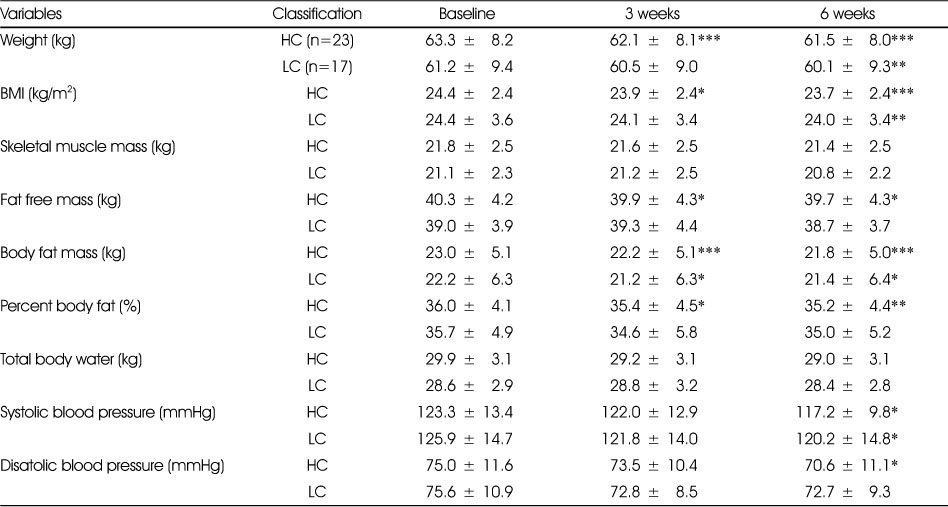
Figure & Data
REFERENCES
Citations

- 규칙적 운동 수행에 따른 MZ세대의 고단백 식품 인식 및 섭취 패턴 비교 연구
지선 김, 영일 박, 나미 주
Korean Journal of Food and Cookery Science.2024; 40(5): 335. CrossRef
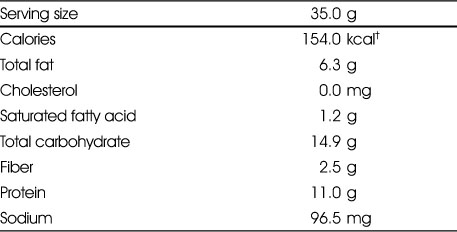
Nutritional profile of high protein-low carbohydratre protein bar*
* Ingredients: Isolated soybean protein, Brazil nut, Almond, Peanut, Lentils, Brown rice, Peanut butter, Fructo oligosaccharide, Honey, Grain syrup, Cranberry, Vanilla powder
† Nutrients of protein bar were analyzed by SGS Korea (Seoul, Korea)
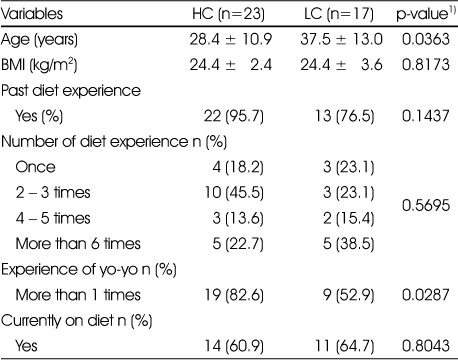
General characteristics according to the group
Values are Mean ± SD or N (%)
1) P-value determeined by t-test for continuous variable and Fisher's exact test for categorical variable.
HC: High compliance
LC: Low compliance
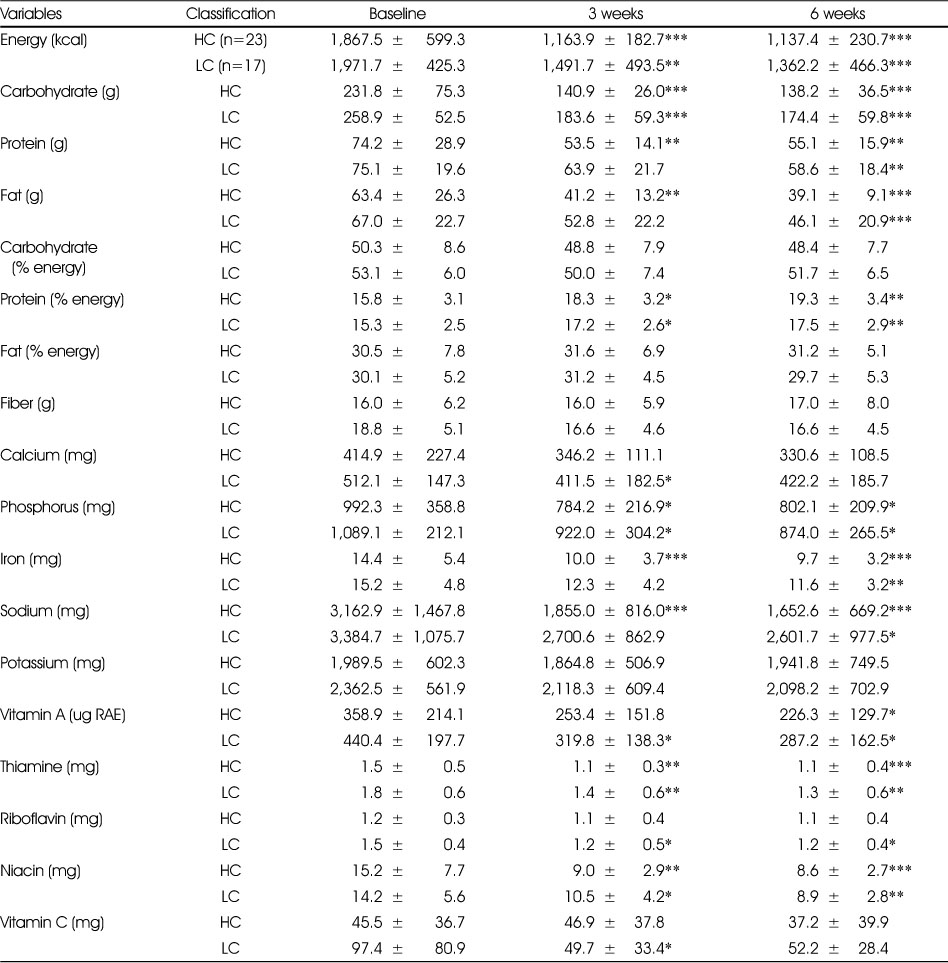
Changes of nutrient intake of each group comparing baseline, 3 weeks and 6weeks
Values are mean ± SD
Significantly different compared to baseline measurement by paired t-test. *: p<0.05, **: p<0.01, ***: p<0.001
HC: High compliance, LC: Low compliance
Changes of body composition and blood pressure of each group comparing baseline, 3 weeks and 6weeks
Values are mean ± SD
Significantly different compared to baseline measurement by paired t-test. *: p<0.05, **: p<0.01, ***: p<0.001
HC: High compliance, LC: Low compliance
Changes of serum indicators of each group comparing baseline and 6 weeks
Values are mean ± SD
Significantly different compared to baseline measurement by paired t-test. *: p<0.05, **: p<0.01, ***: p<0.001
HC: High compliance, LC: Low compliance
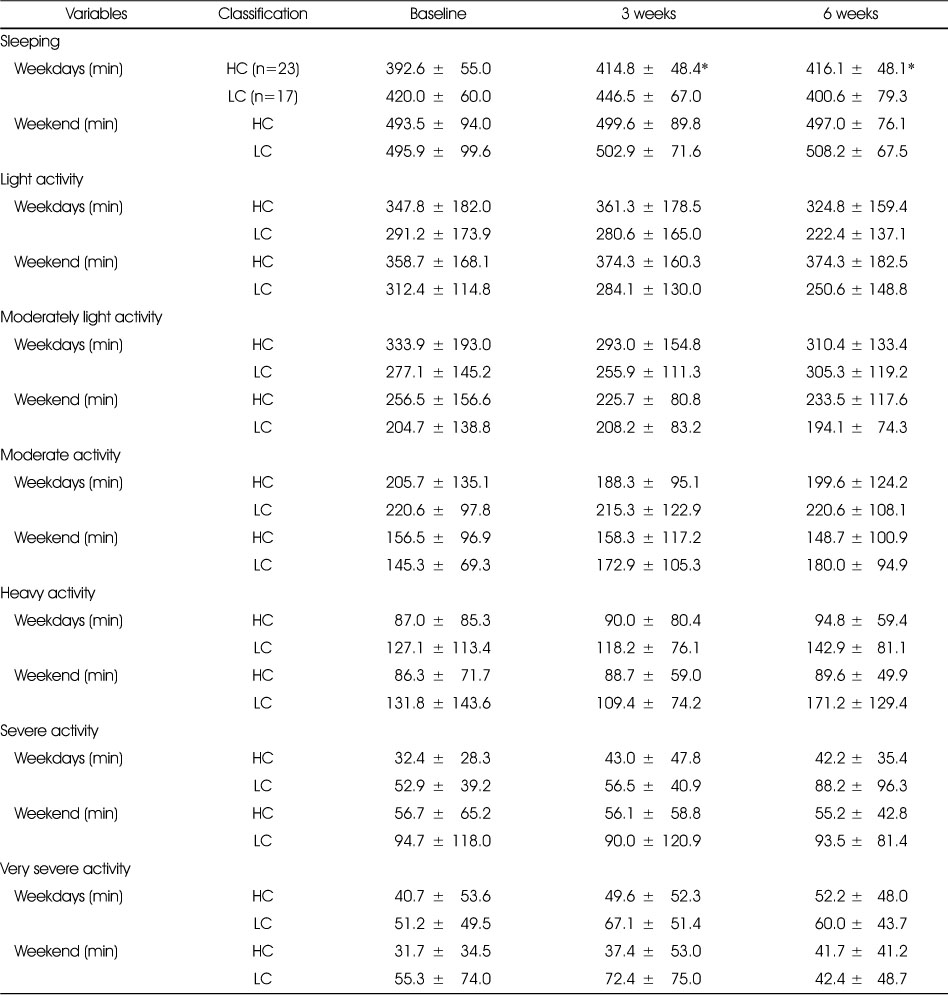
Changes in length of activity of each group comparing baseline, 3 weeks and 6 weeks
Values are mean ± SD
Significantly different compared to baseline measurement by paired t-test. *: p<0.05, **: p<0.01, ***: p<0.001
HC: High compliance, LC: Low compliance
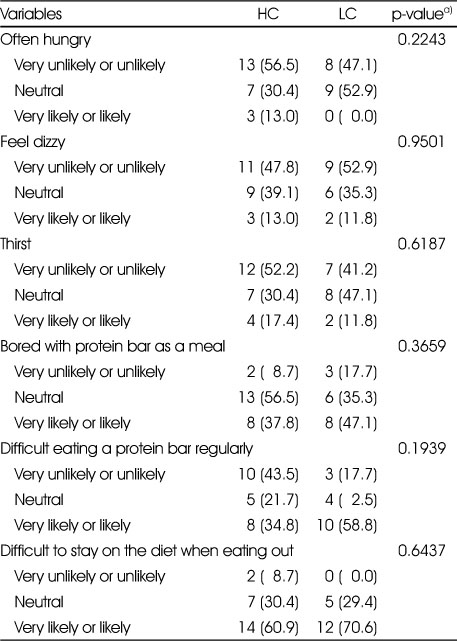
Proportion of the subjects who reported the physiological side effects and difficulties at 6 weeks of the diet program
Values are n (%)
a) p-value determeined by Fisher exact test
HC: High compliance, LC: Low compliance
* Ingredients: Isolated soybean protein, Brazil nut, Almond, Peanut, Lentils, Brown rice, Peanut butter, Fructo oligosaccharide, Honey, Grain syrup, Cranberry, Vanilla powder † Nutrients of protein bar were analyzed by SGS Korea (Seoul, Korea)
Values are Mean ± SD or N (%) 1) P-value determeined by t-test for continuous variable and Fisher's exact test for categorical variable. HC: High compliance LC: Low compliance
Values are mean ± SD Significantly different compared to baseline measurement by paired t-test. *: p<0.05, **: p<0.01, ***: p<0.001 HC: High compliance, LC: Low compliance
Values are mean ± SD Significantly different compared to baseline measurement by paired t-test. *: p<0.05, **: p<0.01, ***: p<0.001 HC: High compliance, LC: Low compliance
Values are mean ± SD Significantly different compared to baseline measurement by paired t-test. *: p<0.05, **: p<0.01, ***: p<0.001 HC: High compliance, LC: Low compliance
Values are mean ± SD Significantly different compared to baseline measurement by paired t-test. *: p<0.05, **: p<0.01, ***: p<0.001 HC: High compliance, LC: Low compliance
Values are n (%) a) p-value determeined by Fisher exact test HC: High compliance, LC: Low compliance

 KSCN
KSCN

 PubReader
 Cite
Cite


