
Articles
- Page Path
- HOME > Korean J Community Nutr > Volume 18(5); 2013 > Article
-
Original Article
- Interrelations Among Snack Preference, Purchasing Behaviors and Intake in Upper Grade Elementary School Students: Compared by the Gender and TV Watching Time
- Eun Sil Her
-
Korean Journal of Community Nutrition 2013;18(5):429-441.
DOI: https://doi.org/10.5720/kjcn.2013.18.5.429
Published online: October 31, 2013
Department of Food and Nutrition, Changshin University, Changwon, Korea.
- Corresponding author: Eun Sil Her, Department of food and Nutrition, Changshin University, Changwon 630-764, Korea. Tel: (055) 250-1203, Fax: (055) 250-1200, heres@csc.ac.kr
• Received: July 9, 2013 • Revised: August 7, 2013 • Accepted: August 28, 2013
Copyright © 2013 The Korean Society of Community Nutrition
This is an Open-Access article distributed under the terms of the Creative Commons Attribution Non-Commercial License (http://creativecommons.org/licenses/by-nc/3.0/) which permits unrestricted non-commercial use, distribution, and reproduction in any medium, provided the original work is properly cited.
- 1,844 Views
- 3 Download
- 8 Crossref
Abstract
- This study was conducted to examine the interrelations among snack preference, purchasing behavior and intake of fifth and sixth grade students in elementary schools in Gyeongnam province. Frequency of snack intake was the highest in those who reported 'once a day' (45.6%) snack habit. Longer-time television viewers also showed higher frequency of snack intake than shorter-time viewers. Thirty-three percent of students purchased snacks by themselves and the frequency of snack purchasing had a significant positive relationship with TV watching time (p < 0.01). The main reason, place and time of eating snacks were 'hunger' (79.2%), their home environment (50.9%) and 'after school hours' (89.7%). The favorite snack was 'ice cream' and, this snack habit was significantly different by gender of the child (p < 0.01) and TV watching time (p < 0.01). 'Milk and dairy products' scored highest (3.47) in snack intake frequency among longer-time TV viewers (> 2hr) compared to shorter-time TV viewers and this difference was statistically significant (p < 0.001). The snack preference score was correlated positively (r = 0.454) with the intake frequency for snack and its explanation power (R2) was 20.5%. With regard to snack purchase behaviors, the scores of 'checking the expiration date' and 'comparing the price with similar products' were high (in what group?). Female students (p < 0.001) and shorter-time TV viewers (< 2hr) (p < 0.01) had a more reasonable purchasing behavior. The total score of preference was significantly higher (p < 0.05) in shorter-timeTV viewers (< 2hr). In the correlation between snack purchasing behaviors and intake frequency, attractiveness (r = 0.208, p < 0.001) and preference (r = 0.330, p < 0.001) showed significant positive correlations. The result of regression analysis, preference only was selected (R2= 0.108).
- 1. Beak YM, Jung SJ, Beak HI, Cha YS. A study on eating out and snack intake of elementary school students living in Jeonbuk province. Korean J Hum Ecol 2007; 10(2): 77-87.
- 2. Cho AR, Khil JM. Relationship of TV watching, internet usage and dietary habits of elementary school children. Korean J Food Cult 2010; 25(2): 160-169.
- 3. Cho EA, Lee SK, Heo GJ. Snack consumption behaviors and nutrition knowledge among elementary school students in Siheung-si. Korean J Community Nutr 2010; 15(2): 169-179.
- 4. Her ES, Lee KH, Bae EY, Lyu ES. Interelations among fast food intake, food behavior, and personality in adolescents. Korean J Community Nutr 2007; 12(6): 714-723.
- 5. Her ES, Lee KH, Bae EY, Lyu ES. Interrelations among beverage intake, food behavior and personality in adolescents. Korean J Community Nutr 2008; 13(2): 189-198.
- 6. Im KH. The effects of children's TV watching to materialism : focused on TV programs and advertisements. Daegu University; 2010; 26-27 MS thesis.
- 7. Ji BY. Food purchasing & food label recognition of middle school student in Muan area. Mokpo National University; 2011; 77. Dissertation.
- 8. Kang MH, Yoon KS. Elementary school students' amounts of sugar, sodium, and fats exposure through intake of processed food. J Korean Soc Food Sci Nutr 2009; 38(1): 52-61.Article
- 9. Kang SA, Lee JW, Kim KE, Koo JO, Park DY. A study of the frequency of food purchase for snacking and its related ecological factors on elementary school children. Korean J Community Nutr 2004; 9(4): 453-463.
- 10. Kang SK. A survey on the awareness and usage of food nutrition description of middle school students in Ulsan. Ulsan University; 2010; 69-72 Dissertation.
- 11. Kim JH, Lee SM. Effects of short-term food additive nutrition education including hands-on activities on food label use and processed-food consumption behaviors: among 5th grade elementary school students. Korean J Community Nutr 2011; 16(5): 539-547.Article
- 12. Kim KH, Kang KJ. Children's attitudes toward food advertisement on children's television program. Korean J Soc Food Sci 1997; 13(5): 648-660.
- 13. Kim YK. Parent's behavior and perception of their kid's snacking behavior and dietary life education. Korean J Food Cookery Sci 2010; 26(5): 596-602.
- 14. Korea Health Statistics. 2009 Korea national health and nutrition examination survey. Ministry of Health&Welfare; 2010. p. 286.
- 15. Korea Health Statistics. 2011 Korea national health and nutrition examination survey. Ministry of Health&Welfare; 2012. p. 334-351.
- 16. Lee EJ, Hwang IK, Jin BH, Paik DI. Correlation between snack food intake and dental caries in elementary school children. Korean J Food Cookery Sci 2008; 24(2): 251-257.
- 17. Lee KH, Her ES, Woo TJ. Development of nutrition education textbook and teaching manual in elementary school. J Korean Diet Assoc 2005a; 11(2): 205-215.
- 18. Lee KW, Lee HS, Lee MJ. A study on the eating behaviors of self-purchasing snack among elementary school students. Korean J Food Cult 2005b; 20(5): 594-602.
- 19. Lee MH, Yoon HS. Study on toothbrushing habits, snack intake frequency and dental caries in primary school students in Changwon city. J Korean Diet Assoc 2011; 17(4): 364-377.
- 20. Min JY. A research of elementary school students television-watching habit and purchasing behavior. Seoul National University of Education; 2002; 8-12 Dissertation.
- 21. Oh SH. A study on recognition, utilization of food and nutrition labelling of elementary school students. Kongju National University; 2010; 40-41 Dissertation.
- 22. Park OH, Lee KA. The comparisons of elementary school children's food purchasing and consumer competency for a healthier diet by their attitude toward the meal management. Korean J Nutr 2008; 41(4): 353-364.
- 23. Park SS, Kim NY, Han MJ. Processed food preferences and food and nutrition labeling perceptions of middle school students. Korean J Food Cookery Sci 2008; 24(2): 164-173.
- 24. Park YS. Intake of snack by the elementary school children in Hansan-do area 1. Korean J Soc Food Cookery Sci 2003; 19(1): 96-106.
- 25. Temple JL, Giacomelli AM, Kent KM, Roemnich JN, Epstein LH. Television watching increases motivated responding for food and energy intake in children. Am J Clin Nutr 2007; 85(2): 355-361.PubMed
- 26. Yoo SJ. The purchase behavior of processed food and the utilization of food & nutrition labeling of some elementary school students in Yongin area. Dankook university; 2011; 78-79 Dissertation.
- 27. Yoon GA. Television watching, family social class, parental overweight, and parental physical activity levels in relation to children overweight. Korean J Community Nutr 2002; 7(2): 177-187.
REFERENCES
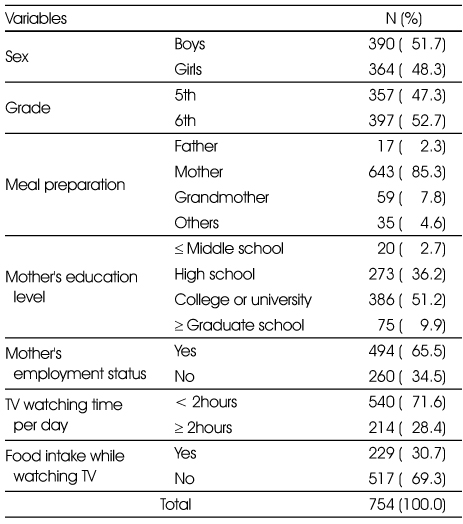
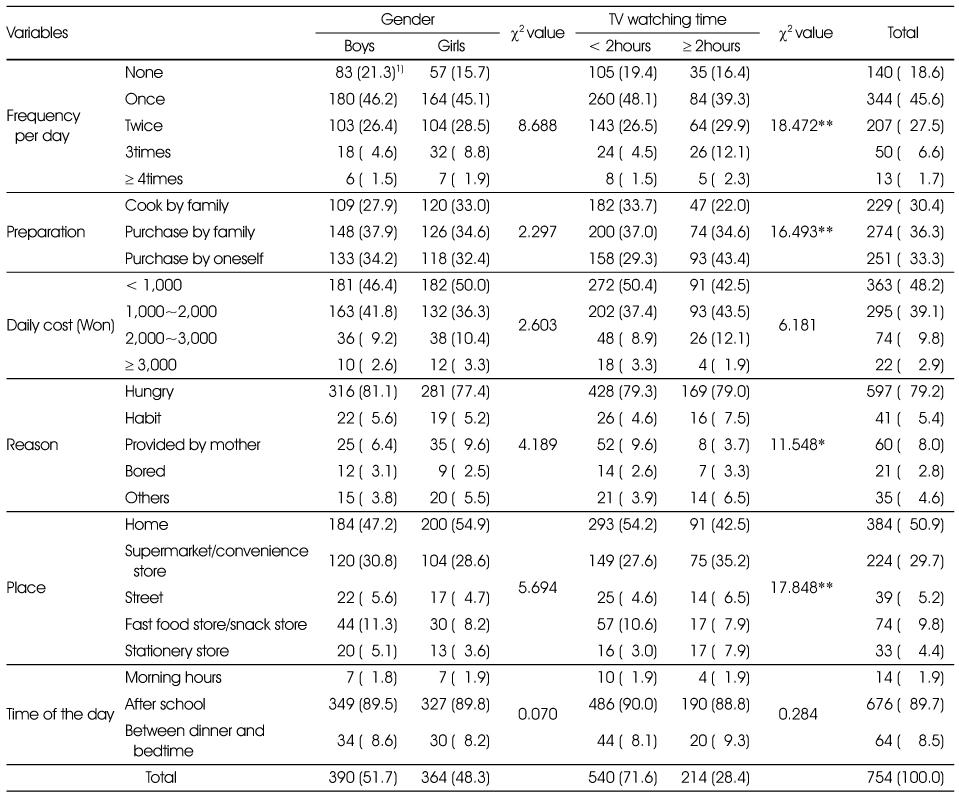
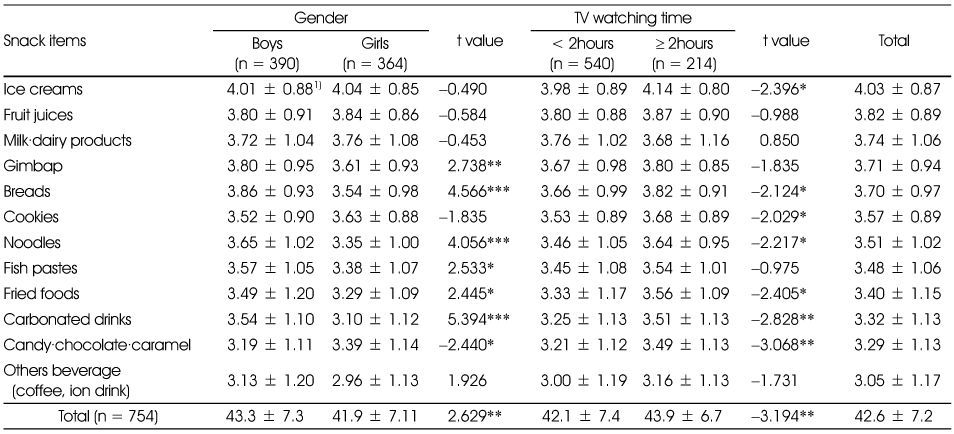
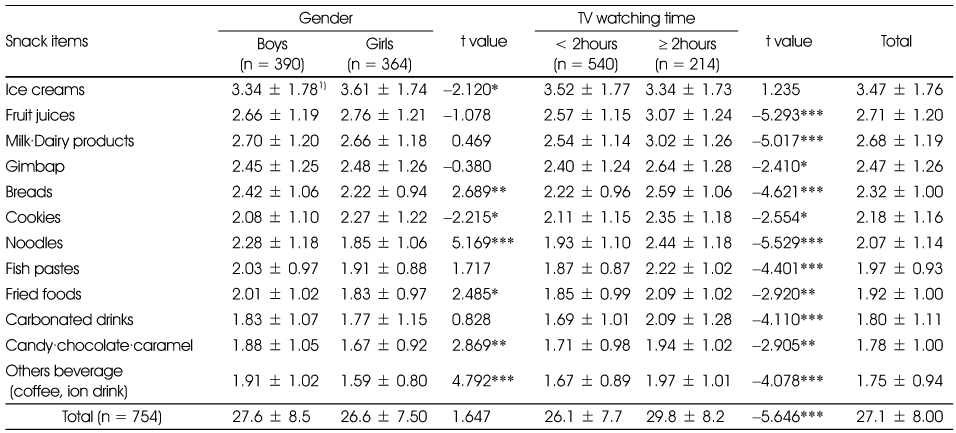
Table 5Pearson's correlation coefficient between preferences and intake frequency of snacks by gender and TV watching time
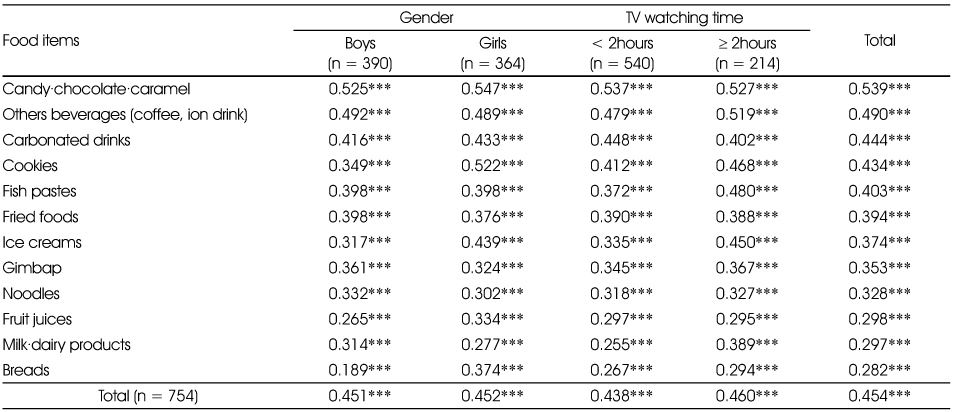
Table 6Regression analysis of the influence of preferences on intake frequency of snacks by gender and TV watching time
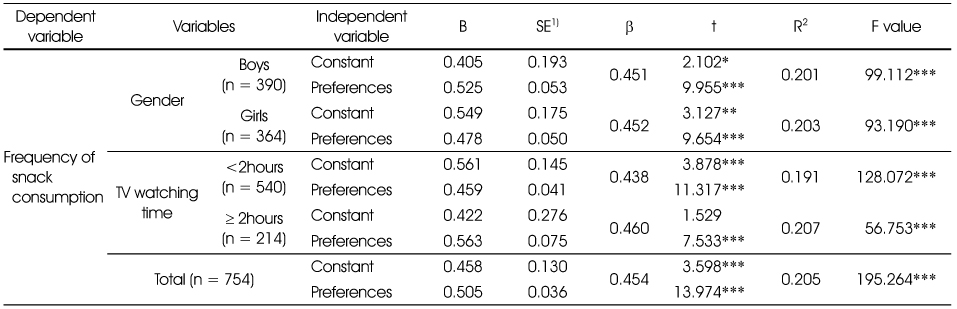
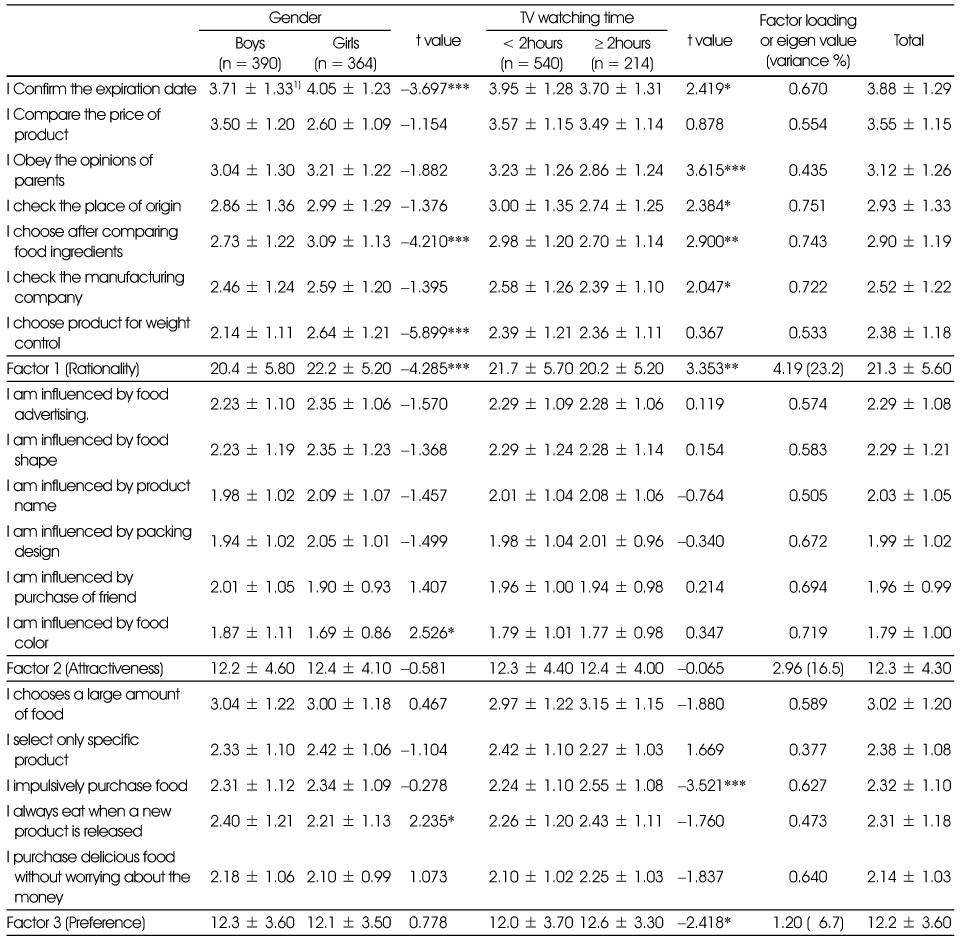
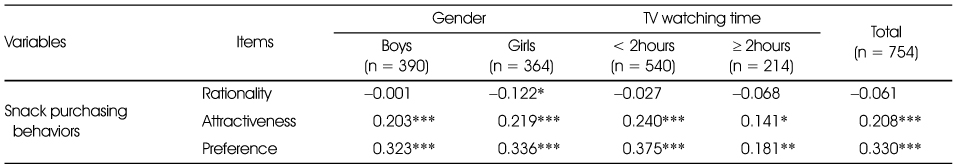
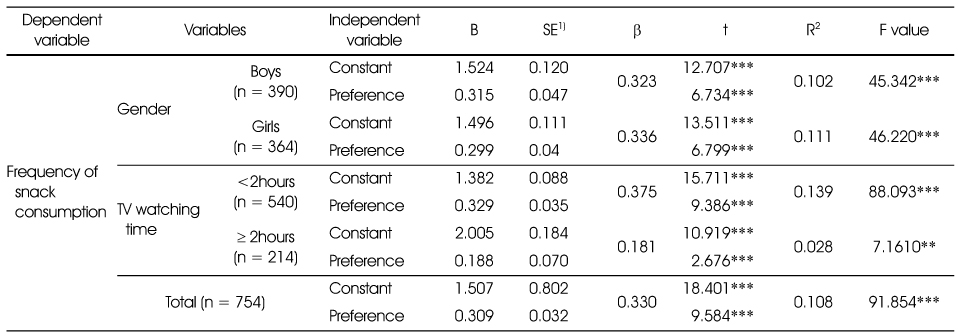
Figure & Data
REFERENCES
Citations
Citations to this article as recorded by 
- The relationship between smartphone usage and eating behavior for elementary school students in Gangneung, South Korea: cross-sectional study
Minji Kim, Meera Jang
Korean Journal of Community Nutrition.2024; 29(4): 278. CrossRef - Association between eating habits, sweet taste assessment, and high-sugar food consumption among elementary school students in Daegu: a descriptive study
Min-Jung Kim, Eun-Kyung Shin, Yeon-Kyung Lee
Korean Journal of Community Nutrition.2023; 28(2): 104. CrossRef - A Comparative Study of the Dietary Behavior of Adults Aged 20 and Over according to theMukbangViewing Time
Ha-Yan Nam, Bok-Mi Jung
Korean Journal of Community Nutrition.2021; 26(2): 93. CrossRef - A Study on the Development of the Goals and Contents System of Healthy Dietary Education Program for After-School Care in Lower Grade in Elementary School
Jung-Hyun Kim, Myoung Hee Lee, Okjin Park, Kyung Sook Choi
Korean Journal of Community Nutrition.2019; 24(1): 24. CrossRef - Eating patterns of children's favorite foods and its related factors among elementary, middle, and high school students in Korea
YuJin Lee, Seungmin Lee, KyoungAe Lee, Kyung-Hea Lee, Inkyung Baik
Nutrition Research and Practice.2017; 11(6): 517. CrossRef - Lifestyle, Dietary Behavior and Snack Preference of Upper-grade Elementary School Students in Cheongju according to the Usage Time of Smartphones
Hayeon Kim, Munkyong Pae
Korean Journal of Community Nutrition.2017; 22(1): 40. CrossRef - Association of Interpersonal Relationships with Preference and Intake Frequency of Snack with a Focus on Obesity Index and Snack Preparations in Upper Grade Elementary School Students
Eun Sil Her
The Korean Journal of Food And Nutrition.2015; 28(2): 178. CrossRef - Perceptions and Use of Premium Snacks and Associated Factors in School Aged Children and Their Mothers in Kyung-Ki Area
Hye-Young Yang, Hyo-Suk Lee, Jayong Chung
Korean Journal of Health Promotion.2014; 14(3): 121. CrossRef
 Cite
CiteInterrelations Among Snack Preference, Purchasing Behaviors and Intake in Upper Grade Elementary School Students: Compared by the Gender and TV Watching Time
Interrelations Among Snack Preference, Purchasing Behaviors and Intake in Upper Grade Elementary School Students: Compared by the Gender and TV Watching Time
The general characteristics of the subjects
Snack-related behaviors by gender and TV watching time
1) N (%)
*: p < 0.05, **: p < 0.01
Preferences of snacks by gender and TV watching time
1) Mean ± SD, The perfect of each items was 5 points.
*: p < 0.05, **: p < 0.01, ***: p < 0.001
The frequency of snack intake by gender and TV watching time
1) Mean ± SD, The perfect of each items was 6 points.
*: p < 0.05, **: p < 0.01, ***: p < 0.001
Pearson's correlation coefficient between preferences and intake frequency of snacks by gender and TV watching time
***: p < 0.001
Regression analysis of the influence of preferences on intake frequency of snacks by gender and TV watching time
1) Standard error
*: p < 0.05, **: p < 0.01, ***: p < 0.001
Snack purchasing behaviors by gender and TV watching time
1) Mean ± SD, The perfect of each items was 5 points.
Total variance explanatory 46.4%
KMO and Bartlett's test 0.847 (p = 0.000)
*: p < 0.05, **: p < 0.01, ***: p < 0.001
Pearson's correlation coefficient between snack purchasing behaviors and intake frequency of snacks by gender and TV watching time
*: p < 0.05, **: p < 0.01, ***: p < 0.001
Regression analysis of the influence of snack purchasing behaviors on intake frequency of snacks by gender and TV watching time
1) Standard error
**: p < 0.01, ***: p < 0.001
Table 1
The general characteristics of the subjects
Table 2
Snack-related behaviors by gender and TV watching time
1) N (%) *: p < 0.05, **: p < 0.01
Table 3
Preferences of snacks by gender and TV watching time
1) Mean ± SD, The perfect of each items was 5 points. *: p < 0.05, **: p < 0.01, ***: p < 0.001
Table 4
The frequency of snack intake by gender and TV watching time
1) Mean ± SD, The perfect of each items was 6 points. *: p < 0.05, **: p < 0.01, ***: p < 0.001
Table 5
Pearson's correlation coefficient between preferences and intake frequency of snacks by gender and TV watching time
***: p < 0.001
Table 6
Regression analysis of the influence of preferences on intake frequency of snacks by gender and TV watching time
1) Standard error *: p < 0.05, **: p < 0.01, ***: p < 0.001
Table 7
Snack purchasing behaviors by gender and TV watching time
1) Mean ± SD, The perfect of each items was 5 points. Total variance explanatory 46.4% KMO and Bartlett's test 0.847 (p = 0.000) *: p < 0.05, **: p < 0.01, ***: p < 0.001
Table 8
Pearson's correlation coefficient between snack purchasing behaviors and intake frequency of snacks by gender and TV watching time
*: p < 0.05, **: p < 0.01, ***: p < 0.001
Table 9
Regression analysis of the influence of snack purchasing behaviors on intake frequency of snacks by gender and TV watching time
1) Standard error **: p < 0.01, ***: p < 0.001


