Articles
- Page Path
- HOME > Korean J Community Nutr > Volume 16(1); 2011 > Article
-
Original Article
- A Study on Premenstrual Syndrome (PMS), Nutrient Intake, Psychological Index according to the Obesity Degree of College Women
- Se-Na Kang, Jung-Hwa Park, Hye-Jin Hwang
-
Korean Journal of Community Nutrition 2011;16(1):14-22.
DOI: https://doi.org/10.5720/kjcn.2011.16.1.14
Published online: February 28, 2011
1Dongeui Food Research Institute, Dongeui University, Busan, Korea.
2Department of Food and Nutrition, Yonsei University, Seoul, Korea.
3Department of Food and Nutrition, Dongeui University, Busan, Korea.
- Corresponding author: Hye Jin Hwang, Department of Food and Nutrition, Dongeui University, 995 Eomgwangno, Busan-jin Gu, Busan 614-714, Korea. Tel: (051) 890-1594, Fax: (051) 890-2646, hhj2001@deu.ac.kr
Copyright © 2011 The Korean Society of Community Nutrition
- 1,213 Views
- 5 Download
- 2 Crossref
Abstract
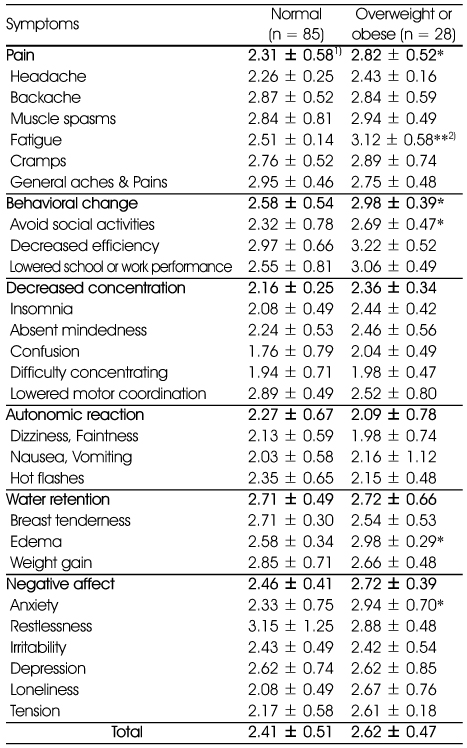
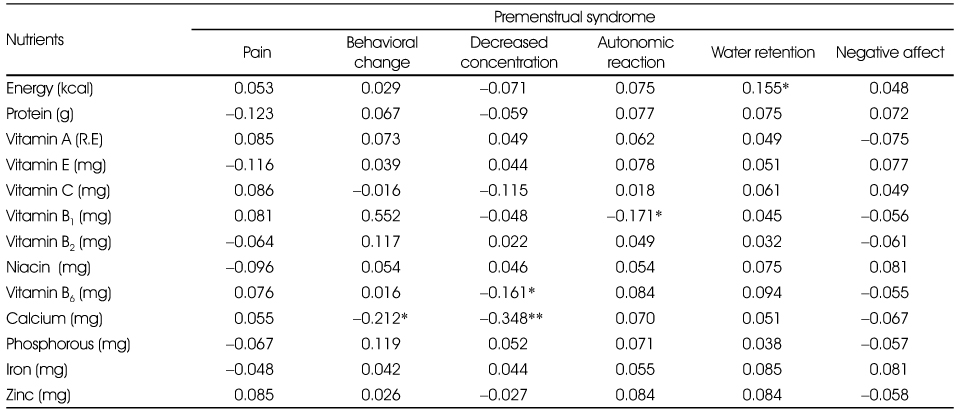
- This study was designed to compare the incidence and severity of premenstrual syndrome (PMS) between normal (N = 85) and overweight or obese (N = 28) college female students and investigated correlation between PMS, nutrient intake, hematological index and psychological index (depression, anxiety, stress). Each subject was asked a Menstrual Discomfort Questionnaire (MDQ) for PMS by 5 Likert scale. The PMS scores of women in the normal weight subjects ranked in order of severity were water retention (2.71), followed by behavioral change (2.58), negative affect (2.46), pain (2.31), autonomic reaction (2.27), decreased concentration (2.16). The symptoms of 'pain' and 'behavioral change' of overweight or obese subject were significantly higher than those of normal subject (p < 0.05). And total cholesterol concentration of overweight or obese subjects was significantly higher than in normal subject (p < 0.05). There was a significant positive correlation (p < 0.05) between the symptoms of 'negative effect' and BMI. And the triglyceride concentration was positively related with 'water retention (p < 0.01)'. The symptoms of 'decreased concentration' were negatively correlated with calcium (p < 0.01) and vitamin B6 intake (p < 0.05). The depression score were positively related with symptoms of 'behavioral change (p < 0.05)', 'negative affect' (p < 0.01), and the anxiety score was positively correlated with 'behavioral change (p < 0.05)' and 'decreased concentration (p < 0.05)'. The stress score was positively correlated with 'decreased concentration (p < 0.01)', 'behavioral change (p < 0.05)' and 'negative affect (p < 0.05)'. This suggests that PMS represents the clinical manifestation of a calcium, vitamin B6 deficiency and psychological disorder. Therefore we concluded that nutrient supplementation, depression and stress management may help to relieve PMS symptoms.
- 1. Bae HS. Dietary intake, serum lipids, iron index and antioxidant status by percent body fat of young females. Korean J Community Nutr. 2008; 13(3): 323-333.
- 2. Beck AT, Epstein N, Brown G, Steer RA. An inventory for measuring clinical anxiety: psychometric properties. J Consult Clin Psychol. 1988; 56(6): 893-897.ArticlePubMed
- 3. Bendich . The potential for dietary supplement to reduce premenstrual syndrme (PMS). J Am Coll Nutr. 2000; 19(1): 3-12.PubMed
- 4. Chuong CJ, Dawson EB, Smith ER. Vitamin E levels in premenstrual syndrome. Am J Obstet Gynecol. 1990; 163(5): 1591-1595.ArticlePubMed
- 5. Coelho R, Silva C, Maia A, Prata J. Bone mineral density and depression: a community study in women. J Psychosom Res. 1999; 46: 29-35.PubMed
- 6. Cohen S, Kamarck T, Mermelstein R. A global measure of perceived stress. J Health Soc Behav. 1983; 24(4): 385-396.ArticlePubMed
- 7. De souza MC, Walker AF, Robinson PA, Bolland K. A synergistic effect of a daily supplement for 1 month of 200 mg magnesium plus 50 mg vitamin B6 for the relief of anxiety-related premenstrual symptoms: a randomized, double-blind, cross-over study. J Womens Health Gend Based Med. 2000; 9(2): 131-139.ArticlePubMed
- 8. Facchinetti F, Borella P, Sances Fioroni L, Nappi RE, Genazzani AR. Oral magnesium successfully relieves premenstrual mood changes. Obstet Gynecol. 1991; 78(2): 177-181.PubMed
- 9. Greene R, Dalton K. The premenstrual syndrome. BMJ. 1953; 1(4818): 1007-1014.ArticlePubMedPMC
- 10. Halbrich U, Endicott J, Schacht S, Nee J. The diversity of premenstrual changes as reflected in the premenstrual assessment form. Acta Psychiatr Scand. 1982; 65(1): 46-65.ArticlePubMed
- 11. Herrera H, Rebato E, Arechabaleta G, Lagrange H, Salces I, Susanne C. Body mass index and energy intake in Venezuelan university students. Nutr Res. 2003; 23(3): 389-400.Article
- 12. Hwang HJ, Kim YM. A study of premenstrual syndrome (PMS) and the nutritional intake of college woman residing in Busan metropolitan city. Korean J Community Nutr. 2002; 7(6): 731-740.
- 13. Johnson SR. The epidemiology and social impact of premenstrual symptoms. Clin Obstet Gynecol. 1987; 30(2): 367-376.ArticlePubMed
- 14. Kim OH, Kim JH. Food intake and clinical blood indices of female college students by body mass index. Korean J Community Nutr. 2006; 11(3): 307-316.
- 15. Kim SH, Lee JH. A study on relation between premenstrual syndrome (PMS) and nutritional intake, blood composition of female college students. Korean J Community Nutr. 2005; 10(5): 603-614.
- 16. Kim HO, Lim SW, Woo HY, Kim KH. Premenstrual syndrome and dysmenorrhea in Korean adolescent girls. Korean J Obstet Gynecol. 2008; 51(11): 1322-1329.
- 17. Korean Nutrition Society. Dietary reference intake for Korean. 2010.
- 18. Lauersen NH. Recognition and treatment of premenstrual syndrome. Nurse Pract. 1985; 10(3): 11-12. 15. 18-20 passim.Article
- 19. London RS, Murphy L, Kitlowski KE, Reynolds MA. Efficacy of α-tocopherol in the treatment of premenstrual syndrome. J Reprod Med. 1987; 32(6): 400-402.PubMed
- 20. Michelson D, Stratakis C, Hill L, Reynolds J, Galliven E, Chrousos G, Gold P. Bone mineral density in women with depression. N Engl J Med. 1996; 335(16): 1176-1181.ArticlePubMed
- 21. Mortola J. Premenstrual syndrome-pathophysiologic considerations. N Engl J Med. 1998; 338(4): 256-257.ArticlePubMed
- 22. Moos RH. The development of a menstrual distress questionnaire. Psychosom Med. 1968; 30(6): 853-867.ArticlePubMed
- 23. O'Brien PM. Helping women with premenstrual syndrome. BMJ. 1993; 307(6917): 1471-1475.ArticlePubMedPMC
- 24. Park KH, Sung NJ, Bae JI, Lee DU. The effects of body mass index change and lifestyles on change of serum total cholesterol levels. Dongguk J Med. 2003; 10(2): 200-207.
- 25. Park KS, Lee KA. A case study on the effect of Ca intake on depression and anxiety. Korean J Nutr. 2002; 35(1): 45-52.
- 26. Pitts CA. Premenstrual syndrome: Current assessment and management. Nursing Forum. 1987; 23(4): 127-133.ArticlePubMed
- 27. Romieu L, Willett MJ, Stampfer MJ, Colditz GA, Sampson L, Rosner B, Hennekens CH, Speizer FE. Energy intake and other determinants of relative weight. Am J Clin Nutr. 1988; 47(3): 406-412.ArticlePubMed
- 28. Steinberg S, Annable L, Young SN, Liyanage N. Placebo-controlled clinical trial of L-tryptophan in premenstrual dysphoria. Biol Psychiatry. 1999; 45(3): 313-320.PubMed
- 29. Singh B, Berman B, Simpson R, Annechild A. Incidence of premenstrual syndrome and remedy usage: a national probability sample study. Altern Ther Health Med. 1998; 4(3): 75-79.
- 30. Taylor RJ, Fordyce ID, Aleander DA. Relationship between personality and premenstrual symptoms. Br J Gen Pract. 1991; 41(343): 55-57.PubMedPMC
- 31. Thys-Jacobs S, Alvir MJ. Calcium-regulating hormones across the menstrual cycle: evidence of a secondary hyperparathyroidism in women with PMS. J Clin Endocrinol Metab. 1995; 80(7): 2227-2232.ArticlePubMed
- 32. Thys-Jacobs S. Micronutrients and the premenstrual syndrome. J Am Coll Nutr. 2000; 19(2): 220-227.PubMed
- 33. Thys-Jacobs S, Starkey P, Bernstein D. Calcium carbonate and the premenstrual syndrome: effects on premenstrual and menstrual symptoms. Am J Obstet Gynecol. 1998; 179(2): 444-452.ArticlePubMed
- 34. Wyatt KM, Dimmock PW, Jones PW, O'Brian PMS. Efficacy of vitamin B-6 in the treatment of premenstrual syndrome: systematic review. BMJ. 1999; 318(7195): 1375-1381.ArticlePubMedPMC
- 35. Yook SP, Kim JS. A clinical study on the Korean version of beck anxiety inventory: comparative study of patient and non-patient. Korean J Clin Psychol. 1997; 16(1): 185-197.
- 36. Yu HH, Nam JE, Kim IS. A study of nutritional intake and health condition of female college students as related to their frequency of eating breakfast. Korean J Community Nutr. 2003; 8(6): 964-976.
REFERENCES
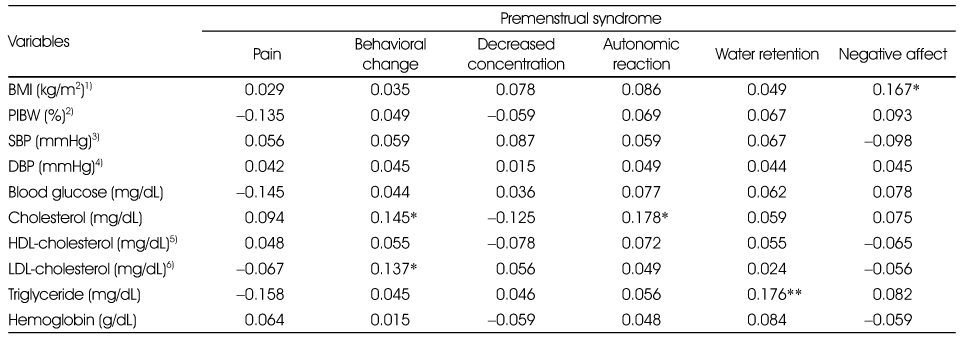
Figure & Data
REFERENCES
Citations

- Physical, Psychological, and Behavioral Symptoms of Premenstrual Syndrome in Relation to Body Size and Shape
Janina Tutkuviene, Simona Gervickaite, Martyna Sveikataite, Gabija Stulgyte, Julija Rugelyte, Renata Simkunaite‐Rizgeliene, Diana Ramasauskaite
American Journal of Human Biology.2025;[Epub] CrossRef - Premenstrual symptom clusters and women’s coping style in Korea: happy healthy 20s application study
Chiyoung Cha, Su Jin Nam
Journal of Psychosomatic Obstetrics & Gynecology.2016; 37(3): 91. CrossRef
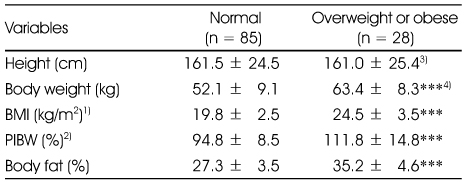
Physical characteristics of subjects
1) BMI (kg/m2): Body Mass Index
2) PIBW: Percent Ideal Body Weight, ideal body weight = {height (cm) - 100} × 0.9
3) Mean ± SD
4) Significance between normal subjects and overweight or obese subjects by t-test
***: p < 0.001
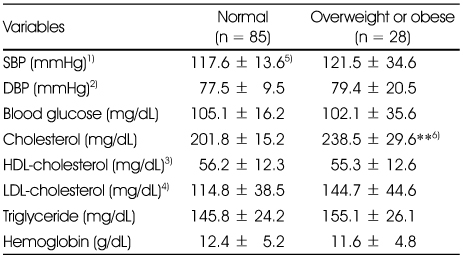
Hematological index of the subjects
1) Systolic Blood Pressure
2) Diastolic Blood Pressure
3) High density lipoprotein-cholesterol
4) Low density lipoprotein-cholesterol
5) Mean ± SD
6) Significance between normal subjects and overweight or obese subjects by t-test
**: p < 0.01
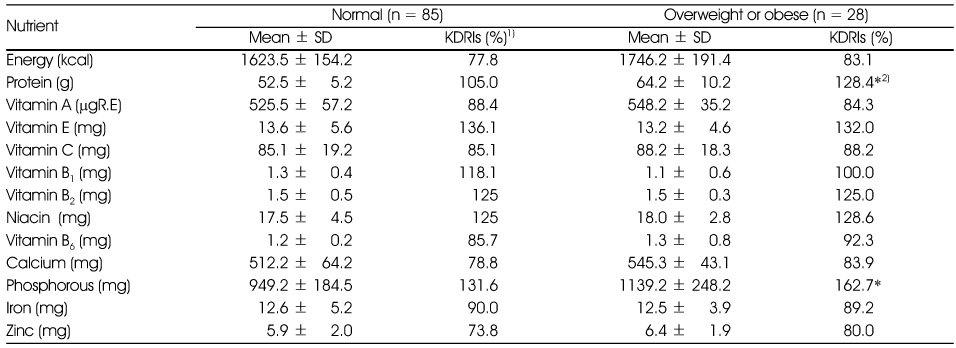
Average daily nutrient intakes and % KDRIs of the subjects
1) KDRIs: Dietary reference intake of Koreans (2010), 2) Significance between normal subjects and overweight or obese subjects by t-test
*: p < 0.05
Premenstrual syndrome of the subjects
1) Mean ± SD, 1: Not exist, 2: Exist a little, 3: Moderate, 4: Considerable 5: Severe
2) Significance between normal subjects and overweight or obese subjects by t-test
*: p < 0.05, **: p < 0.01
Psyhological score (depression, anxiety, stress) of the subjects
1) 21 questions, 0 - 3 Likert scale
2) 21 questions, 0 - 3 Likert scale
3) 10 qustionss, 0 - 4 Likert scale
4) Mean ± SD
5) Significance between normal and overweight subjects by t-test
*: p < 0.05
Correlation coefficient between premenstrual syndrome and hematological index of the subjects
1) Body Mass Index
2) Percent Ideal Body Weight, ideal body weight = {height (cm) - 100} × 0.9
3) Systolic blood pressure
4) Diastolic blood pressure
5) High density lipoprotein-cholesterol
6) Low density lipoprotein-cholesterol
*: p < 0.05, **: p < 0.01
Correlation coefficient between premenstrual syndrome and nutrient intakes of the subjects
*: p < 0.05, **: p < 0.01
Correlation coefficient between premenstrual syndrome and psychological score (depression, anxiety, stress) of the subjects
*: p < 0.05, **: p < 0.01
1) BMI (kg/m2): Body Mass Index 2) PIBW: Percent Ideal Body Weight, ideal body weight = {height (cm) - 100} × 0.9 3) Mean ± SD 4) Significance between normal subjects and overweight or obese subjects by t-test ***: p < 0.001
1) Systolic Blood Pressure 2) Diastolic Blood Pressure 3) High density lipoprotein-cholesterol 4) Low density lipoprotein-cholesterol 5) Mean ± SD 6) Significance between normal subjects and overweight or obese subjects by t-test **: p < 0.01
1) KDRIs: Dietary reference intake of Koreans (2010), 2) Significance between normal subjects and overweight or obese subjects by t-test *: p < 0.05
1) Mean ± SD, 1: Not exist, 2: Exist a little, 3: Moderate, 4: Considerable 5: Severe 2) Significance between normal subjects and overweight or obese subjects by t-test *: p < 0.05, **: p < 0.01
1) 21 questions, 0 - 3 Likert scale 2) 21 questions, 0 - 3 Likert scale 3) 10 qustionss, 0 - 4 Likert scale 4) Mean ± SD 5) Significance between normal and overweight subjects by t-test *: p < 0.05
1) Body Mass Index 2) Percent Ideal Body Weight, ideal body weight = {height (cm) - 100} × 0.9 3) Systolic blood pressure 4) Diastolic blood pressure 5) High density lipoprotein-cholesterol 6) Low density lipoprotein-cholesterol *: p < 0.05, **: p < 0.01
*: p < 0.05, **: p < 0.01
*: p < 0.05, **: p < 0.01

 KSCN
KSCN


 Cite
Cite


