
Articles
- Page Path
- HOME > Korean J Community Nutr > Volume 17(4); 2012 > Article
-
Original Article
- Analysis of Body Composition, Dietary Behaviors and Life style of 30~50 year old Women Living in Seoul
- Jae Ok Koo, Seoyun Park
-
Korean Journal of Community Nutrition 2012;17(4):440-449.
DOI: https://doi.org/10.5720/kjcn.2012.17.4.440
Published online: August 31, 2012
Department of Home Economics Korea National Open University, Seoul, Korea.
1Department of Food & Nutrition, Catholic University, Bucheon, Korea.
- Corresponding author: Jae Ok Koo, Department of Home Economic, Korea National Open University, Dongsungdong 169, Seoul 110-791, Korea. Tel: (02) 3668-4643, Fax: (02) 3668-4188, cokoo@knou.ac.kr
• Received: June 27, 2012 • Revised: August 7, 2012 • Accepted: August 27, 2012
Copyright © 2012 The Korean Society of Community Nutrition
- 2,038 Views
- 1 Download
- 6 Crossref
Abstract
- This study was carried out to investigate the distribution of body composition, and to analyze its relationship to dietary behaviors and life style. The study subjects were divided into 3 age groups; 30' years (n = 78) 40' years (n = 71) and 50' years (n = 44). The data was collected by physical measurement (Inbody 230) and questionnaires. The rate of disease and general characteristics were higher in the 50 year old group than in the other groups. Average amount of body water, protein, mineral and body fat were 29.0 kg (50.4%), 7.7 kg (13.4%), 2.8 kg (4.8%), 18.7 kg (31.5%), respectively. The rate of menopause was significantly different with increasing age. Menopause was 1.3%, 9.1%, 79.6% by age respectively. Body fat percent was significantly increased and body water decreased with age (p < 0.01). The fat composition was higher and the mineral content was lower in 50' year old group. Dietary behavior scores of 30' year old group was significant lower than in the other two groups (p < 0.001). The means of salty eating, skipping meals, fruit intake and food habits total point were significantly higher in the 50 year old group than in the other groups. There were significant positive correlations between age, BMI, waist hip ratio respectively (p < 0.01). There were significant negative correlations between age and body water, body mineral, skeletal muscle (p < 0.01, p < 0.05, p < 0.01). The results of this study suggested that nutritional management and education for adult women differ by age group.
-
This research was supported by grants from Korea National Open University 2011 the last half year
NOTES
- 1. Aloia JF, Vaswani A, Flaster E, Ma R. Relationship of body water compartments to age, race, and fat-free mass. J Lab Clin Med. 1998; 132(6): 483-490.ArticlePubMed
- 2. Biospace. User's manual (Inbody 230). 2008; Seoul: Biospace Co., Ltd.
- 3. Chang HS. A study on weight control behavior, eating habits and health-related life habits according to obesity degree by body fat percentage among middle-aged women in Gunsan city. Korean J Community Nutr. 2010; 15(2): 227-239.
- 4. Choi M, Kim MH. A study on bone mineral density, dietary habits and nutritional status of adult women in the three age groups. Korean J Food Cult. 2007; 22(6): 833-840.
- 5. Trémollieres FA, Pouilles JM, Ribot CA. Relative influence of age and menopause on total age and regional body composition changes in postmenopausal women. Am J Obstet Gynecol. 1996; 175(6): 1594-1600.PubMed
- 6. Gallagher JC, Riggs BL, Jerpbak CM, Arnaud CD. The effect of age on serum immunoreactive parathyroid hormone in normal and osteoporotic women. J Lab Clin Med. 1980; 95(3): 373-385.PubMed
- 7. Haroun D, Taylor SJC, Viner RM, Hayward RS, Darch TS, Eaton S, Cole TJ, Wells JCK. Validation of bioelectrical impedance analysis in adolescents across different ethnic groups. Obesity. 2010; 18: 1252-1259.ArticlePubMedLink
- 8. Hwang IC, Jo YN, Kim KK. The usefulness of waist to hip ratio estimated by bioelectric impedance analysis in diagnosing metabolic syndrome based on NCEP-ATP III guideline. Korean J Obes. 2009; 18(3): 79-86.
- 9. Jung IK. A study on the nutrient intakes and factors related to dietary behavior of women by age groups in Incheon. Korean J Community Nutr. 2005; 10(1): 46-58.
- 10. Koo JO, Park S. Analysis of BMI, body composition, weight control, dietary behaviors of adult women. Korean J Community Nutr. 2011; 16(4): 454-465.Article
- 11. Kim JH, Kim SH. A study on energy metabolism of Korean healthy women with age. Korean J Nutr. 1989; 22(6): 531-538.
- 12. Korean National Statistical Office. The statistics of life table 2010. 2010; cited 2012 June 20. Available from www.kosis.kr.
- 13. Korea Centers for Disease Control and Prevention & Korea Health Industry Development Institute. Korea national health & nutrition examination survey. 2008; cited 2011 March 1. Available from http://knhanes.cdc.go.kr/.
- 14. Korea Centers for Disease Control and Prevention & Korea Health Industry Development Institute. Korea national health & nutrition examination survey. 2010; cited 2012 March 29. Available from http://knhanes.cdc.go.kr/.
- 15. Ley CJ, Lees B, Stevenson JC. Sex-and menopause-associated changes in body-fat distribution. Am J Clin Nutr. 1992; 55(5): 950-954.ArticlePubMed
- 16. Lee HJ, Choi MR, Koo JO. A study of body image, weight control and dietary habits with different BMI in female high school students. Korean J Community Nutr. 2005; 10(6): 805-813.
- 17. Lee HS, Kwun IS, Kwon CS. Nutritional risks analysis based on the food intake frequency and health-related behaviors of the older residents (50 years and over) in Andong area (1). J Korean Soc Food Sci Nutr. 2008; 37(8): 998-1008.Article
- 18. Meeuwsen S, Horgan GW, Elia M. The relationship between BMI and percent body fat, measured by bioelectrical impedance, in a large adult sample is curvilinear and influenced by age and sex. Clin Nutr. 2010; 29(5): 560-566.ArticlePubMed
- 19. Moon HK, Kim EG. Comparing validity of using body mass index, waist to hip ratio, and waist circumference to cardiovascular risk factors of middle aged Koreans. J Korean Diet Assoc. 2005; 11(3): 365-374.
- 20. Ock SM, Ju SY, Choi WS, Park HM, Jung KI, Song CJ. Association of sleep hours with obesity in adult women. Korean J Obes. 2008; 17(3): 110-116.
- 21. Oh HJ, Cho DH, Chung HY, Han KO, Yoon HK, Han IK. Effects of obesity on BMD in pre & peri-menopausal Korean women. Korean J Obes. 2000; 9(2): 122-127.
- 22. Park JC, Kweon HJ, Oh YK, Do HJ, Oh SW, Lym YL, Choi JK, Joh HK, Cho DY. Association of the metabolic syndrome and bone mineral density in postmenopausal women. Korean J Fam Med. 2010; 31(1): 9-15.Article
- 23. Park SY. Nutritional status of anemic adolescent females, screening tools and the effect of nutrition education on improvement of iron status. 2002; Graduate school of Catholic University; MS thesis.
- 24. Sakurai M, Takamura T, Miura K, Kaneko S, Nakagawa H. Middle-aged Japanese women are resistant to obesity-related metabolic abnormalities. Metabolism. 2009; 58(4): 456-459.ArticlePubMed
- 25. Sharpe JK, Byrneb NM, Stedmana TJ, Hillsb AP. Bioelectric impedance is a better indicator of obesity in men with schizophrenia than body mass index. Psychiatry Res. 2008; 159(1-2): 121-126.ArticlePubMed
- 26. Woo J, Kwok T, Lau E, Li M, Yu LM. Body composition in Chinese subjects: relationship with age and disease. Arch Gerontol Geriatr. 1997; 26(1): 23-32.Article
- 27. Woo SI, Cho SS. The influence of diet, body fat, menstrual function, and activity upon the bone density of female gymnasts. Korean J Nutr. 1999; 32(1): 50-63.
REFERENCES
Fig. 1
Body composition of the subjects by age.
Means with different superscripts (a > b) within a row are significantly different at p = 0.05 by Duncan's multiple range test.
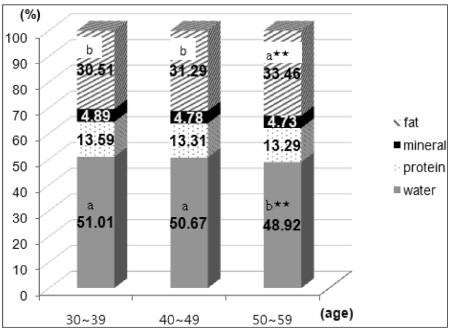
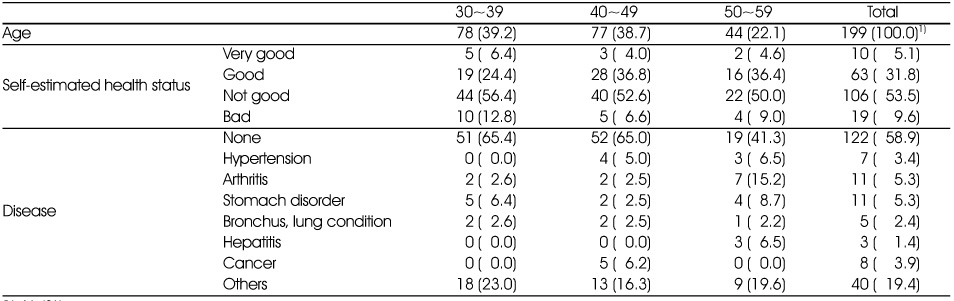
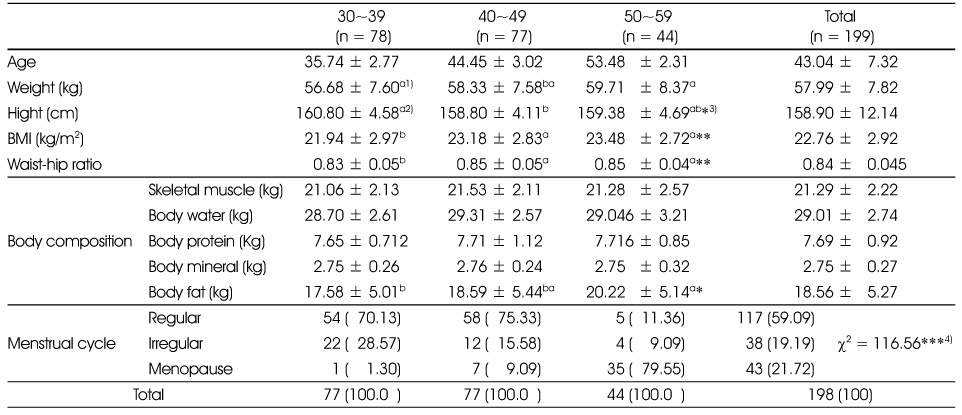
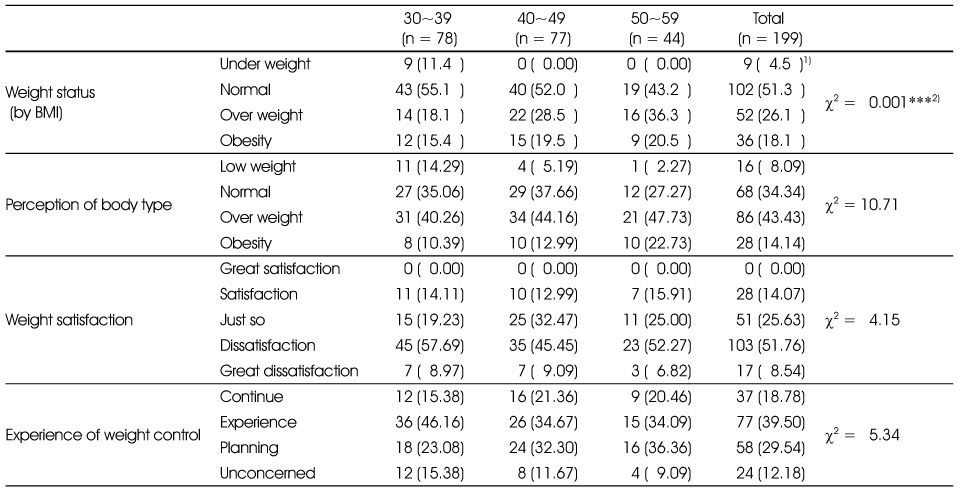
Table 4Food habits of the subjects by age
1) Mean ± SD
2) Means with different superscripts (a > b) within a row are significantly different from each at p = 0.05 by Duncan's multiple range test
*: p < 0.05, **: p < 0.01 by GLM test
cf. 4) yes = 3 point, sometimes = 2 point, no = 1point, 5) often = 3point, sometimes = 2point, rarely = 1point, The highest score, the better it is for the health, perfect score = 30
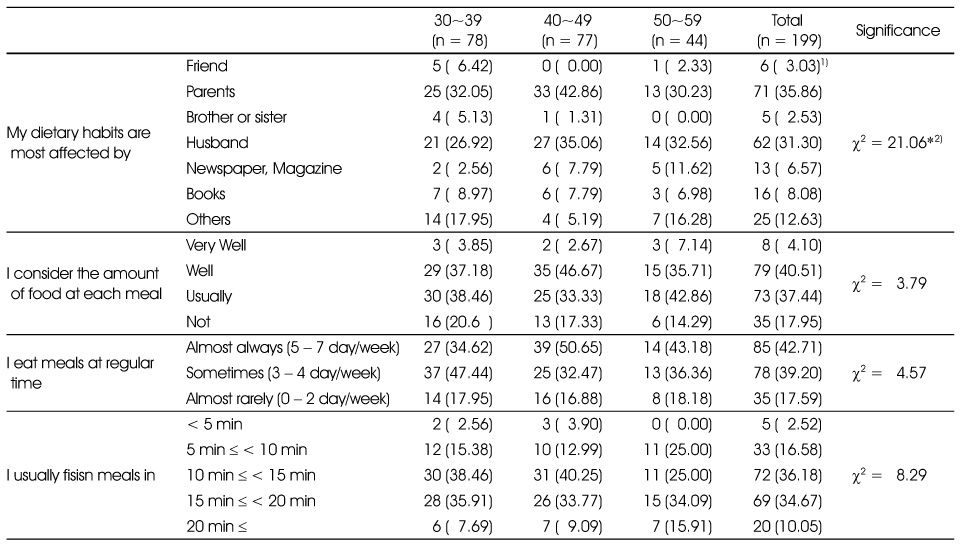
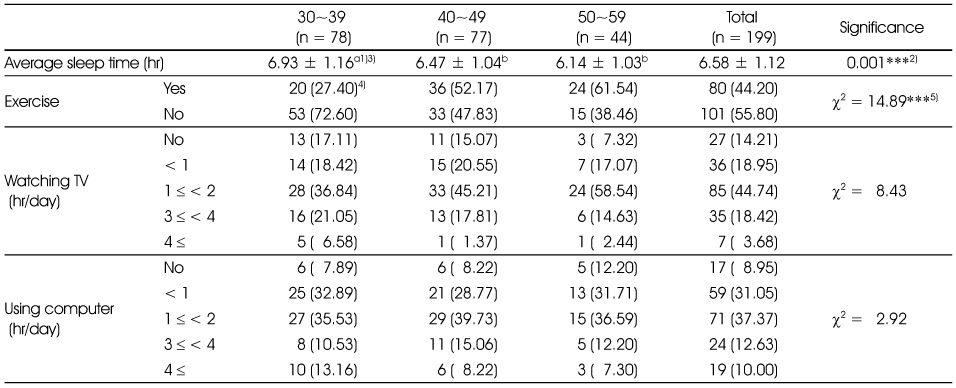
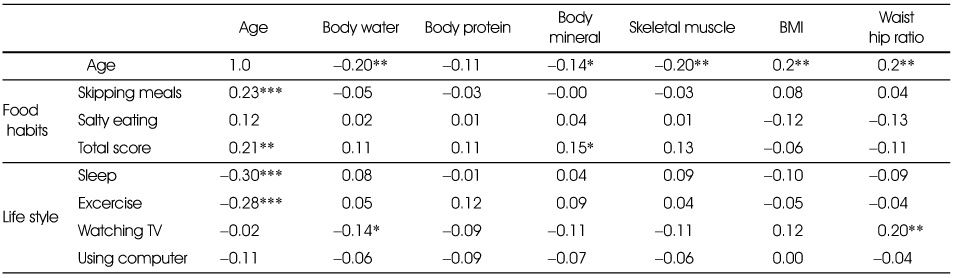
Figure & Data
REFERENCES
Citations
Citations to this article as recorded by 
- Association between Clustering of Lifestyle and Chronic Disease Using Healthcare Big Data
Eul Hee Roh, Sang Chan Park
Journal of Health Informatics and Statistics.2020; 45(2): 113. CrossRef - The differences of dietary behaviors, dietary life consumer education related current situations · competencies and dietary lifestyles between baby-boom and echo generations
Jong Ok Park
Journal of Nutrition and Health.2018; 51(2): 153. CrossRef - A Study on the Body Composition, Physical Activity Level, Basal Metabolic Rate, and Daily Energy Expenditure of Elderly in Busan
Hwa-Jae Lim
Korean Journal of Community Nutrition.2016; 21(2): 178. CrossRef - The Impacts of Dietary Habits on Self-perceived Health-related Physical Fitness in Middle-aged Women -Focused on Changwon Province-
Hye-Jin Lee, Kyung-Hea Lee
Journal of the Korean Society of Food Science and Nutrition.2014; 43(6): 916. CrossRef - Evaluation of Diet Quality according to Self-Rated Health Status of Korean Middle-Aged Women -Based on 2008~2009 Korean National Health and Nutrition Examination Survey-
Hye-Jin Lee, Kyung-Hea Lee
Journal of the Korean Society of Food Science and Nutrition.2013; 42(9): 1395. CrossRef - A Study on Dietary Behaviors, Health-Related Lifestyle of Adult Visitors at Public Health Centers in Gyeonggi Urban Area
Jong-Sook Kwon, Kyungmin Kim, Hyun-Chang Seo, Yoonna Lee, Seunggeon Lim, Young-Sug Choi
Korean Journal of Community Nutrition.2013; 18(6): 611. CrossRef
 Cite
CiteAnalysis of Body Composition, Dietary Behaviors and Life style of 30~50 year old Women Living in Seoul

Fig. 1
Body composition of the subjects by age.
Means with different superscripts (a > b) within a row are significantly different at p = 0.05 by Duncan's multiple range test.
Fig. 1
Analysis of Body Composition, Dietary Behaviors and Life style of 30~50 year old Women Living in Seoul
General characteristics of the subjects
1) N (%)
Anthropometric characteristics and body composition of the subjects by age
1) Mean ± SD
2) Significance as determined by GLM test
3) Means with different superscripts (a > b) within a row are significantly different from each at p = 0.05 by Duncan's multiple range test
4) ***: p < 0.001 by χ2-test
Weight control in experience of each group by age
1) N (%)
2) Significance as determined by χ2-test
***: p < 0.001
Food habits of the subjects by age
1) Mean ± SD
2) Means with different superscripts (a > b) within a row are significantly different from each at p = 0.05 by Duncan's multiple range test
*: p < 0.05, **: p < 0.01 by GLM test
cf. 4) yes = 3 point, sometimes = 2 point, no = 1point, 5) often = 3point, sometimes = 2point, rarely = 1point, The highest score, the better it is for the health, perfect score = 30
Dietary behaviors of the subjects by age
1) N (%)
2) Significance as determined p < 0.05 by χ2-test
Sleep, exercise, watching TV and using computer of the subjects by age
1) Mean ± SD
2) Significance as determined by GLM test
3) Means with different superscripts (a > b) within a row are significantly different at p = 0.05 by Duncan's multiple range test
4) N (%)
5) Significance as determined by χ2-test
***: p < 0.001
Correlation coefficients between body composition and TV watching, using computer, food habits
1) Significance as determined by Pearson's correlation coefficient (r)
*: p < 0.05, **: p < 0.01, ***: p < 0.001
Table 1
General characteristics of the subjects
1) N (%)
Table 2
Anthropometric characteristics and body composition of the subjects by age
1) Mean ± SD 2) Significance as determined by GLM test 3) Means with different superscripts (a > b) within a row are significantly different from each at p = 0.05 by Duncan's multiple range test 4) ***: p < 0.001 by χ2-test
Table 3
Weight control in experience of each group by age
1) N (%) 2) Significance as determined by χ2-test ***: p < 0.001
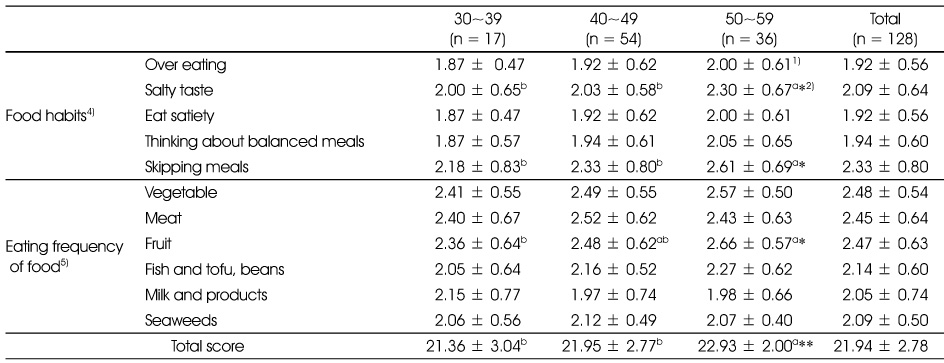
Table 4
Food habits of the subjects by age
1) Mean ± SD 2) Means with different superscripts (a > b) within a row are significantly different from each at p = 0.05 by Duncan's multiple range test *: p < 0.05, **: p < 0.01 by GLM test cf. 4) yes = 3 point, sometimes = 2 point, no = 1point, 5) often = 3point, sometimes = 2point, rarely = 1point, The highest score, the better it is for the health, perfect score = 30
Table 5
Dietary behaviors of the subjects by age
1) N (%) 2) Significance as determined p < 0.05 by χ2-test
Table 6
Sleep, exercise, watching TV and using computer of the subjects by age
1) Mean ± SD 2) Significance as determined by GLM test 3) Means with different superscripts (a > b) within a row are significantly different at p = 0.05 by Duncan's multiple range test 4) N (%) 5) Significance as determined by χ2-test ***: p < 0.001
Table 7
Correlation coefficients between body composition and TV watching, using computer, food habits
1) Significance as determined by Pearson's correlation coefficient (r) *: p < 0.05, **: p < 0.01, ***: p < 0.001


