
Articles
- Page Path
- HOME > Korean J Community Nutr > Volume 20(5); 2015 > Article
-
Research Article
- The Relations between Diabetic Dietary Compliance, Dietary Intake, and Physical Activity and the Prevalence of Metabolic Syndrome (MS) in Type 2 Diabetic Patients
- Dong Eun Kim, Seung Hee Hong, Ji-Myung Kim
-
Korean Journal of Community Nutrition 2015;20(5):351-361.
DOI: https://doi.org/10.5720/kjcn.2015.20.5.351
Published online: October 31, 2015
1Department of Clinical Nutrition, The Graduate School of Public Health, Shinhan University, Gyeonggi, Korea.
2Food and Nutrition Major, Division of Food Science and Culinary Arts, Shinhan University, Gyeonggi, Korea.
- Corresponding author: Ji-Myung Kim. Food and Nutrition Major, Division of Food Science and Culinary Arts, Shinhan University, 95, Hoam-ro, Uijeongbu-si, Gyeonggi 11644, Korea. Tel: (031) 870-3515, Fax: (031) 870-3519, kjm@shinhan.ac.kr
• Received: September 24, 2015 • Revised: October 15, 2015 • Accepted: October 22, 2015
Copyright © 2015 The Korean Society of Community Nutrition
This is an Open-Access article distributed under the terms of the Creative Commons Attribution Non-Commercial License (http://creativecommons.org/licenses/by-nc/3.0/) which permits unrestricted non-commercial use, distribution, and reproduction in any medium, provided the original work is properly cited.
- 1,897 Views
- 8 Download
- 4 Crossref
Abstract
-
Objectives
- The purpose of this study was to investigate the relations between diabetic dietary compliance and dietary intake, physical activity and prevalence of metabolic syndrome (MS) in type 2 diabetic patients.
-
Methods
- Seventy five subjects diagnosed with type 2 diabetes visiting the D hospital in Dongducheon from May 2014 to Dec 2014 were included in this study. The subjects were divided into two groups according to their diabetic dietary compliance score (median 39); low diabetic dietary compliance (LDDC) group (n=44) and high diabetic dietary compliance (HDDC) group (n=31). Survey data collection was carried out by direct interview method. The nutrient intake, food intake and KDDS (Korean's dietary diversity score), DVS (dietary variety score) and GMVDF (grain, meat, vegetable, dairy and fruit) were analyzed using data from the 24-recall method. Metabolic parameters were obtained from the hospital records. Data was analyzed using Chi-square test and general linear model adjusted for sex.
-
Results
- The prevalence of MS was 59.7% in the participating diabetic patients. The prevalence of MS of the HDDC (39.3%) was significantly lower than that of the LDDC (72.7%). The distribution of physical activity showed a significant difference between the groups (p=0.006). The intakes of seeds and nuts of the HDDC were significantly lower than those of the LDDC. Fat and vegetable fat intakes and % fat of energy in the HDDC were significantly lower than those in the LDDC. But, carbohydrate (CHO) and potassium intake and %CHO of energy in the HDDC were significantly higher than those in the LDDC. KDDS and GMVDF showed significant differences between groups (p=0.033; p=0.012).
-
Conclusions
- Continuous intervention by specialized nutritionists for long-term self-regulation is needed for diabetic patients, and the high compliance to diabetic diet and increasing physical activity may be effective in the prevention of metabolic syndrome.
- 1. Beach KW, Strandness DE. Arteriosclerosis obliterans and associated risk factor in insulin-dependent and non-insulin-dependent diabetes. Diabetes 1980; 29(11): 882-888.ArticlePubMed
- 2. Ministry of Health and Welfare. Korea Centers for Disease Control and Prevention. Korea National Health and Nutrition Examination Survey [internet]. 2013; cited 2015 May 22]. Available from: http://knhanes.cdc.go.kr/.
- 3. Meigs JB. Invited commentary: insulin resistance syndrome? Syndrome X? multiple metabolic syndrome? a syndrome at all? factor analysis reveals patterns in the fabric of correlated metabolic risk factors. Am J Epidemiol 2000; 152(10): 908-911.ArticlePubMed
- 4. Krolewski AS, Kosinki EJ, Warram JH, Leland OS, Busick EJ, Asmal AC, et al. Magnitude and determinants of coronary artery disease in juvenile-onset, insulin-dependent diabetes mellitus. Am J Cardiol 1987; 59(8): 750-755.ArticlePubMed
- 5. Kim WY, Kim JE, Choi YJ, Huh KB. Nutritional risk and metabolic syndrome in Korean type 2 diabetes mellitus. Asia Pac J Clin Nutr 2008; 17: Suppl 1. 47-51.PubMed
- 6. Kim TH, Kim DJ, Lim S, Jeong IK, Son H, Chung CH, et al. Prevalence of the metabolic syndrome in type 2 diabetic patients. Korean Diabetes J 2009; 33(1): 40-47.Article
- 7. Franz MJ, Horton ES, Bantle JP, Beebe CA, Brunzell JD, Coulston AM, et al. Nutrition principles for the management of diabetes and related complications. Diabetes Care 1994; 17(5): 490-518.PubMed
- 8. Feskens EJ, Bowles CH, Kromhout D. Carbohydrate intake and body mass index in relation to the risk of glucose intolerance in an elderly population. Am J Clin Nutr 1991; 54(1): 136-140.ArticlePubMed
- 9. Yang EJ. A study on dietary factors related to the incidence of diabetes mellitus in Korea [dissertation]. Ewha Womans University; 1997.
- 10. Kim EK, Lee JS, Hong H, Yu CH. Association between glycemic index, glycemic load, dietary carbohydrates and diabetes from Korean national health and nutrition examination survey 2005. Korean J Nutr 2009; 42(7): 622-630.Article
- 11. Yoo H, Kim YH. A study on the characteristics of nutrient intake in metabolic syndrome subjects. Korean J Nutr 2008; 41(6): 510-517.
- 12. Devaraj S, Wang-Polagruto J, Polagruto J, Keen CL, Jialal I. High-fat, energy-dense, fast-food-style breakfast results in an increase in oxidative stress in metabolic syndrome. Metabolism 2008; 57(6): 867-870.ArticlePubMedPMC
- 13. Stuckey MI, Shapiro S, Gill DP, Petrella RJ. A lifestyle intervention supported by mobile health technologies to improve the cardiometabolic risk profile of individuals at risk for cardiovascular disease and type 2 diabetes: study rationale and protocol. BMC Public Health 2013; 13(1): 1051-1061.ArticlePubMedPMCPDF
- 14. Pan XR, Li GW, Hu YH, Wang JX, Yang WY, An ZX, et al. Effects of diet and exercise in preventing NIDDM in people with impaired glucose tolerance: the da qing IGT and diabetes study. Diabetes Care 1997; 20(4): 537-544.ArticlePubMedPDF
- 15. Hu FB, Manson JE, Stampfer MJ, Colditz G, Solomon CG, Willett WC. Diet, lifestyle, and risk of type 2 diabetes mellitus in women. N Engl J Med 2001; 345(11): 790-797.ArticlePubMed
- 16. Kim JH. Effect of nutrition education on knowledge, attitude and behavior about dietary therapy and blood glucose control in type 2 diabetic patients [master's thesis]. Keimyung University; 2002.
- 17. Lee HS, Joo J, Choue R. Study on diet-related quality of life in online self-help diabetes mellitus patients who practice dietary regimen. Korean J Community Nutr 2011; 16(1): 136-144.Article
- 18. Krebs-Smith SM, Smiciklas-Wright H, Guthrie HA, Krebs-Smith J. The effects of variety in food choices on dietary quality. J Am Diet Assoc 1987; 87(7): 897-903.ArticlePubMed
- 19. Kim MH, Lee JC, Bae YJ. The evaluation study on eating behavior and dietary quality of elderly people residing in Samcheok according to age group. Korean J Community Nutr 2009; 14(5): 495-508.
- 20. IPAQ. Downloadable questionnaires [Internet]. IPAQ; 2005; cited 2011 Jan 23]. Available from: www.ipaq.ki.se.
- 21. Alberti KG, Eckel RH, Grundy SM, Zimmet PZ, Cleeman JI, Donato KA, et al. Harmonizing the metabolic syndrome: a joint interim statement of the international diabetes federation task force on epidemiology and prevention; national heart, lung, and blood institute; American heart association; world heart federation; international atherosclerosis society; and international association for the study of obesity. Circulation 2009; 120(16): 1640-1645.ArticlePubMed
- 22. Lee SY, Park HS, Kim DJ, Han JH, Kim SM, Cho GJ, et al. Appropriate waist circumference cutoff points for central obesity in Korean adults. Diabetes Res Clin Pract 2007; 75(1): 72-80.ArticlePubMed
- 23. Choi JE, Seo JS. Interrelationship between diabetic control and related factors of dietary in diabetic patients. J Korean Diet Assoc 2005; 11(2): 137-146.
- 24. Isomaa B, Almgren P, Tuomi T, Forsén B, Lahti K, Nissén M, et al. Cardiovascular morbidity and mortality associated with the metabolic syndrome. Diabetes Care 2001; 24(4): 683-689.ArticlePubMedPDF
- 25. Nettleton JA, Jebb S, Riserus U, Koletzko B, Fleming J. Role of dietary fats in the prevention and treatment of the metabolic syndrome. Ann Nutr Metab 2014; 64(2): 167-178.ArticlePubMedLink
- 26. Katzmarzyk PT, Leon AS, Wilmore JH, Skinner JS, Rao DC, Rankinen T, et al. Targeting the metabolic syndrome with exercise: evidence from the HERITAGE Family Study. Med Sci Sports Exerc 2003; 35(10): 1703-1709.ArticlePubMed
- 27. Blair SN, Connelly JC. How much physical activity should we do? the case for moderate amounts and intensities of physical activity. Res Q Exerc Sport 1996; 67(2): 193-205.ArticlePubMed
- 28. Vaughan C, Schoo A, Janus ED, Philpot B, Davis-Lameloise N, Lo SK, et al. The association of levels of physical activity with metabolic syndrome in rural Australian adults. BMC Public Health 2009; 9(1): 273.ArticlePubMedPMCPDF
- 29. Franks PW, Ekelund U, Brage S, Wong MY, Wareham NJ. Does the association of habitual physical activity with the metabolic syndrome differ by level of cardiorespiratory fitness? Diabetes Care 2004; 27(5): 1187-1193.ArticlePubMedPDF
- 30. Lim HS, Kim SK. Comparative of the Nutritional Status and Correlation of Cardiovascular Disease in Type II Diabetes Mellitus Patients with Metabolic Syndromes. Korean J Nutr 2008; 41(4): 327-340.
- 31. Warensjö E, Sundström J, Lind L, Vessby B. Factor analysis of fatty acids in serum lipids as a measure of dietary fat quality in relation to the metabolic syndrome in men. Am J Clin Nutr 2006; 84(2): 442-448.ArticlePubMed
- 32. Lastra G, Dhuper S, Johnson MS, Sowers JR. Salt, aldosterone, and insulin resistance: impact on the cardiovascular system. Nat Rev Cardiol 2010; 7(10): 577-584.ArticlePubMedPDF
- 33. Korean Diabetes Association. Treatment guideline for diabetes. 4th revision. Seoul: Korean Diabetes Association; 2011. p. 52.
- 34. Schulze MB, Liu S, Rimm EB, Manson JE, Willett WC, Hu FB. Glycemic index, glycemic load, and dietary fiber intake and incidence of type 2 diabetes in younger and middle-aged women. Am J Clin Nutr 2004; 80(2): 348-356.ArticlePubMed
- 35. Song Y, Joung H. A traditional Korean dietary pattern and metabolic syndrome abnormalities. Nutr Metab Cardiovasc Dis 2012; 22(5): 456-462.ArticlePubMed
REFERENCES
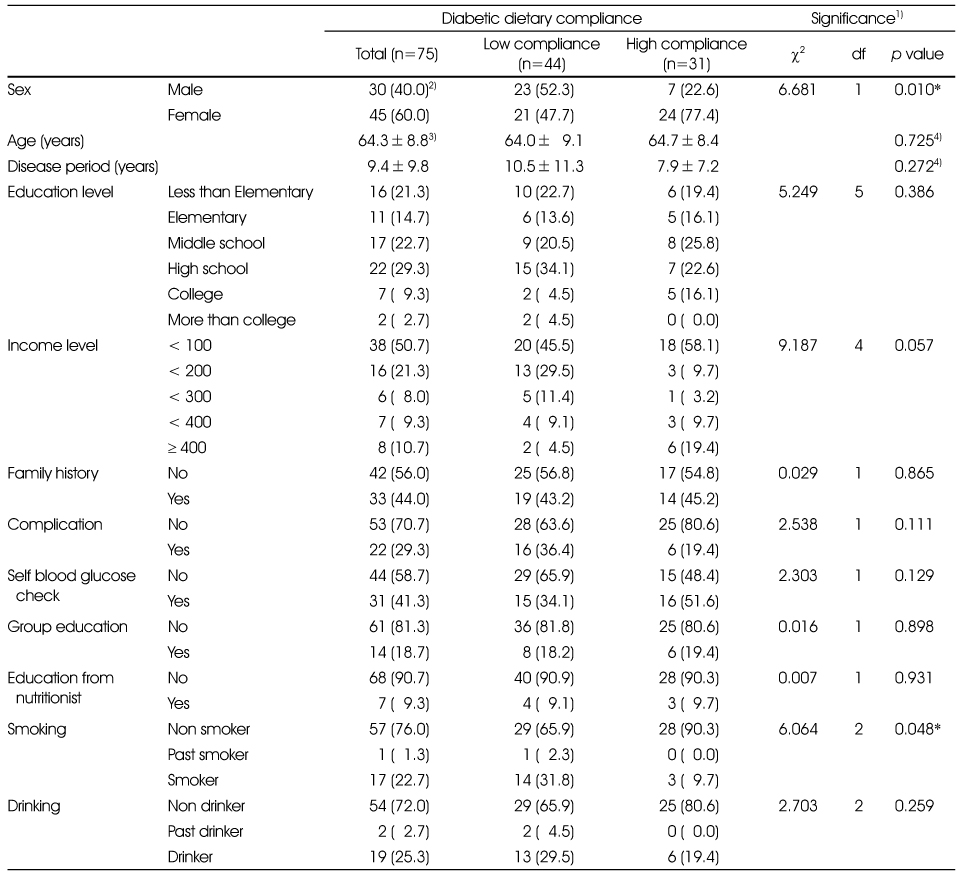
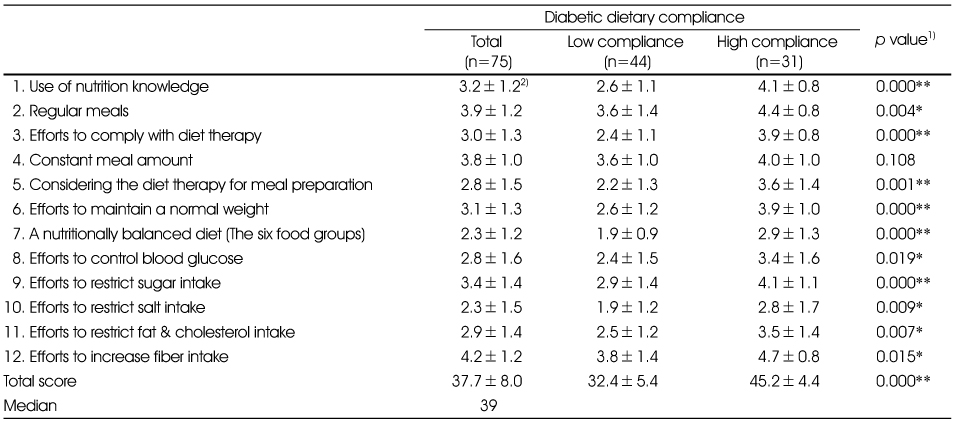
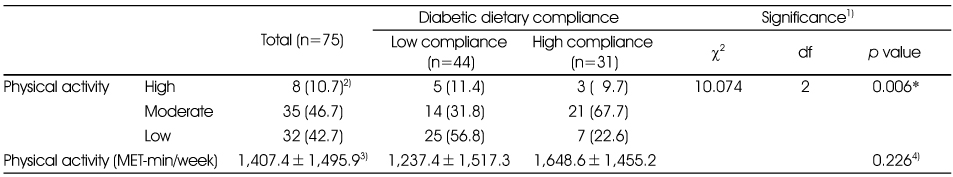
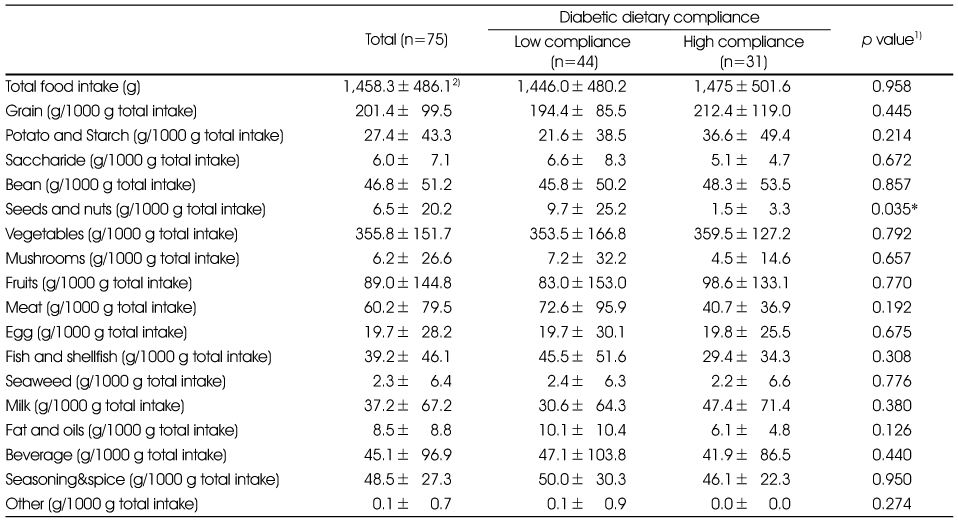
Table 5
Comparison of energy distribution and nutrient intake per 1,000 kcal according to the regimen of practice of diabetics
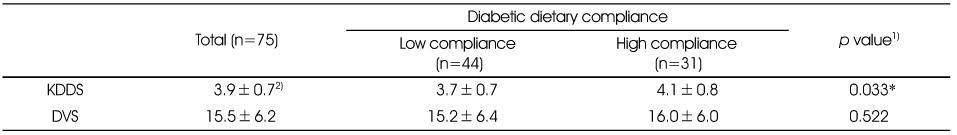
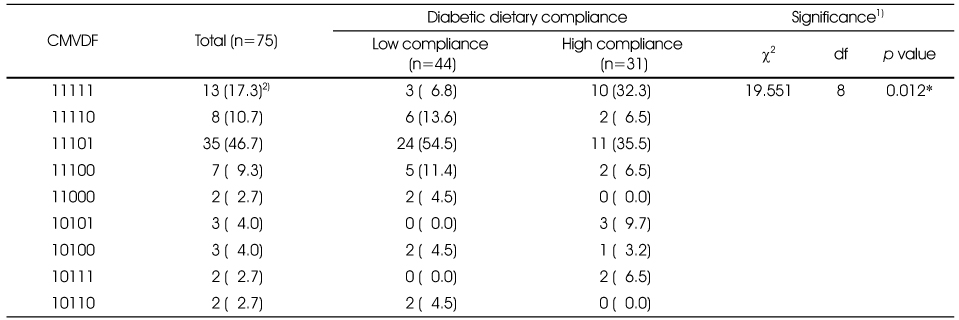
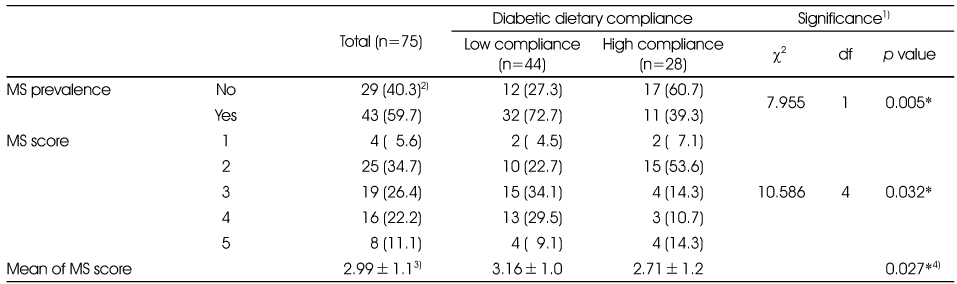
Figure & Data
REFERENCES
Citations
Citations to this article as recorded by 
- Effects of Depression, Patient Activation, and Family Support on Patient Role Behavior of Elderly Patients with Diabetes Mellitus
Jeong Hyun Park, Jung Suk Park
Journal of Korean Academy of psychiatric and Mental Health Nursing.2024; 33(4): 355. CrossRef - The Relationship between Meal Regularity and Oral Health and Metabolic Syndrome of Adults in Single Korean Households
Jin-Ah Jung, Hye-Won Cheon, On-Ju Ju
Journal of Dental Hygiene Science.2021; 21(3): 185. CrossRef - Effect of Nutrition Counseling by Nutrition Care Process on Diet Therapy Practice and Glycemic Control in Type 2 Diabetic Patients
Tae-Jeong Bae, Na-Eun Jeon, Soo-Kyong Choi, Jung-Sook Seo
Korean Journal of Community Nutrition.2020; 25(3): 214. CrossRef - Healthy Dining Out in Diabetic Patients
Hae-Young Lee
The Journal of Korean Diabetes.2017; 18(4): 264. CrossRef
 Cite
CiteThe Relations between Diabetic Dietary Compliance, Dietary Intake, and Physical Activity and the Prevalence of Metabolic Syndrome (MS) in Type 2 Diabetic Patients
The Relations between Diabetic Dietary Compliance, Dietary Intake, and Physical Activity and the Prevalence of Metabolic Syndrome (MS) in Type 2 Diabetic Patients
The general characteristics of the study subjects
1) Analyzed by Chi-square test
2) N (%)
3) Mean±SD
4) Independent t-test
*: p < 0.05
Diabetic dietary compliance score according to the regimen practice of diabetics
1) Analyzed by general linear model (adjusted for sex)
2) Mean±SD
*: p < 0.05, **: p < 0.001
The level of physical activity according to the regimen of practice of iabetics
1) Analyzed by Chi-square test
2) N (%)
3) Mean±SD
4) Analyzed by general linear model (adjusted for sex)
*: p < 0.05
Comparison of food intake per 1,000 g according to the regimen of practiceof diabetics
1) Analyzed by general linear model (adjusted for sex)
2) Mean±SD
*: p < 0.05
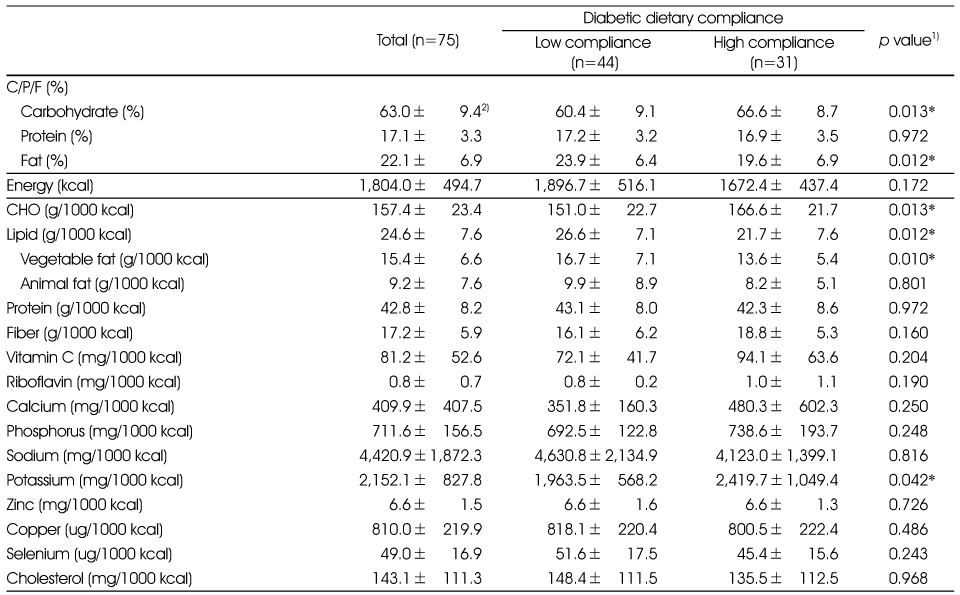
Comparison of energy distribution and nutrient intake per 1,000 kcal according to the regimen of practice of diabetics
1) Analyzed by general linear model (adjusted for sex)
2) Mean±SD
*: p < 0.05
Comparison of KDDS and DVS according to the regimen of practice of diabetics
1) Analyzed by general linear model (adjusted for sex)
2) Mean±SD
*: p < 0.05
Distribution of food group intake pattern (CMVDF) according to the regimen of practice of diabetics
1) Analyzed by Chi-square test
2) N (%)
*: p < 0.05
Comparison of metabolic syndrome (MS) and metabolic syndrome score (MS score) according to the regimen of practice of diabetics
1) Analyzed by Chi-square test
2) N (%)
3) Mean±SD
4) Analyzed by general linear model (adjusted for sex)
*: p < 0.05
Table 1
The general characteristics of the study subjects
1) Analyzed by Chi-square test 2) N (%) 3) Mean±SD 4) Independent t-test *:
Table 2
Diabetic dietary compliance score according to the regimen practice of diabetics
1) Analyzed by general linear model (adjusted for sex) 2) Mean±SD *:
Table 3
The level of physical activity according to the regimen of practice of iabetics
1) Analyzed by Chi-square test 2) N (%) 3) Mean±SD 4) Analyzed by general linear model (adjusted for sex) *:
Table 4
Comparison of food intake per 1,000 g according to the regimen of practiceof diabetics
1) Analyzed by general linear model (adjusted for sex) 2) Mean±SD *:
Table 5
Comparison of energy distribution and nutrient intake per 1,000 kcal according to the regimen of practice of diabetics
1) Analyzed by general linear model (adjusted for sex) 2) Mean±SD *:
Table 6
Comparison of KDDS and DVS according to the regimen of practice of diabetics
1) Analyzed by general linear model (adjusted for sex) 2) Mean±SD *:
Table 7
Distribution of food group intake pattern (CMVDF) according to the regimen of practice of diabetics
1) Analyzed by Chi-square test 2) N (%) *:
Table 8
Comparison of metabolic syndrome (MS) and metabolic syndrome score (MS score) according to the regimen of practice of diabetics
1) Analyzed by Chi-square test 2) N (%) 3) Mean±SD 4) Analyzed by general linear model (adjusted for sex) *:


