Articles
- Page Path
- HOME > Korean J Community Nutr > Volume 24(6); 2019 > Article
-
Research Article
- Dietary and Lifestyle Factors Associated with Weight Status among Korean Adolescents from Multicultural Families: Using Data from the 2017–2018 Korea Youth Risk Behavior Surveys
-
SuJin Song
 , Hyojune Song
-
Korean Journal of Community Nutrition 2019;24(6):465-475.
DOI: https://doi.org/10.5720/kjcn.2019.24.6.465
Published online: December 31, 2019
1Department of Food and Nutrition, Hannam University, Daejeon, Korea, Assistant Professor.
2Department of Multicultural Education, Hanyang University, Seoul, Korea, Graduate student.
- Corresponding author: SuJin Song. Department of Food and Nutrition, Hannam University. 1646 Yuseong-daero, Yuseong-gu, Daejeon 34054, Korea. Tel: (042) 629-8791, Fax: (042) 629-8789, sjsong@hnu.k
Copyright © 2019 The Korean Society of Community Nutrition
This is an Open-Access article distributed under the terms of the Creative Commons Attribution Non-Commercial License (http://creativecommons.org/licenses/by-nc/3.0/) which permits unrestricted non-commercial use, distribution, and reproduction in any medium, provided the original work is properly cited.
- 1,673 Views
- 6 Download
- 8 Crossref
Abstract
-
Objectives
- This study investigated dietary and lifestyle factors associated with the weight status among Korean adolescents in multicultural families.
-
Methods
- This cross-sectional study analyzed 1,751 multicultural families' adolescents who participated in the 2017–2018 Korea Youth Risk Behavior Surveys. Information on dietary and lifestyle factors was self-reported using a web-based questionnaire and this information included breakfast and foods consumption, perceived health status, alcohol drinking, smoking, physical activity, and weight control efforts. Body mass index (BMI) was calculated based on the self-reported height and body weight (kg/m2). Weight status was assessed according to the 2017 Korean National Growth Chart: underweight (weight-for-age <5th percentiles), overweight (85th≤ BMI-for-age <95th percentiles), and obese (BMI-for-age ≥95th percentiles). Multiple logistic regression analysis was performed to examine the dietary and lifestyle factors associated with weight status after adjustment for covariates.
-
Results
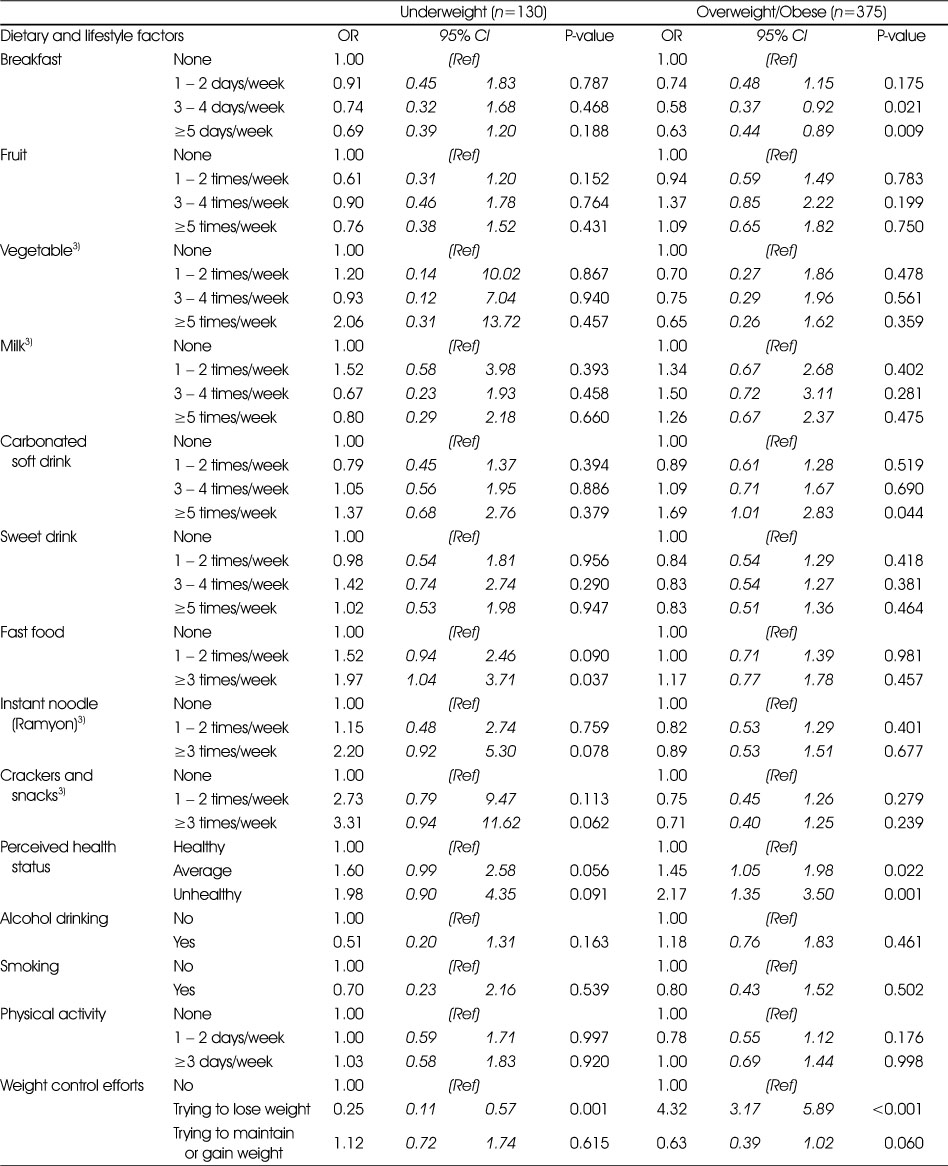
- Among Korean adolescents from multicultural families, the prevalence of overweight/obesity was 20.9%, whereas about 7% of adolescents were underweight. The weight status did not show differences according to gender, school level, area of residence, and household income. Compared to adolescents who did not have breakfast during the previous week, those who had breakfast 3–4 days/week and ≥5 days/week had a 42% (p=0.021) and a 37% (p=0.009) lower prevalence of overweight/obesity, respectively. The adolescents who frequently consumed carbonated soft drinks (≥5 times/week) showed an odds ratio (OR) of 1.69 (95% CI=1.01–2.83) for overweight/obesity relative to those adolescents who did not consume carbonated soft drinks. The OR of being underweight for adolescents who ate fast food ≥3 times/week was 1.97 (95% CI=1.04–3.71) compared to those adolescents who had not eaten fast food during the previous week.
-
Conclusions
- Dietary and lifestyle factors were associated with overweight/obesity as well as underweight among Korean adolescents in multicultural families. Our findings could be used to design and provide nutrition interventions for this specific population.
Acknowledgments
Acknowledgments
- 1. Ministry of the Interior and Safety. 2015 Population census. Sejong: Ministry of the Interior and Safety; 2016.
- 2. Korean Women's Development Institute. An analysis on the national survey of multicultural families 2015. Seoul: Korean Women's Development Institute; 2016.
- 3. Statistics Korea. Dynamics of multicultural population statistics 2017. Daejeon: Statistics Korea; 2018.
- 4. Kim HR. Health status of marriage-based immigrants in Korea and policy directions. Seoul: Korea Institue for Health and Social Affairs; 2010.
- 5. Kim H, Yoo S, Cho S, Kwon EJ, Kim S, Park JY. Health status and associated health risks among female marriage immigrants in Korea. Korean J Health Educ Promot 2010; 27(5): 79-89.
- 6. Seo IJ, Park JS. Health promoting behaviors, health problems and self-rated health status in female marriage immigrant in Korea. J Digit Converg 2013; 11(4): 369-382.
- 7. Kim JM, Lee HS, Kim MH. Food adaptation and nutrient intake of female immigrants into Korea through marriage. Korean J Nutr 2012; 45(2): 159-169.Article
- 8. Kim JM, Lee NH. Analysis of the dietary life of immigrant women from multicultural families in the Daegu area. J Korean Diet Assoc 2009; 15(4): 405-418.
- 9. Ministry of Education. 2018 Korea school health examination survey. Sejong: Ministry of Eeducation; 2019.
- 10. Kwon E, Nah EH. Secular trends in height, weight and obesity among Korean children and adolescents in 2006–2015. Korean J Health Educ Promot 2016; 33(2): 1-13.Article
- 11. Kim KE, Kim SH, Park S, Khang YH, Park MJ. Changes in prevalence of obesity and underweight among Korean children and adolescents: 1998-2008. Korean J Obes 2012; 21(4): 228-235.Article
- 12. de Gouw L, Klepp KI, Vignerová J, Lien N, Steenhuis IH, Wind M. Associations between diet and (in)activity behaviours with overweight and obesity among 10–18-year-old Czech Republic adolescents. Public Health Nutr 2010; 13(10A): 1701-1707.ArticlePubMed
- 13. Croezen S, Visscher TL, Ter Bogt NC, Veling ML, Haveman-Nies A. Skipping breakfast, alcohol consumption and physical inactivity as risk factors for overweight and obesity in adolescents: results of the E-MOVO project. Eur J Clin Nutr 2009; 63(3): 405-412.ArticlePubMedPDF
- 14. Hatami M, Taib MN, Jamaluddin R, Saad HA, Djazayery A, Chamari M, et al. Dietary factors as the major determinants of overweight and obesity among Iranian adolescents. A cross-sectional study. Appetite 2014; 82: 194-201.ArticlePubMed
- 15. Ambrosini GL, Oddy WH, Huang RC, Mori TA, Beilin LJ, Jebb SA. Prospective associations between sugar-sweetened beverage intakes and cardiometabolic risk factors in adolescents. Am J Clin Nutr 2013; 98(2): 327-334.ArticlePubMedPMC
- 16. Im Y, Oh WO, Suk MH. Adolescent health behaviors according to body mass index. Child Health Nurs Res 2017; 23(1): 1-9.ArticlePDF
- 17. Korea Health Promotion Institute. Health plan 2020 trend report 2018. Seoul: Korea Health Promotion Institute; 2018.
- 18. Lee JY, Park SK, Oh BT, Hwang YS, Hong SW, Kim DH, et al. Factors influencing overweight in Korean adolescents: analysis of 2015 Korean Youth Risk Behavior Web-Based Survey. Korean J Fam Pract 2017; 7(5): 653-659.Article
- 19. Park H. Comparison of the risk for being underweight between multicultural and Korean-origin adolescents. J Korean Soc Sch Health 2017; 30(3): 240-250.
- 20. Choi YS. Comparison of dietary habits of adolescents from multicultural and general Korean families: the 9th Korea Youth Risk Behavior Web-based Survey. Korean Parent Child Health J 2015; 18(2): 58-67.
- 21. Ministry of Education. Ministry of Health and Welfare. Centers for Disease Control and Prevention. The 14th Korea Youth Risk Behavior Survey, 2018. Cheongju: Centers for Disease Control and Prevention; 2018.
- 22. Kim JH, Yun S, Hwang S, Shim JO, Chae HW, Lee YJ, et al. The 2017 Korean National Growth Charts for children and adolescents: development, improvement, and prospects. Korean J Pediatr 2018; 61(5): 135-149.ArticlePubMedPMCPDF
- 23. Ogden CL, Lamb MM, Carroll MD, Flegal KM. Obesity and socioeconomic status in children and adolescents: United States, 2005–2008. NCHS Data Brief 2010; 51: 1-8.
- 24. Noonan RJ. Poverty, weight status, and dietary intake among UK adolescents. Int J Environ Res Public Health 2018; 15(6): 1224.ArticlePubMedPMC
- 25. Frederick CB, Snellman K, Putnam RD. Increasing socioeconomic disparities in adolescent obesity. Proc Natl Acad Sci USA 2014; 111(4): 1338-1342.ArticlePubMedPMC
- 26. Vik FN, Te Velde SJ, Van Lippevelde W, Manios Y, Kovacs E, Jan N, et al. Regular family breakfast was associated with children's overweight and parental education: Results from the ENERGY cross-sectional study. Prev Med 2016; 91: 197-203.ArticlePubMedPMC
- 27. Deshmukh-Taskar PR, Nicklas TA, O'Neil CE, Keast DR, Radcliffe JD, Cho S. The relationship of breakfast skipping and type of breakfast consumption with nutrient intake and weight status in children and adolescents: the National Health and Nutrition Examination Survey 1999–2006. J Am Diet Assoc 2010; 110(6): 869-878.ArticlePubMed
- 28. Arora M, Nazar GP, Gupta VK, Perry CL, Reddy KS, Stigler MH. Association of breakfast intake with obesity, dietary and physical activity behavior among urban school-aged adolescents in Delhi, India: results of a cross-sectional study. BMC Public Health 2012; 12: 881.ArticlePubMedPMCPDF
- 29. Malik VS, Pan A, Willett WC, Hu FB. Sugar-sweetened beverages and weight gain in children and adults: a systematic review and meta-analysis. Am J Clin Nutr 2013; 98(4): 1084-1102.ArticlePubMedPMC
- 30. Lee HS, Kwon SO, Lee Y. Weight status and dietary factors associated with sugar-sweetened beverage intake among Korean children and adolescents: Korea National Health and Nutrition Examination Survey, 2008-2011. Clin Nutr Res 2013; 2(2): 135-142.ArticlePubMedPMC
- 31. Siu JY, Chan K, Lee A. Adolescents from low-income families in Hong Kong and unhealthy eating behaviours: Implications for health and social care practitioners. Health Soc Care Community 2019; 27(2): 366-374.ArticlePubMedPDF
- 32. Yeoh YJ, Yoon JH, Shim JE, Chung SJ. Factors associated with skipping breakfast in Korean children: analysis of data from the 2001 National Health and Nutrition Survey. Korean J Community Nutr 2008; 13(1): 62-68.
- 33. Gebremariam MK, Henjum S, Terragni L, Torheim LE. Correlates of fruit, vegetable, soft drink, and snack intake among adolescents: the ESSENS study. Food Nutr Res 2016; 60(1): 32512.ArticlePubMed
- 34. Braithwaite I, Stewart AW, Hancox RJ, Beasley R, Murphy R, Mitchell EA. Fast-food consumption and body mass index in children and adolescents: an international cross-sectional study. BMJ Open 2014; 4(12): e005813.ArticlePubMedPMC
- 35. French SA, Story M, Neumark-Sztainer D, Fulkerson JA, Hannan P. Fast food restaurant use among adolescents: associations with nutrient intake, food choices and behavioral and psychosocial variables. Int J Obes Relat Metab Disord 2001; 25(12): 1823-1833.ArticlePubMedPDF
- 36. Powell LM, Nguyen BT. Fast-food and full-service restaurant consumption among children and adolescents: effect on energy, beverage, and nutrient intake. JAMA Pediatr 2013; 167(1): 14-20.ArticlePubMedPMC
- 37. Pereira MA, Kartashov AI, Ebbeling CB, Van Horn L, Slattery ML, Jacobs DR Jr, et al. Fast-food habits, weight gain, and insulin resistance (the CARDIA study): 15-year prospective analysis. Lancet 2005; 365(9453): 36-42.ArticlePubMed
- 38. Wilson TA, Adolph AL, Butte NF. Nutrient adequacy and diet quality in non-overweight and overweight Hispanic children of low socioeconomic status: the Viva la Familia Study. J Am Diet Assoc 2009; 109(6): 1012-1021.ArticlePubMedPMC
- 39. Mellendick K, Shanahan L, Wideman L, Calkins S, Keane S, Lovelady C. Diets rich in fruits and vegetables are associated with lower cardiovascular disease risk in adolescents. Nutrients 2018; 10(2): 136.ArticlePubMedPMC
- 40. Bradlee ML, Singer MR, Qureshi MM, Moore LL. Food group intake and central obesity among children and adolescents in the Third National Health and Nutrition Examination Survey (NHANES III). Public Health Nutr 2010; 13(6): 797-805.ArticlePubMed
- 41. Abreu S, Santos R, Moreira C, Santos PC, Vale S, Soares-Miranda L, et al. Relationship of milk intake and physical activity to abdominal obesity among adolescents. Pediatr Obes 2014; 9(1): 71-80.ArticlePubMed
- 42. Di Noia J, Byrd-Bredbenner C. Determinants of fruit and vegetable intake in low-income children and adolescents. Nutr Rev 2014; 72(9): 575-590.ArticlePubMed
- 43. The Korean Nutrition Society. Dietary reference intakes for Koreans 2015. Seoul: The Korean Nutrition Society; 2016.
- 44. Yang KE, Ham SH. Ethnic minority children's sense of school belonging: empirical patterns and social policy implications. Social Welfare Policy 2018; 45(1): 60-81.Article
- 45. Park MS, Cha YK, Kim HK. A study on communication and conflicts between children and their parents of multi-cultural families living in rural areas. Multicult Educ Stud 2014; 7(4): 101-122.Article
- 46. Kim SY, Shin YG. Exploring the priority of the education supports for the multi-cultural families in order to reduce multi-cultural students' educational disadvantage. J Reg Stud Dev 2012; 21(2): 101-138.
- 47. Song H, Kim DS, Ham SH. Effects of immigrant residential concentration on student performance: native versus immigrant pupils. Multicult Educ Stud 2018; 11(1): 1-18.Article
- 48. Yim SY, Park MH. Behaviors and mental health of adolescents in multi-cultural families compared to general families. J Korean Data Analys Soc 2014; 16(3): 1641-1651.
- 49. Crosnoe R. Double disadvantage or signs of resilience? The elementary school contexts of children from Mexican immigrant families. Am Educ Res J 2005; 42(2): 269-303.ArticlePDF
- 50. Ministry of Gender Equality and Family. Plans for multicultural family support initiatives (2018–2022). Seoul: Ministry of Gender Equality and Family; 2018.
- 51. Jung SK, Jung YS. An analysis on the service of ‘Multicultural Family Support Center’ in Korea. Korea Govern Assoc 2010; 17(2): 229-256.Article
- 52. Song H, Yang KE. The effect of school-home-community connection on the alleviation of teachers' challenges in neighborhoods of immigrant concentration. J Sch Soc Work 2018; 43: 81-99.Article
- 53. Epstein JL. School/family/community partnerships: caring for the children we share. Phi Delta Kappan 2010; 92(3): 81-96.ArticlePDF
REFERENCES
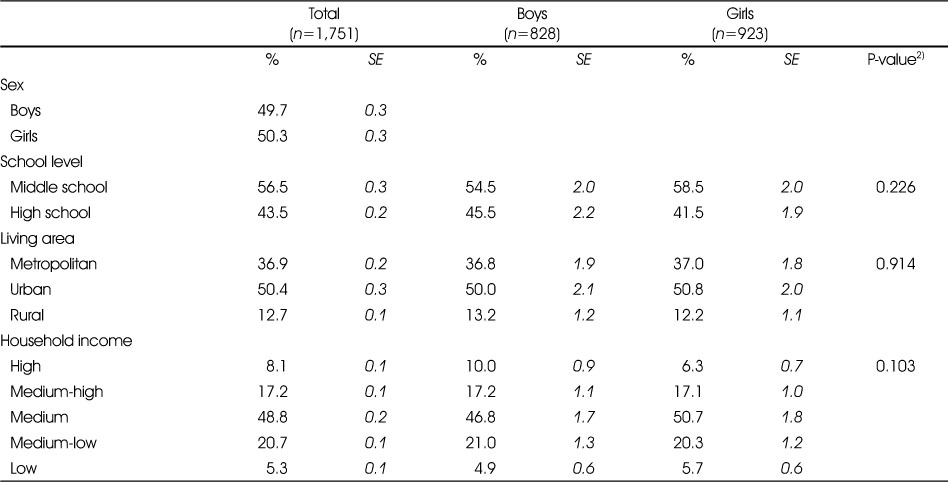
Weight status by sociodemographic characteristics among Korean adolescents from multicultural families. All analyses accounted for the complex sampling design effect and appropriate sampling weights. Weight status was assessed according to the 2017 Korean National Growth Chart: underweight (weight-for-age <5th percentiles), overweight (85th≤ BMI-for-age <95th percentiles), and obese (BMI-for-age ≥95th percentiles). P-values were obtained from the chi-square test.

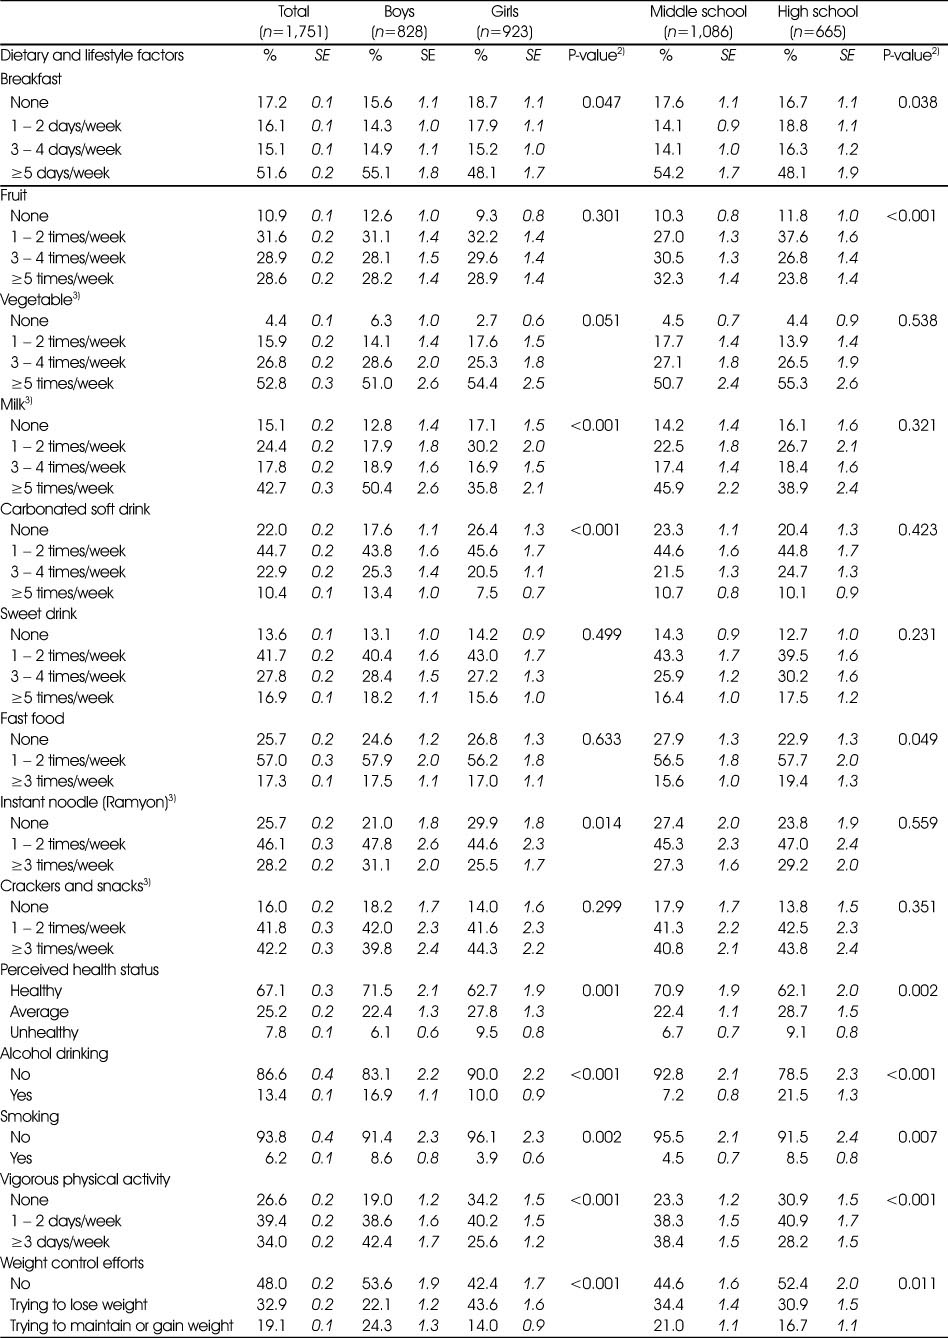
Dietary and lifestyle factors by sex and school level among Korean adolescents from multicultural families1)

Associations of dietary and lifestyle factors with weight status among Korean adolescents from multicultural families1, 2)

95% CI, 95% confidence interval; OR, odds ratio; Ref, reference.
1) All analyses accounted for the complex sampling design effect and appropriate sampling weights.
2) OR (95% CI) and P-values were obtained from the multiple logistic regression models after adjustment for sex, age, living area, household income, alcohol drinking, smoking, physical activity, and weight control, where applicable.
3) Underweight n=57, overweight/obese n=177.
Figure & Data
REFERENCES
Citations

- Prevalence of Malnutrition and Obesity Among Children and Adolescents From Immigrant Families Living in Korea
Seong-Woo Choi, So-Yeong Kim, Kyung-Ae Park
Journal of Korean Maternal and Child Health.2025; 29(1): 29. CrossRef - Fruit Consumption and Mental Health in Adolescents from Multicultural and Non-multicultural Families: Data from Korea Youth Risk Behavior Web Based Survey 2021
Soohyun Kim, Jeong-Hwa Choi, Young-Ran Heo
Human Ecology Research.2025; 63(2): 175. CrossRef - Identification of important features in overweight and obesity among Korean adolescents using machine learning
Serim Lee, JongSerl Chun
Children and Youth Services Review.2024; 161: 107644. CrossRef - Dietary Behaviors Associated with Health Perception of Korean Adolescents from Multicultural Families: based on data from the 2017 ~ 2019 Korea Youth Risk Behavior Surveys
YueRong Hu, SuJin Song
Korean Journal of Community Nutrition.2022; 27(3): 192. CrossRef - Effects of heavy metal, vitamin, and curry consumption on metabolic syndrome during menopause: a Korean community-based cross-sectional study
Hai Duc Nguyen, Min-Sun Kim
Menopause.2021; 28(8): 949. CrossRef - Association between levels of thiamine intake, diabetes, cardiovascular diseases and depression in Korea: a national cross-sectional study
Hai Nguyen Duc, Hojin Oh, In Mo Yoon, Min-Sun Kim
Journal of Nutritional Science.2021;[Epub] CrossRef - Effects of Antioxidant Vitamins, Curry Consumption, and Heavy Metal Levels on Metabolic Syndrome with Comorbidities: A Korean Community-Based Cross-Sectional Study
Hai Nguyen Duc, Hojin Oh, Min-Sun Kim
Antioxidants.2021; 10(5): 808. CrossRef - Study on the Dietary Behavior of Adolescents in Multicultural Families Using the Nutrition Quotient and Their Changes in the Nutrition Knowledge and the Dietary Attitudes after Nutrition Education
Yoo-Jin Jung, Sung Hee Min, Min June Lee
Journal of the East Asian Society of Dietary Life.2020; 30(3): 208. CrossRef

Fig. 1
Sociodemographic characteristics of the study subjects by sex1)
SE, standard error.
1) All analyses accounted for the complex sampling design effect and appropriate sampling weights.
2) P-values were obtained from the chi-square test.
Dietary and lifestyle factors by sex and school level among Korean adolescents from multicultural families1)
SE, standard error.
1) All analyses accounted for the complex sampling design effect and appropriate sampling weights.
2) P-values were obtained from the chi-square test.
3) n=863.
Associations of dietary and lifestyle factors with weight status among Korean adolescents from multicultural families1, 2)
95% CI, 95% confidence interval; OR, odds ratio; Ref, reference.
1) All analyses accounted for the complex sampling design effect and appropriate sampling weights.
2) OR (95% CI) and P-values were obtained from the multiple logistic regression models after adjustment for sex, age, living area, household income, alcohol drinking, smoking, physical activity, and weight control, where applicable.
3) Underweight n=57, overweight/obese n=177.
SE, standard error. 1) All analyses accounted for the complex sampling design effect and appropriate sampling weights. 2) P-values were obtained from the chi-square test.
SE, standard error. 1) All analyses accounted for the complex sampling design effect and appropriate sampling weights. 2) P-values were obtained from the chi-square test. 3)
95% CI, 95% confidence interval; OR, odds ratio; Ref, reference. 1) All analyses accounted for the complex sampling design effect and appropriate sampling weights. 2) OR (95% CI) and P-values were obtained from the multiple logistic regression models after adjustment for sex, age, living area, household income, alcohol drinking, smoking, physical activity, and weight control, where applicable. 3) Underweight

 KSCN
KSCN

 Cite
Cite


