
Articles
- Page Path
- HOME > Korean J Community Nutr > Volume 24(6); 2019 > Article
-
Research Article
- Effect of Geographic Area on Dietary Quality across Different Age Groups in Korea
-
Hyun Ja Kim
 , Kirang Kim
 -
Korean Journal of Community Nutrition 2019;24(6):453-464.
DOI: https://doi.org/10.5720/kjcn.2019.24.6.453
Published online: December 31, 2019
1Department of Food and Nutrition, Gangneung-Wonju National University, Gangneung, Korea, Professor.
2Department of Food Science and Nutrition, Dankook University, Cheonan, Korea, Professor.
- Corresponding author: Kirang Kim. Department of Food Science and Nutrition, Dankook University, 119, Dandae-ro, Dongnam-gu, Cheonan 31116, Korea. Tel: (041)550-3472, Fax: (041)559-7955, kirangkim@dankook.ac.kr
• Received: September 18, 2019 • Revised: November 4, 2019 • Accepted: November 4, 2019
Copyright © 2019 The Korean Society of Community Nutrition
This is an Open-Access article distributed under the terms of the Creative Commons Attribution Non-Commercial License (http://creativecommons.org/licenses/by-nc/3.0/) which permits unrestricted non-commercial use, distribution, and reproduction in any medium, provided the original work is properly cited.
- 2,123 Views
- 7 Download
- 11 Crossref
Abstract
-
Objectives
- The objective of this study was to examine whether dietary quality varies among different age groups and geographic areas, and whether the difference between geographic areas varies across several age groups in Korea.
-
Methods
- The subjects were 14,170 subjects who participated in the 2013–2015 Korea National Health and Nutrition Examination Survey. The dietary quality was assessed using the Korean Health Eating Index (KHEI). Age groups were categorized into six groupings, and areas were categorized into urban and rural according to their administrative districts. The effect of area on the KHEI score was analyzed by multiple linear regression analysis.
-
Results
- The KHEI was the lowest in the 20-30s group (57.7 ± 0.4 score for 20s and 61.2 ± 0.3 score for 30s) and increased with age (p<0.001), showing the highest score in the 60s (67.9 ± 0.3 score), and then decreased again in the 70s and older (64.6 ± 0.3 score). As a result of comparing the KHEI score by area, the urban areas had higher KHEI scores than did the rural areas (63.5 ± 0.2 score for urban area and 62.2 ± 0.4 score for rural area, p=0.002). The difference between areas was dependent on the age group, showing a significant difference for subjects who were aged from 50s and older (p=0.002 for 50s, p<0.001 for 60s and p<0.001 for 70s and older). After adjusting for confounding factors, the effect of area on the KHEI score was only shown for those subjects in the over 60 years old group (p=0.035 for 60s and p<0.001 for 70s and older).
-
Conclusions
- The dietary quality differed according to the age group and geographic area. The dietary quality was lower for younger people than that for older people, and in rural areas compared to that in urban areas, and especially for older adults. The area factor was a very important factor for the dietary quality.
Acknowledgments
Acknowledgments
- 1. World Health Organization. Diet, nutrition and the prevention of chronic diseases. . Geneva: World Health Organization; 2003. p. 916.
- 2. World Health Organization. Global action plan for the prevention and control of noncommunicable diseases 2013–2020. Geneva: World Health Organization; 2013.
- 3. Forouzanfar MH, Afshin A, Alexander LT, Anderson HR, Bhutta ZA, Biryukov S. Global, regional, and national comparative risk assessment of behavioural, environmental and occupational, and metabolic risks or clusters of risks, 1990-2015: a systematic analysis for the Global Burden of Disease Study 2015. Lancet 2016; 388(10053): 1659-1724. PubMedPMC
- 4. Kennedy ET, Ohls J, Carlson S, Fleming K. The healthy eating index: design and applications. J Am Diet Assoc 1995; 95(10): 1103-1108.PubMed
- 5. Haines PS, Siega-Riz AM, Popkin BM. The diet quality index revised: a measurement instrument for populations. J Am Diet Assoc 1999; 99(6): 697-704. PubMed
- 6. Kim S, Haines PS, Siega-Riz AM, Popkin BM. The diet quality index-international (DQI-I) provides an effective tool for cross-national comparison of diet quality as illustrated by China and the United States. J Nutr 2003; 133(11): 3476-3484. ArticlePubMed
- 7. Guenther PM, Casavale KO, Reedy J, Kirkpatrick SI, Hiza HA, Kuczynski KJ. Update of the healthy eating index: HEI-2010. J Acad Nutr Diet 2013; 113(4): 569-580. ArticlePubMedPMC
- 8. Woodruff SJ, Hanning RM. Development and implications of a revised Canadian healthy eating index (HEIC-2009). Public Health Nutr 2010; 13(6): 820-825.ArticlePubMed
- 9. Yook SM, Park S, Moon HK, Kim K, Shim JE, Hwang JY. Development of Korean Healthy Eating Index for adults using the Korea National Health and Nutrition Examination Survey data. J Nutr Health 2015; 48(5): 419-428. Article
- 10. Korea Centers for Disease Control and Prevention. The Sixth Korea National Health and Nutrition Examination Survey (KNHANES 2013–2015) Microdata user guide. Osong: Korea Centers for Disease Control and Prevention; 2019.
- 11. Variyam JN, Blaylock J, Smallwood D, Basiootis PP. USDA's Healthy Eating Index and Nutrition Information. Washington, DC: Economic Research Service and Center for Nutrition Policy and Promotion, USDA; 1998.
- 12. Al-Ibrahim AA, Jackson RT. Healthy eating index versus alternate healthy index in relation to diabetes status and health markers in U.S. adults: NHANES 2007-2010. Nutr J 2019; 18(1): 26.ArticlePubMedPMCPDF
- 13. Subhan FB, Chan CB. Diet quality and risk factors for cardiovascular disease among South Asians in Alberta. Appl Physiol Nutr Metab 2019; 44(8): 886-893. ArticlePubMed
- 14. Morton LW, Bitto EA, Oakland MJ, Sand M. Accessing food resources: Rural and urban patterns of giving and getting food. Agric Hum Values 2008; 25(1): 107-119.ArticlePDF
- 15. Sharkey JR, Johnson CM, Dean WR. Food access and perceptions of the community and household food environment as correlates of fruit and vegetable intake among rural seniors. BMC Geriatr 2010; 10(1): 32.ArticlePubMedPMCPDF
- 16. Dean WR, Sharkey JR. Rural and urban differences in the associations between characteristics of the community food environment and fruit and vegetable intake. J Nutr Educ Behav 2011; 43(6): 426-433. ArticlePubMedPMC
- 17. Caspi CE, Sorensen G, Subramanian SV, Kawachi I. The local food environment and diet: A systematic review. Health Place 2012; 18(5): 1172-1187. ArticlePubMedPMC
- 18. Lee JH. The regional health inequity, and individual and neighborhood level health determinants. Health Soc Welf Rev 2016; 36(2): 345-384. Article
- 19. Yoon TH. Regional health inequalities in Korea: The status and policy tasks. J Crit Soc Welf 2010; 30(8): 49-77.
- 20. Yun S. Development and status of Korean Healthy Eating Index for adults based on the Korea National Health and Nutrition Examination Survey. Nutrition and Dietetics 2019; 42(2): 14-19.
- 21. Ministry of Health and Welfare. A study on the establishment of the life cycle-based dietary guidelines for Koreans. Sejong: Ministry of Health and Welfare; 2016.
- 22. Jung HW, Kim SW, Kim IY, Lim JY, Park HS, Song W. Protein intake recommendation for Korean older adults to prevent sarcopenia: Expert consensus by the Korean Geriatric Society and the Korean Nutrition Society. Ann Geriatr Med Res 2018; 22(4): 167-175. ArticlePubMedPMC
- 23. Kim HR. A study on the association of diet quality and risk of mortality and major chronic diseases from nationally representative longitudinal data. Health Soc Welf Rev 2013; 33(3): 5-30. Article
- 24. Park GA, Kim SH, Kim SJ, Yang YJ. Health and nutritional status of Korean adults according to age and household food security: Using the data from 2010~2012 Korea National Health and Nutrition Examination Survey. J Nutr Health 2017; 50(6): 603-614. ArticleLink
- 25. Lee JH. The regional health inequity, and individual and neighborhood level health determinants. Health Soc Welf Rev 2016; 36(2): 345-384. Article
- 26. Lytle LA. Measuring the food environment: State of the science. Am J Prev Med 2009; 36(4 Suppl): S134-S144. PubMedPMC
- 27. Yoon H, Kwoun J, Lee S. Nutritional status and energy expenditure in the elderly in a rural community. Korean J Community Nutr 2002; 7(3): 336-344.
- 28. Cho YE, Lee SL, Cho EH, Lomeda RL, Kwak EH, Kim YH. Comparison of nutrient intakes of Korean elderly people living in rural area between 24-hour recall and food frequency method. J Korean Soc Food Sci Nutr 2006; 35(6): 698-707. Article
- 29. Lee Y, Choi Y, Park HR, Song KH, Lee KE, Yoo CH. Comparative analysis of dietary behavior and nutrient intake of elderly in urban and rural areas for development of “Village Lunch Table” program: Based on 2014 Korea National Health and Nutrition Examination Survey data. J Nutr Health 2017; 50(2): 171-179. ArticleLink
- 30. Choi HJ, Yoo JH. The effect of depression and self-efficacy on health promotion behavior among the elderly living alone in rural area. J East West Nurs Res 2011; 17(2): 149-155.
- 31. Lee MS. Health-related factors influencing the quality of life of rural elderly subjects-activities of daily living, cognitive functions, prevalence of chronic diseases and nutritional assessment. Korean J Community Nutr 2012; 17(6): 772-781. Article
- 32. Park E. A comparison of community health status by region and an investigation of related factors using community health indicators. J Korean Acad Community Health Nurs 2012; 23(1): 31-39. Article
- 33. Glanz K, Sallis JF, Saelens BE, Frank LD. Healthy nutrition environments: Concepts and measures. Am J Health Promot 2005; 19(5): 330-333. ArticlePubMedLink
- 34. Sharkey JR, Johnson CM, Dean WR. Food access and perceptions of the community and household food environment as correlates of fruit and vegetable intake among rural seniors. BMC Geriatr 2010; 10(1): 32.ArticlePubMedPMCPDF
- 35. Lee KI, Hwang YJ, Lee DS, Kim GY, Lee YN, Kim K. Strategic approach toward vitalizing food assistance programs. Naju: Korea Rural Economic Institute; 2012. p. 680.
- 36. Lee CH, Lee SE, Jang MJ, Choe JS, Park YH, Kim Y. An analysis of food purchase accessibility and availability for rural households: The cases of Bibong-myeon and Maesong-myeon, Hwaseong-si. Korean J Community Living Sci 2014; 25(4): 581-600. Article
- 37. Shim JE, Kim SJ, Kim K, Hwang JY. Spatial disparity in food environment and household economic resources related to food insecurity in rural Korean households with older adults. Nutrients 2018; 10(10): E1514. Article
- 38. Shim JE, Hwang JY, Kim K. Objective and perceived food environment and household economic resources related to food insecurity in older adults living alone in rural areas. BMC Geriatrics 2019; 19(1): 234.ArticlePubMedPMCPDF
- 39. Oh MH, Choe JS, Kim Y, Lee SE, Paik HY, Jang MJ. Customer perception and expert assessment in restaurant food environment by region: Focused on restaurants in Suwon, Hwaseong city. J Nutr Health 2014; 47(6): 463-474. Article
REFERENCES
Table 1
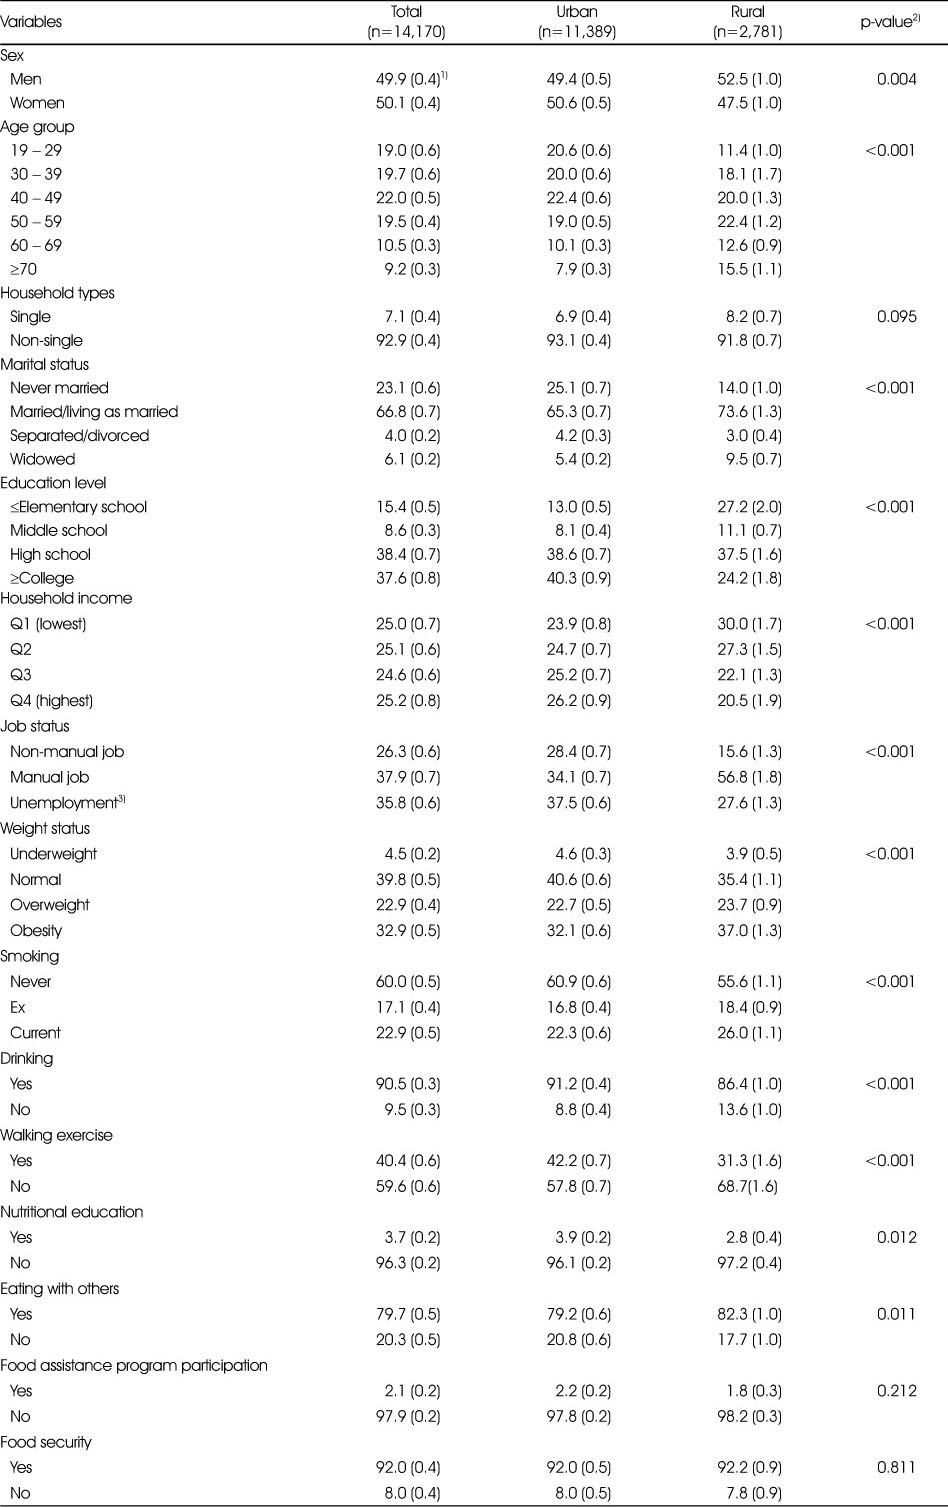
General characteristics of adults aged 19 years and older, 2013–2015 KNHANES
KNHANES, Korea National Health and Nutrition Examination Survey.
1) All % (SE) were calculated by applying sampling weights assigned to individual participants in the nutrition survey.
2) P-values for % differences between urban and rural area were calculated using the chi-square test
3) Including housewives or student
Table 2
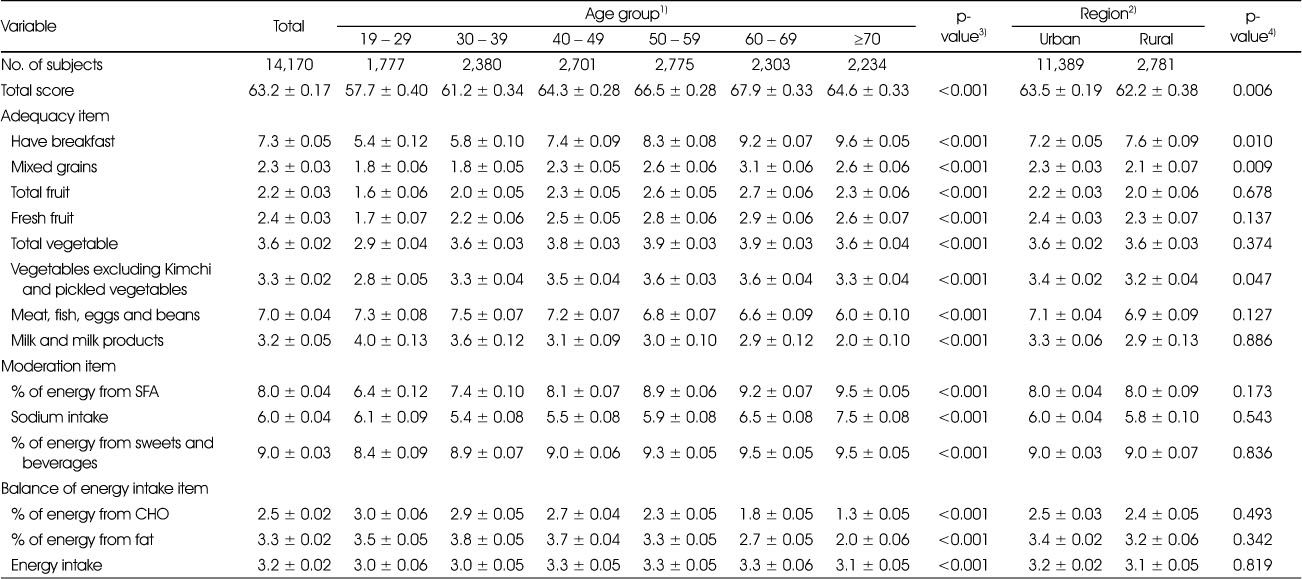
Mean value of each KHEI item by age group and region
KHEI, Korean Health Eating Index; SFA, saturated fatty acid; CHO, carbohydrate
All values were calculated by applying sampling weights assigned to individual participants in the nutrition survey.
1) Sex-adjusted means ± SE
2) Age- and sex-adjusted means ± SE
3) P-values for mean differences by age group and region were calculated using multivariate linear regression after adjusting for sex.
4) P-values for mean differences by age group and region were calculated using multivariate linear regression after adjusting for age (continuous) and sex.
Table 3

Difference of mean value of each KHEI item between urban and rural area according to age group
KHEI, Korean Health Eating Index; SFA, saturated fatty acid; CHO, carbohydrate
All values were calculated by applying sampling weights assigned to individual participants in the nutrition survey.
1) Sex-adjusted means ± SE
2) P-values for mean differences between urban and rural area were calculated using multivariate linear regression after adjusting for sex.
Table 4
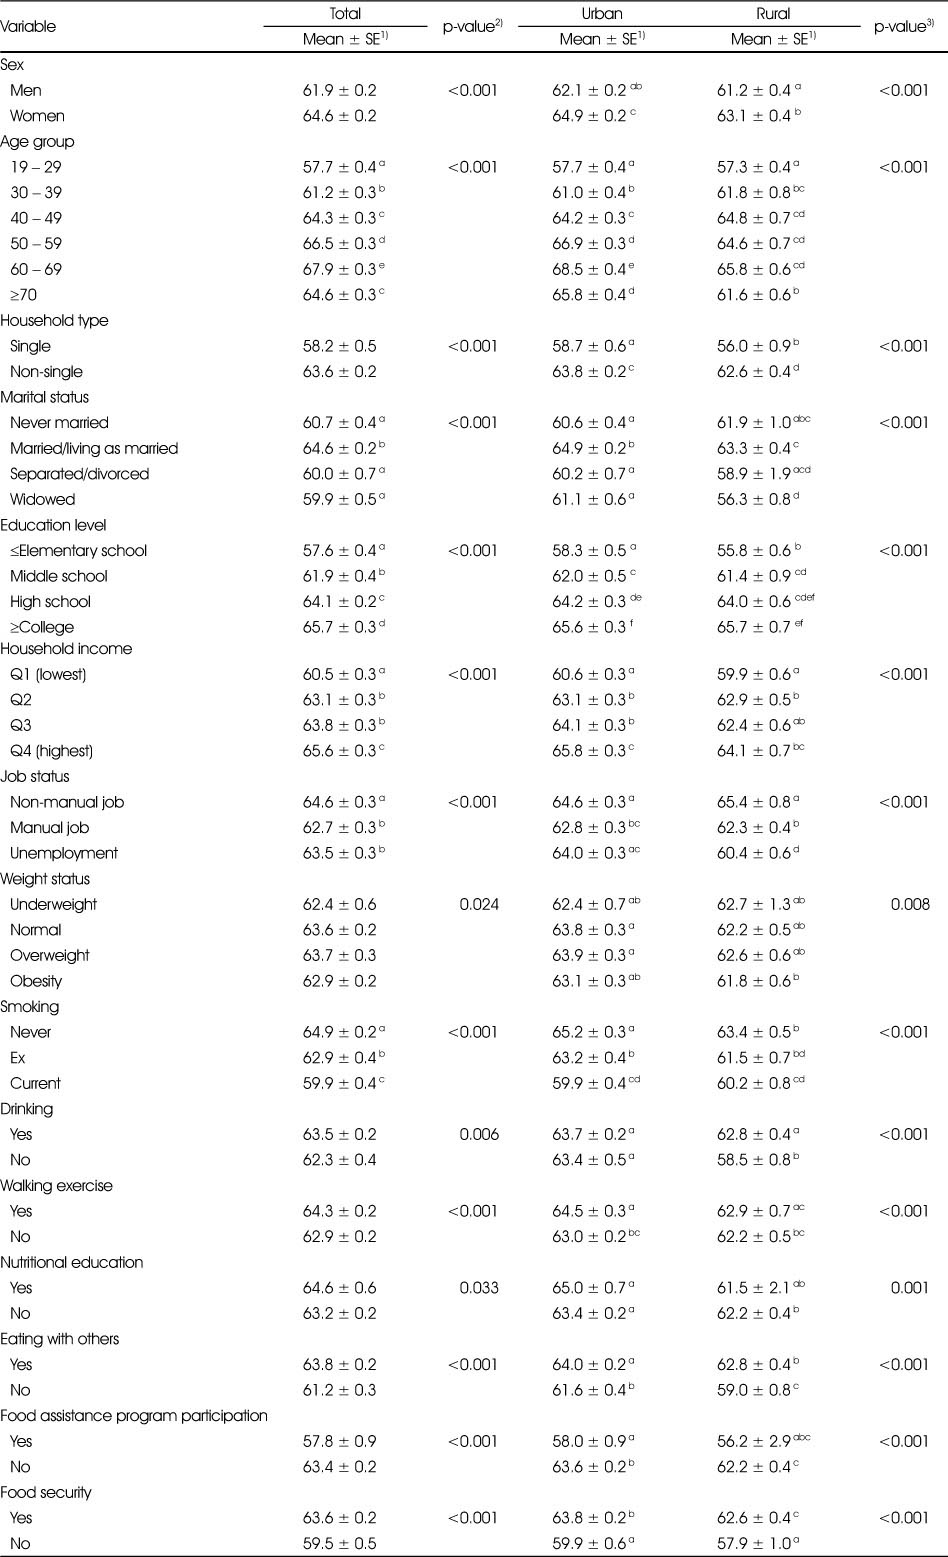
Mean value of KHEI total score by factors related to KHEI
KHEI, Korean Health Eating Index
All values were calculated by applying sampling weights assigned to individual participants in the nutrition survey.
1) Age- and sex-adjusted means ± SE
2) P-values for mean differences of KHEI total score by factors related to KHEI using multivariate linear regression after adjusting for age (continuous) and sex. Different alphabets indicate significant differences by Tukey's test.
3) P-values for mean differences of KHEI total score by area and factors related to KHEI using multivariate linear regression after adjusting for age (continuous) and sex. Different alphabets indicate significant differences by Tukey's test.
Table 5

Region effect on KHEI total score after adjusting for confounding factors by age group
KHEI, Korean Health Eating Index
All values were calculated by applying sampling weights assigned to individual participants in the nutrition survey.
1) Beta for rural area vs. urban
Model was adjusted for sex, household type, marital status, household income, education level, job status, weight status, smoking, alcohol drinking, walking exercise, nutritional education, eating with others, food assistance program participation, and food security.
Figure & Data
REFERENCES
Citations
Citations to this article as recorded by 
- Effects of senior-friendly foods on health, nutritional status, and dietary intake among rural elderly women in Korea: a quasi-experimental study
Sang-ju Lee, Ji-hyeon Kim, Jin-suk Han
Korean Journal of Community Nutrition.2026; 31(1): 101. CrossRef - Dietary habits of Koreans aged 95 years and older residing in rural and metropolitan areas
Jieun Mun, Sein Kim, Suyoung Kim, Seunghee Kim, Sang Chul Park, Jae-Young Han, Kwangsung Park, Clara Yongjoo Park
Nutrition Research and Practice.2025; 19(1): 66. CrossRef - Prediction model for identifying a high-risk group for food insecurity among elderly South Koreans
Myeunghee Han
Scientific Reports.2025;[Epub] CrossRef - Individual- and neighborhood-level factors influencing diet quality: a multilevel analysis using Korea National Health and Nutrition Examination Survey data, 2010-2019
Dahyun Park, Min-Jeong Shin, S V Subramanian, Clara Yongjoo Park, Rockli Kim
Epidemiology and Health.2025; 47: e2025043. CrossRef - Risk of all-cause mortality is associated with multiple health-related lifestyle behaviors and does not differ between urban and rural areas in Korea
Seunghee Kim, Clara Yongjoo Park
Nutrition Research and Practice.2024; 18(4): 554. CrossRef - Regional differences in protein intake and protein sources of Korean older adults and their association with metabolic syndrome using the 2016–2019 Korea National Health and Nutrition Examination Surveys: a cross-sectional study
You-Sin Lee, Yoonna Lee
Korean Journal of Community Nutrition.2024; 29(3): 173. CrossRef - Development and Validation of a Perceived Community Food Accessibility Measurement Questionnaire for Korean Older Adults
Jisoo Hong, Narae Yang, Kirang Kim
Nutrients.2023; 15(19): 4301. CrossRef - Improving the nutrition quotient and dietary self-efficacy through personalized goal setting and smartphone-based nutrition counseling among adults in their 20s and 30s
Dahyeon Kim, Dawon Park, Young-Hee Han, Taisun Hyun
Journal of Nutrition and Health.2023; 56(4): 419. CrossRef - Regional Difference in the Effect of Food Accessibility and Affordability on Vegetable and Fruit Acquisition and Healthy Eating Behaviors for Older Adults
Dong Eun Lee, Kirang Kim
International Journal of Environmental Research and Public Health.2022; 19(22): 14973. CrossRef - Regional Differences in Dietary Total Fat and Saturated Fatty Acid Intake and Their Associations with Metabolic Diseases among Korean Adults: Using the 2016~2019 Korea National Health and Nutrition Examination Surveys
SuJin Song, Jae Eun Shim
Korean Journal of Community Nutrition.2021; 26(6): 495. CrossRef - Basic Concepts and Detailed Dimensions of Food Security and Related Indicators for Policy Development and Evaluation
Sohyun Park, Ji-Yun Hwang, Jae Eun Shim, Kirang Kim
Korean Journal of Community Nutrition.2021; 26(6): 429. CrossRef
 Cite
CiteEffect of Geographic Area on Dietary Quality across Different Age Groups in Korea
Effect of Geographic Area on Dietary Quality across Different Age Groups in Korea
General characteristics of adults aged 19 years and older, 2013–2015 KNHANES
KNHANES, Korea National Health and Nutrition Examination Survey.
1) All % (SE) were calculated by applying sampling weights assigned to individual participants in the nutrition survey.
2) P-values for % differences between urban and rural area were calculated using the chi-square test
3) Including housewives or student
Mean value of each KHEI item by age group and region
KHEI, Korean Health Eating Index; SFA, saturated fatty acid; CHO, carbohydrate
All values were calculated by applying sampling weights assigned to individual participants in the nutrition survey.
1) Sex-adjusted means ± SE
2) Age- and sex-adjusted means ± SE
3) P-values for mean differences by age group and region were calculated using multivariate linear regression after adjusting for sex.
4) P-values for mean differences by age group and region were calculated using multivariate linear regression after adjusting for age (continuous) and sex.
Difference of mean value of each KHEI item between urban and rural area according to age group
KHEI, Korean Health Eating Index; SFA, saturated fatty acid; CHO, carbohydrate
All values were calculated by applying sampling weights assigned to individual participants in the nutrition survey.
1) Sex-adjusted means ± SE
2) P-values for mean differences between urban and rural area were calculated using multivariate linear regression after adjusting for sex.
Mean value of KHEI total score by factors related to KHEI
KHEI, Korean Health Eating Index
All values were calculated by applying sampling weights assigned to individual participants in the nutrition survey.
1) Age- and sex-adjusted means ± SE
2) P-values for mean differences of KHEI total score by factors related to KHEI using multivariate linear regression after adjusting for age (continuous) and sex. Different alphabets indicate significant differences by Tukey's test.
3) P-values for mean differences of KHEI total score by area and factors related to KHEI using multivariate linear regression after adjusting for age (continuous) and sex. Different alphabets indicate significant differences by Tukey's test.
Region effect on KHEI total score after adjusting for confounding factors by age group
KHEI, Korean Health Eating Index
All values were calculated by applying sampling weights assigned to individual participants in the nutrition survey.
1) Beta for rural area vs. urban
Model was adjusted for sex, household type, marital status, household income, education level, job status, weight status, smoking, alcohol drinking, walking exercise, nutritional education, eating with others, food assistance program participation, and food security.
Table 1
General characteristics of adults aged 19 years and older, 2013–2015 KNHANES
KNHANES, Korea National Health and Nutrition Examination Survey. 1) All % (SE) were calculated by applying sampling weights assigned to individual participants in the nutrition survey. 2) P-values for % differences between urban and rural area were calculated using the chi-square test 3) Including housewives or student
Table 2
Mean value of each KHEI item by age group and region
KHEI, Korean Health Eating Index; SFA, saturated fatty acid; CHO, carbohydrate All values were calculated by applying sampling weights assigned to individual participants in the nutrition survey. 1) Sex-adjusted means ± SE 2) Age- and sex-adjusted means ± SE 3) P-values for mean differences by age group and region were calculated using multivariate linear regression after adjusting for sex. 4) P-values for mean differences by age group and region were calculated using multivariate linear regression after adjusting for age (continuous) and sex.
Table 3
Difference of mean value of each KHEI item between urban and rural area according to age group
KHEI, Korean Health Eating Index; SFA, saturated fatty acid; CHO, carbohydrate All values were calculated by applying sampling weights assigned to individual participants in the nutrition survey. 1) Sex-adjusted means ± SE 2) P-values for mean differences between urban and rural area were calculated using multivariate linear regression after adjusting for sex.
Table 4
Mean value of KHEI total score by factors related to KHEI
KHEI, Korean Health Eating Index All values were calculated by applying sampling weights assigned to individual participants in the nutrition survey. 1) Age- and sex-adjusted means ± SE 2) P-values for mean differences of KHEI total score by factors related to KHEI using multivariate linear regression after adjusting for age (continuous) and sex. Different alphabets indicate significant differences by Tukey's test. 3) P-values for mean differences of KHEI total score by area and factors related to KHEI using multivariate linear regression after adjusting for age (continuous) and sex. Different alphabets indicate significant differences by Tukey's test.
Table 5
Region effect on KHEI total score after adjusting for confounding factors by age group
KHEI, Korean Health Eating Index All values were calculated by applying sampling weights assigned to individual participants in the nutrition survey. 1) Beta for rural area vs. urban Model was adjusted for sex, household type, marital status, household income, education level, job status, weight status, smoking, alcohol drinking, walking exercise, nutritional education, eating with others, food assistance program participation, and food security.


