Articles
- Page Path
- HOME > Korean J Community Nutr > Volume 24(6); 2019 > Article
-
Research Article
- Effect of Geographic Area on Dietary Quality across Different Age Groups in Korea
-
Hyun Ja Kim
 , Kirang Kim
-
Korean Journal of Community Nutrition 2019;24(6):453-464.
DOI: https://doi.org/10.5720/kjcn.2019.24.6.453
Published online: December 31, 2019
1Department of Food and Nutrition, Gangneung-Wonju National University, Gangneung, Korea, Professor.
2Department of Food Science and Nutrition, Dankook University, Cheonan, Korea, Professor.
- Corresponding author: Kirang Kim. Department of Food Science and Nutrition, Dankook University, 119, Dandae-ro, Dongnam-gu, Cheonan 31116, Korea. Tel: (041)550-3472, Fax: (041)559-7955, kirangkim@dankook.ac.kr
Copyright © 2019 The Korean Society of Community Nutrition
This is an Open-Access article distributed under the terms of the Creative Commons Attribution Non-Commercial License (http://creativecommons.org/licenses/by-nc/3.0/) which permits unrestricted non-commercial use, distribution, and reproduction in any medium, provided the original work is properly cited.
- 1,230 Views
- 6 Download
- 10 Crossref
Figure & Data
REFERENCES
Citations

- Dietary habits of Koreans aged 95 years and older residing in rural and metropolitan areas
Jieun Mun, Sein Kim, Suyoung Kim, Seunghee Kim, Sang Chul Park, Jae-Young Han, Kwangsung Park, Clara Yongjoo Park
Nutrition Research and Practice.2025; 19(1): 66. CrossRef - Prediction model for identifying a high-risk group for food insecurity among elderly South Koreans
Myeunghee Han
Scientific Reports.2025;[Epub] CrossRef - Individual- and neighborhood-level factors influencing diet quality: a multilevel analysis using Korea National Health and Nutrition Examination Survey data, 2010-2019
Dahyun Park, Min-Jeong Shin, S V Subramanian, Clara Yongjoo Park, Rockli Kim
Epidemiology and Health.2025; 47: e2025043. CrossRef - Risk of all-cause mortality is associated with multiple health-related lifestyle behaviors and does not differ between urban and rural areas in Korea
Seunghee Kim, Clara Yongjoo Park
Nutrition Research and Practice.2024; 18(4): 554. CrossRef - Regional differences in protein intake and protein sources of Korean older adults and their association with metabolic syndrome using the 2016–2019 Korea National Health and Nutrition Examination Surveys: a cross-sectional study
You-Sin Lee, Yoonna Lee
Korean Journal of Community Nutrition.2024; 29(3): 173. CrossRef - Development and Validation of a Perceived Community Food Accessibility Measurement Questionnaire for Korean Older Adults
Jisoo Hong, Narae Yang, Kirang Kim
Nutrients.2023; 15(19): 4301. CrossRef - Improving the nutrition quotient and dietary self-efficacy through personalized goal setting and smartphone-based nutrition counseling among adults in their 20s and 30s
Dahyeon Kim, Dawon Park, Young-Hee Han, Taisun Hyun
Journal of Nutrition and Health.2023; 56(4): 419. CrossRef - Regional Difference in the Effect of Food Accessibility and Affordability on Vegetable and Fruit Acquisition and Healthy Eating Behaviors for Older Adults
Dong Eun Lee, Kirang Kim
International Journal of Environmental Research and Public Health.2022; 19(22): 14973. CrossRef - Regional Differences in Dietary Total Fat and Saturated Fatty Acid Intake and Their Associations with Metabolic Diseases among Korean Adults: Using the 2016~2019 Korea National Health and Nutrition Examination Surveys
SuJin Song, Jae Eun Shim
Korean Journal of Community Nutrition.2021; 26(6): 495. CrossRef - Basic Concepts and Detailed Dimensions of Food Security and Related Indicators for Policy Development and Evaluation
Sohyun Park, Ji-Yun Hwang, Jae Eun Shim, Kirang Kim
Korean Journal of Community Nutrition.2021; 26(6): 429. CrossRef
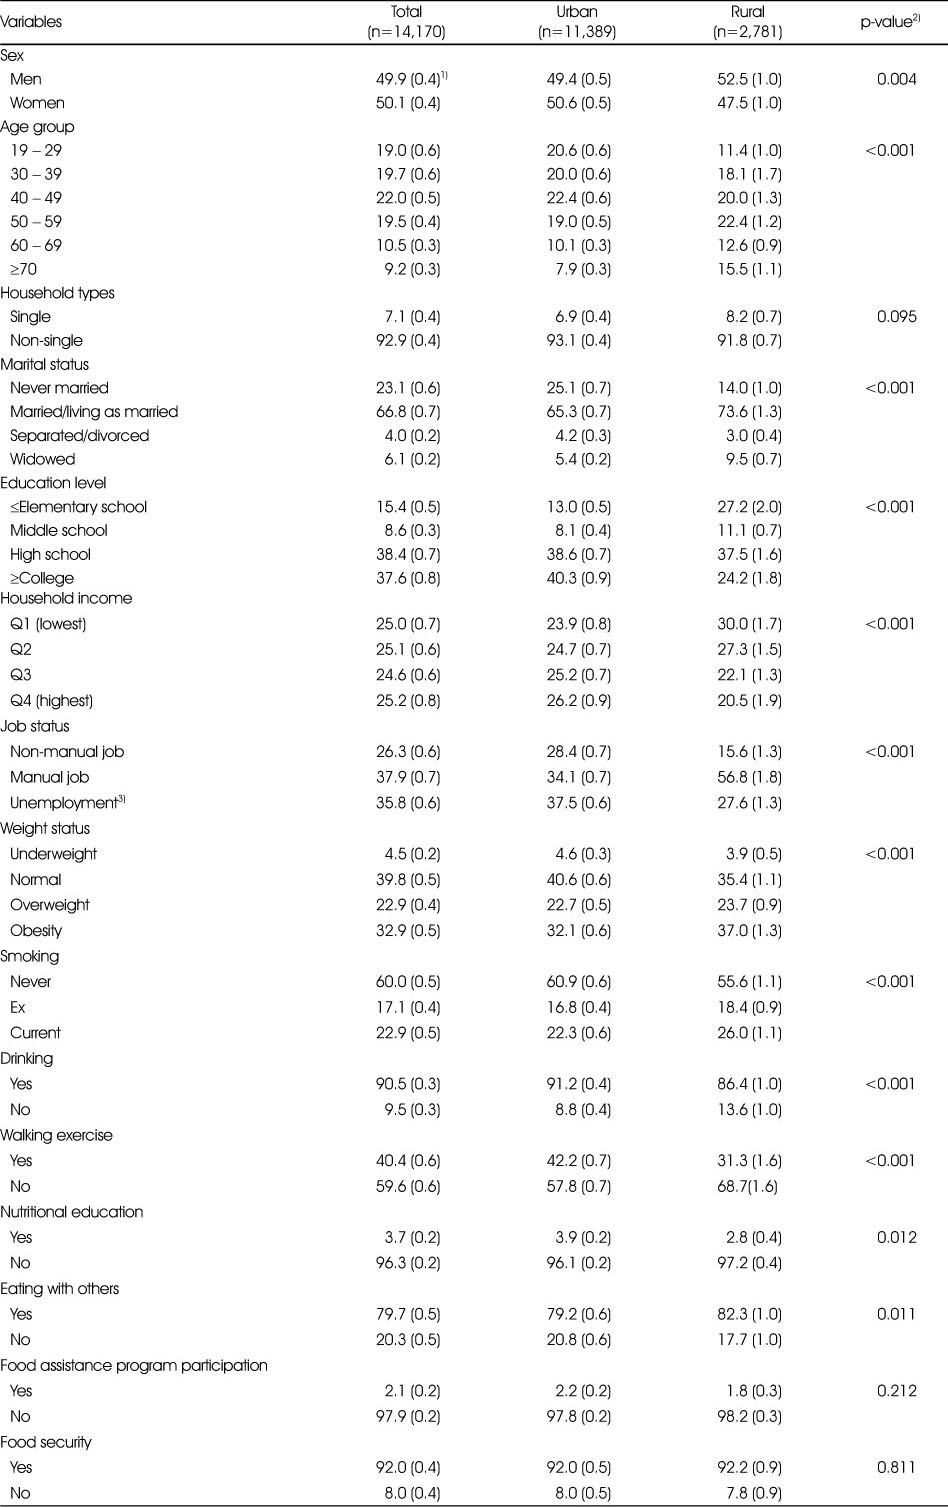
General characteristics of adults aged 19 years and older, 2013–2015 KNHANES
KNHANES, Korea National Health and Nutrition Examination Survey.
1) All % (SE) were calculated by applying sampling weights assigned to individual participants in the nutrition survey.
2) P-values for % differences between urban and rural area were calculated using the chi-square test
3) Including housewives or student
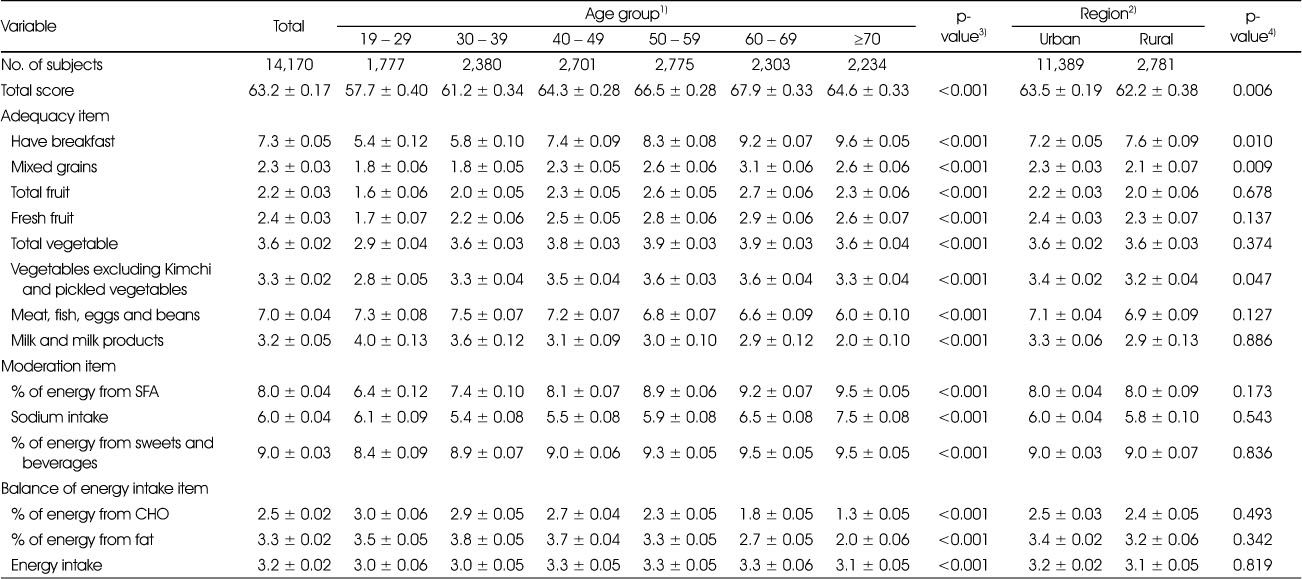
Mean value of each KHEI item by age group and region
KHEI, Korean Health Eating Index; SFA, saturated fatty acid; CHO, carbohydrate
All values were calculated by applying sampling weights assigned to individual participants in the nutrition survey.
1) Sex-adjusted means ± SE
2) Age- and sex-adjusted means ± SE
3) P-values for mean differences by age group and region were calculated using multivariate linear regression after adjusting for sex.
4) P-values for mean differences by age group and region were calculated using multivariate linear regression after adjusting for age (continuous) and sex.
Difference of mean value of each KHEI item between urban and rural area according to age group
KHEI, Korean Health Eating Index; SFA, saturated fatty acid; CHO, carbohydrate
All values were calculated by applying sampling weights assigned to individual participants in the nutrition survey.
1) Sex-adjusted means ± SE
2) P-values for mean differences between urban and rural area were calculated using multivariate linear regression after adjusting for sex.
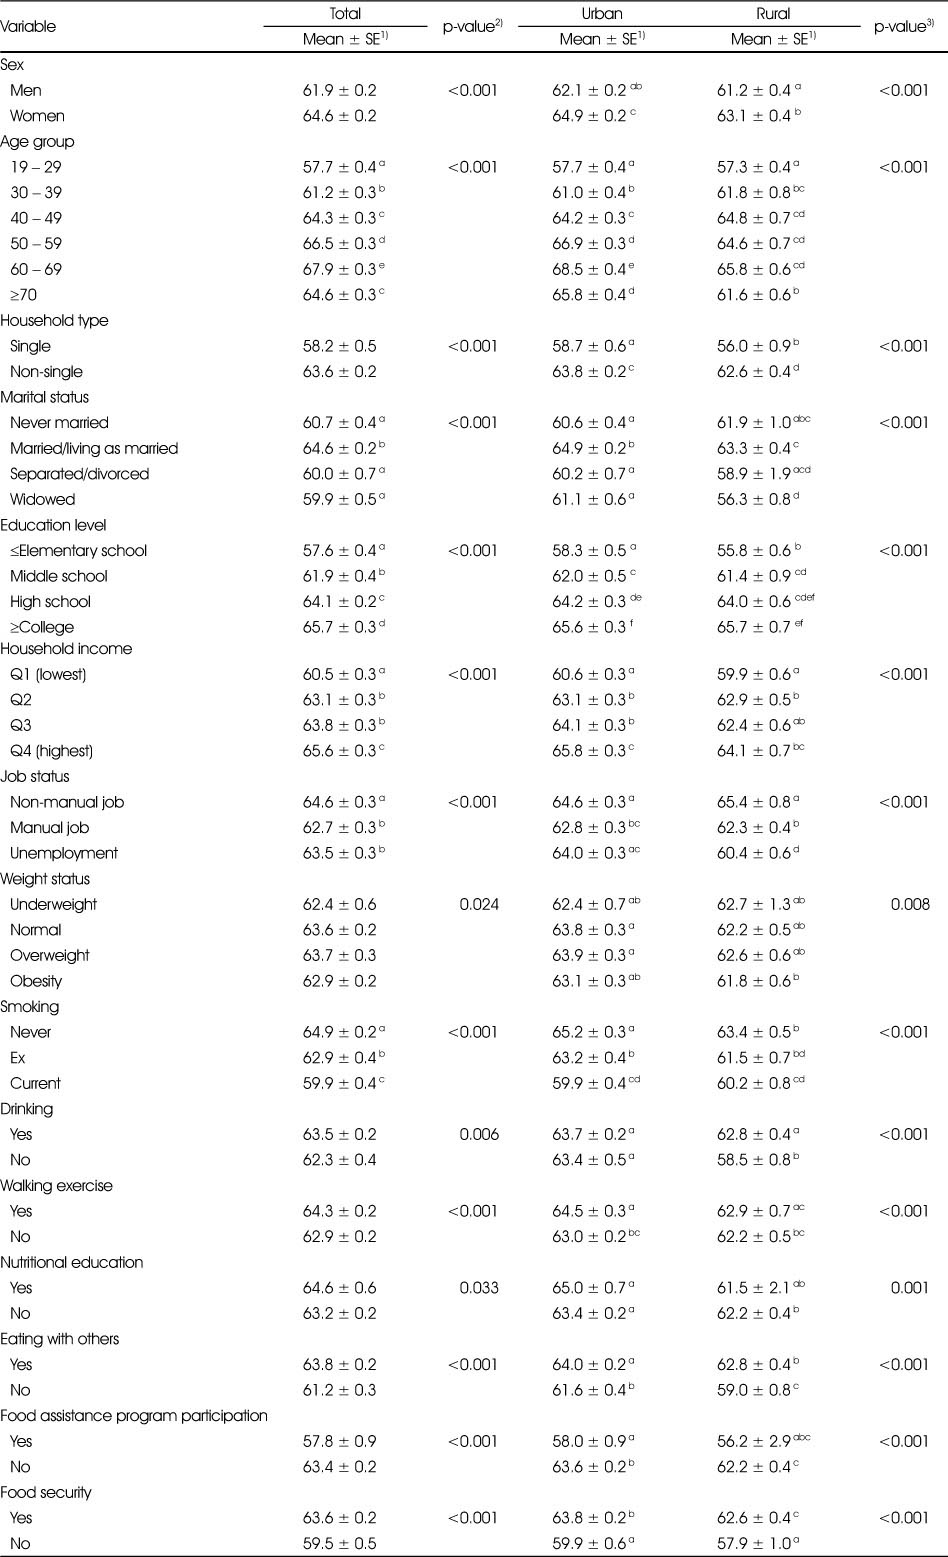
Mean value of KHEI total score by factors related to KHEI
KHEI, Korean Health Eating Index
All values were calculated by applying sampling weights assigned to individual participants in the nutrition survey.
1) Age- and sex-adjusted means ± SE
2) P-values for mean differences of KHEI total score by factors related to KHEI using multivariate linear regression after adjusting for age (continuous) and sex. Different alphabets indicate significant differences by Tukey's test.
3) P-values for mean differences of KHEI total score by area and factors related to KHEI using multivariate linear regression after adjusting for age (continuous) and sex. Different alphabets indicate significant differences by Tukey's test.
Region effect on KHEI total score after adjusting for confounding factors by age group
KHEI, Korean Health Eating Index
All values were calculated by applying sampling weights assigned to individual participants in the nutrition survey.
1) Beta for rural area vs. urban
Model was adjusted for sex, household type, marital status, household income, education level, job status, weight status, smoking, alcohol drinking, walking exercise, nutritional education, eating with others, food assistance program participation, and food security.
KNHANES, Korea National Health and Nutrition Examination Survey. 1) All % (SE) were calculated by applying sampling weights assigned to individual participants in the nutrition survey. 2) P-values for % differences between urban and rural area were calculated using the chi-square test 3) Including housewives or student
KHEI, Korean Health Eating Index; SFA, saturated fatty acid; CHO, carbohydrate All values were calculated by applying sampling weights assigned to individual participants in the nutrition survey. 1) Sex-adjusted means ± SE 2) Age- and sex-adjusted means ± SE 3) P-values for mean differences by age group and region were calculated using multivariate linear regression after adjusting for sex. 4) P-values for mean differences by age group and region were calculated using multivariate linear regression after adjusting for age (continuous) and sex.
KHEI, Korean Health Eating Index; SFA, saturated fatty acid; CHO, carbohydrate All values were calculated by applying sampling weights assigned to individual participants in the nutrition survey. 1) Sex-adjusted means ± SE 2) P-values for mean differences between urban and rural area were calculated using multivariate linear regression after adjusting for sex.
KHEI, Korean Health Eating Index All values were calculated by applying sampling weights assigned to individual participants in the nutrition survey. 1) Age- and sex-adjusted means ± SE 2) P-values for mean differences of KHEI total score by factors related to KHEI using multivariate linear regression after adjusting for age (continuous) and sex. Different alphabets indicate significant differences by Tukey's test. 3) P-values for mean differences of KHEI total score by area and factors related to KHEI using multivariate linear regression after adjusting for age (continuous) and sex. Different alphabets indicate significant differences by Tukey's test.
KHEI, Korean Health Eating Index All values were calculated by applying sampling weights assigned to individual participants in the nutrition survey. 1) Beta for rural area vs. urban Model was adjusted for sex, household type, marital status, household income, education level, job status, weight status, smoking, alcohol drinking, walking exercise, nutritional education, eating with others, food assistance program participation, and food security.

 KSCN
KSCN


 Cite
Cite


