
Articles
- Page Path
- HOME > Korean J Community Nutr > Volume 21(2); 2016 > Article
-
Research Article
- A Study on the Body Composition, Physical Activity Level, Basal Metabolic Rate, and Daily Energy Expenditure of Elderly in Busan
-
Hwa-Jae Lim

-
Korean Journal of Community Nutrition 2016;21(2):178-189.
DOI: https://doi.org/10.5720/kjcn.2016.21.2.178
Published online: April 30, 2016
Department of Food and Nutrition, Dong-eui University, Busan, Korea.
- Corresponding author: Hwa-Jae Lim. Department of Food and Nutrition, Dong-eui University, 176 Eomgwangno, Busanjin-gu, Busan, 47340, Korea. Tel: (051) 890-1593, Fax: (051) 890-2646, hjlim@deu.ac.kr
• Received: February 26, 2016 • Revised: April 21, 2016 • Accepted: April 21, 2016
Copyright © 2016 The Korean Society of Community Nutrition
This is an Open-Access article distributed under the terms of the Creative Commons Attribution Non-Commercial License (http://creativecommons.org/licenses/by-nc/3.0/) which permits unrestricted non-commercial use, distribution, and reproduction in any medium, provided the original work is properly cited.
- 2,383 Views
- 4 Download
- 2 Crossref
Abstract
-
Objectives
- The objectives of the study were to assess body composition, physical activity level (PAL), basal metabolic rate (BMR), and daily energy expenditure (DEE) and to examine associations between PAL and body composition, BMR, and DEE of elderly in Busan.
-
Methods
- A cross-sectional study was conducted among 226 elderly aged 65-93 years. Body composition was measured by Inbody 720. PAL was calculated by daily activity diary. BMR was calculated by Harris-Benedict (H-B) formula, Dietary Reference Intakes (DRI) formula, and Inbody 720 measurement. DEE was calculated by H-B formula, DRI formula, Inbody 720 measurement, and estimated energy requirements (EER) formula.
-
Results
- The mean fat free mass (FFM) in elderly men was significantly higher than that in elderly women (p<0.001). The mean percent body fat and fat mass (FM) in elderly women were significantly greater than those in elderly men (p<0.001, p<0.001). The mean PAL in elderly men (1.59) was significantly higher than that in elderly women (1.53) (p<0.001). The mean DEEs calculated by 3 methods except for H-B formula in elderly men were higher than EER for elderly men (2000kcal). The mean DEEs calculated by 4 different methods in elderly women were higher than EER for elderly women (1600kcal). Age showed significantly negative correlations with height (p<0.001, p<0.001), FFM (p<0.001, p<0.001), BMRs calculated by H-B formula (p<0.001, p<0.001), DRI formula (p<0.001, p<0.001) and Inbody 720 measurement (p<0.05 p<0.01) and DEEs calculated by H-B formula (p<0.001, p<0.001), DRI formula (p<0.001, p<0.001), Inbody 720 measurement (p<0.05, p<0.05), and EER formula (p<0.001, p<0.001) in elderly men and elderly women. PAL showed significantly positive correlations with FFM (p<0.05), BMR by Inbody 720 measurement (p<0.05) in elderly men and negative correlations with FM (p<0.05) in elderly women.
-
Conclusions
- Based on the results, PAL was associated with greater FFM in elderly men and lesser FM in elderly women. Therefore, nutritional education to increase physical activity for health promotion in late life is needed in the elderly.
- 1. Statistics Korea. Socio-Statistical Survey [internet]. 2015; cited 2015 dec 28]. Available from: https://kostat.go.kr/portal/korea/index.action.
- 2. Xue QL. The frailty syndrome: definition and natural history. Clin Geriatr Med 2011; 27(1): 1-15.ArticlePubMedPMC
- 3. Wolf SL, Barnhart HX, Kutner NG, McNeely E, Coogler C, Xu T. Reducing frailty and falls in older persons: an investigation of Tai Chi and computerized balance training. J Am Geriatr Soc 1996; 44(5): 489-497.ArticlePubMed
- 4. Broadwin J, Goodman-Gruen D, Slymen D. Ability of fat and fat-free mass percentages to predict functional disability in older men and women. J Am Geriatr Soc 2001; 49(12): 1641-1645.ArticlePubMed
- 5. Cheng Q, Zhu YX, Zhang MX, Li LH, Du PY, Zhu MH. Age and sex effects on the association between body composition and bone mineral density in healthy Chinese men and women. Menopause 2012; 19(4): 448-455.ArticlePubMed
- 6. Graf CE, Karsegard VL, Spoerri A, Makhlouf AM, Ho S, Herrmann FR, et al. Body composition and all-cause mortality in subjects older than 65y. Am J Clin Nutr 2015; 101(4): 760-767.ArticlePubMed
- 7. Shephard RJ. Physical fitness: Exercise and ageing. New York: John Wiley and Sons Ltd.; 1991. p. 279-294.
- 8. Lang LA, Guralnik JM, Melzer D. Physical activity in middleaged adults reduces risks of functional impairment independent of its effect on weight. J Am Geriatr Soc 2007; 55(11): 1836-1841.ArticlePubMed
- 9. Kwak CS, Yon MY, Lee MS, Oh SI, Park SC. Investigation of influencing environmental factors on health status of Korean septuagenarians dwelling in longevity region in Jeonla province. Korean J Community Nutr 2014; 19(2): 142-162.Article
- 10. Park JA, Kim KJ, Kim JH, Park YS, Koo JO, Yoon JS. A comparison of the resting energy expenditure of Korean adults using indirect calorimetry. Korean J Community Nutr 2003; 8(6): 993-1000.
- 11. Chang UJ, Lee KR. Correlation between measured resting energy expenditure and predicted based energy expenditure in female college students. J Korean Soc Food Sci Nutr 2005; 34(2): 196-201.
- 12. Choi HJ, Song JM, Kim EK. Assessment of daily steps, activity coefficient, body composition, resting energy expenditure and daily energy expenditure in female university students. J Korean Diet Assoc 2005; 11(2): 159-169.
- 13. Park Y, Kim JH. Assessment of physical activity pattern, activity coefficient, basal metabolic rate and daily energy expenditure in female university students. Korean J Community Nutr 2013; 18(1): 45-54.Article
- 14. Kim EK, Lee SH, Ko SY, Yeon SE, Choe JS. Assessment of physical activity level of Korean farmers to establish estimated energy requirements during busy farming season. Korean J Community Nutr 2011; 16(6): 751-761.Article
- 15. Lee SH, Yeon SE, Son HR, Choi JS, Kim EK. Assessment of energy intake and physical activity level for Korean farmers to establish estimated energy requirements during the off-season for farmers. Korean J Community Nutr 2012; 17(5): 652-663.Article
- 16. The Korean Nutrition Society. Dietary reference intakes for Koreans. 1st revision. Seoul: The Korean Nutrition Society; 2010. p. 17-46.
- 17. Harris JA, Benedict FG. A biometric study of basal metabolism in men. Washington DC: Nabu Press; 1919.
- 18. Institute of Medicine. Dietary reference intakes for energy, carbohydrate, fiber, fat, fatty acids, cholesterol, protein and amino acids. The National Academies Press; 2002.
- 19. Cunningham JJ. Body composition as a determinant of energy expenditure: a synthetic review and a proposed general prediction equation. Am J Clin Nutr 1991; 54(6): 963-969.ArticlePubMed
- 20. Ministry of Health and Welfare(MOHW). Centers for Disease Control and Prevention(CDC). Korean National Health & Nutrition Examination Survey(KHANES) 2012 [internet]. 2013; cited 2015 Dec 28]. Available from: https://knhanes.cdc.go.kr/knhanes/index.do.
- 21. Lim S, Joung H, Shin CS, Lee HK, Kim KS, Shin EK, et al. Body composition changes with age have gender-specific impacts on bone mineral density. Bone 2004; 35(3): 792-798.ArticlePubMed
- 22. Koo JO, Park SY. Analysis of body composition, dietary behaviors and life style of 30-50year old women living in Seoul. Korean J Community Nutr 2012; 17(4): 440-449.Article
- 23. Kim Y, Na HJ. The estimation of the daily energy expenditure of Korean adolescents. Korean J Community Nutr 2003; 8(3): 270-279.
- 24. Bjorntorp PA. Sex differences in the regulation of energy balance with exercise. Am J Clin Nutr 1989; 49(5): 958-961.ArticlePubMed
- 25. Cunningham JJ. Body composition and resting metabolic rate: the myth of feminine metabolism. Am J Clin Nutr 1982; 36(4): 721-726.ArticlePubMed
- 26. Speakman JR, Westerterp KR. Association between energy demands, physical activity, and body composition in adult humans between 18 and 96 y of age. Am J Clin Nutr 2010; 92(4): 826-834.PubMed
- 27. Fukagawa NK, Bandini LG, Young JB. Effect of age on body composition and resting metabolic rate. Am J Physiol Endocrinol Metab 1990; 259(2): E233-E238.Article
- 28. Keys A, Taylor HL, Grande F. Basal metabolism and age of adult man. Metabolism 1973; 22(4): 579-587.ArticlePubMed
- 29. Hughes VA, Frontera WR, Roubenoff R, Evans WJ, Singh MA. Longitudinal changes in body composition in older men and women: role of body weight change and physical activity. Am J Clin Nutr 2002; 76(2): 473-481.ArticlePubMed
- 30. Dziura J, de Leon CM, Kasl S, DiPietro L. Can physical activity attenuate aging-related weight loss in older people? The Yale Health and Aging Study, 1982-1994. Am J Epidemiol 2004; 159(8): 759-767.ArticlePubMed
- 31. Hunter GR, Wetzstein CJ, Fields DA, Brown A, Bamman MM. Resistance training increases total energy expenditure and freeliving physical activity in older adults. J Appl Physiol 2000; 89(3): 977-984.ArticlePubMed
- 32. Puggaard L, Larsen JB, Ebbesen E, Jeune B. Body composition in 85 year-old women: effects of increased physical activity. Aging Clin Exp Res 1999; 11(5): 307-315.ArticlePDF
- 33. Manini TM, Everhart JE, Anton SD, Schoeller DA, Cummings SR, Mackey DC, et al. Activity energy expenditure and change in body composition in late life. Am J Clin Nutr 2009; 90(5): 1336-1342.ArticlePubMedPMC
- 34. Goodpaster BH, Chomentowski P, Ward BK, Rossi A, Glynn NW, Delmonico MJ, et al. Effects of physical activity on strength and skeletal muscle fat infiltration in older adults: a randomized controlled trial. J Appl Physiol 2008; 105(5): 1498-1503.ArticlePubMedPMC
REFERENCES
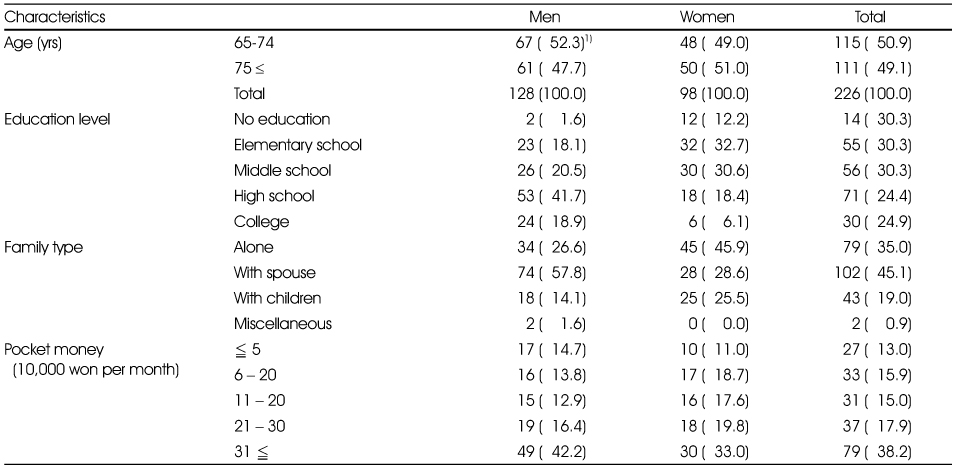
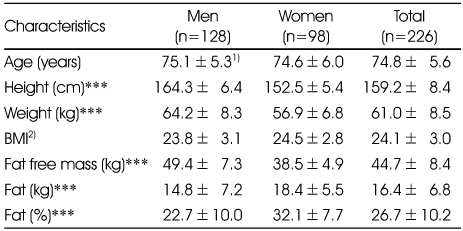

Table 4

Basal metabolic rate and total energy expenditure calculated by different methods
1) Harris-Benedict formula (H-B formula) BMR : Men : 66.4 + 13.7 × weight (kg) + 5 × height (cm) − 6.8 × age
Women : 655 + 9.6 × weight (kg) + 1.8 × height (cm) − 4.7 × age
2) Formula in DRI for Koreans (1st revision, 2010) BMR : Men : 204 – 4.0 × age + 450.5 × height (cm) + 11.69 × weight (kg)
Women : 255 – 2.35 × age + 361.6 × height (cm) + 9.39 × weight (kg)
3) Inbody 720 BMR : 370 + LBM × 21.6
4) EER (Estimated energy requirements) : Men : 662 – 9.53 × age + PA × 15.91 × weight (kg) + 539.6 × height (cm)
PA=1.0 (sedentary), 1.11 (low active), 1.25 (active), 1.48 (very active)
Women : 354 – 6.91 × age + PA × 9.36 × Weight (kg) + 726 × Height (cm)
PA=1.0 (sedentary), 1.12 (low active), 1.27 (active), 1.45 (very active)
5) Mean±SD
6) TEE (Total energy expenditure) : BMR (calculated by H-B formula, DRI formula, Inbody 720) × physical activity level
***: p<0.001 significantly different by t-test
abcd: Significantly different at p<0.001 by repeated measure ANOVA test
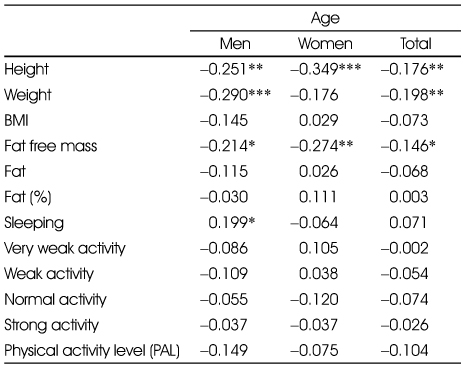
Table 6

Correlation coefficients between age and basal metabolic rate and total energy expenditure calculated by different methods
Table 7

Correlation coefficients between physical activity level and anthropometric data and physical activity patterns
Table 8
Correlation coefficients between physical activity level and basal metabolic rate and total energy expenditure calculated by different methods
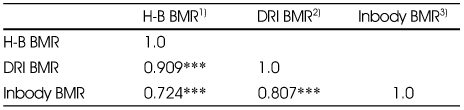
Table 10

Correlation coefficients among different methods of total energy expenditure
1) H-B TEE (Total energy expenditure) : basal metabolic rate calculated by Harris-Benedict formula × physical activity level
2) DRI TEE : basal metabolic rate calculated by DRI formula × physical activity level
3) Inbody TEE : basal metabolic rate measured by Inbody 720 × physical activity level
***: p<0.001
Figure & Data
REFERENCES
Citations
Citations to this article as recorded by 
- Effects of a Yoga Program Combined with a Mediterranean Diet on Nutritional Status and Functional Capacity in Community-Dwelling Older Adults: A Randomized Controlled Clinical Trial
María del Carmen Carcelén-Fraile, María Rosalba Martín-Baute, María Isabel Ledesma-Cerrato, Yolanda Castellote-Caballero, Ana María González-Martín, Fidel Hita-Contreras, Javier Cano-Sánchez, Agustín Aibar-Almazán
Nutrients.2024; 16(11): 1601. CrossRef - The Effects of Aquatic Group Exercise on Body Composition and Mental Health of Elderly Women
Hae-An Ok
Journal of The Korean Society of Physical Medicine.2017; 12(1): 103. CrossRef
 Cite
CiteA Study on the Body Composition, Physical Activity Level, Basal Metabolic Rate, and Daily Energy Expenditure of Elderly in Busan
A Study on the Body Composition, Physical Activity Level, Basal Metabolic Rate, and Daily Energy Expenditure of Elderly in Busan
General characteristics of the study subjects by gender
1) N (%)
Anthropometric data of the study subjects by gender
1) Mean±SD
2) BMI=weight (kg) / height2 (m2)
***: p<0.001 significantly different by t-test
Expending time by 5 activity levels and physical activity level
1) Mean±SD, values are min per day
2) (%)
*: p<0.05, **: p<0.01, ***: p<0.001 significantly different respectively by t-test
Basal metabolic rate and total energy expenditure calculated by different methods
1) Harris-Benedict formula (H-B formula) BMR : Men : 66.4 + 13.7 × weight (kg) + 5 × height (cm) − 6.8 × age
Women : 655 + 9.6 × weight (kg) + 1.8 × height (cm) − 4.7 × age
2) Formula in DRI for Koreans (1st revision, 2010) BMR : Men : 204 – 4.0 × age + 450.5 × height (cm) + 11.69 × weight (kg)
Women : 255 – 2.35 × age + 361.6 × height (cm) + 9.39 × weight (kg)
3) Inbody 720 BMR : 370 + LBM × 21.6
4) EER (Estimated energy requirements) : Men : 662 – 9.53 × age + PA × 15.91 × weight (kg) + 539.6 × height (cm)
PA=1.0 (sedentary), 1.11 (low active), 1.25 (active), 1.48 (very active)
Women : 354 – 6.91 × age + PA × 9.36 × Weight (kg) + 726 × Height (cm)
PA=1.0 (sedentary), 1.12 (low active), 1.27 (active), 1.45 (very active)
5) Mean±SD
6) TEE (Total energy expenditure) : BMR (calculated by H-B formula, DRI formula, Inbody 720) × physical activity level
***: p<0.001 significantly different by t-test
abcd: Significantly different at p<0.001 by repeated measure ANOVA test
Correlation coefficients between age and anthropometric data and physical activity patterns
*: p<0.05, **: p<0.01, ***: p<0.001
Correlation coefficients between age and basal metabolic rate and total energy expenditure calculated by different methods
1) EER : Estimated energy requirements
*: p<0.05, **: p<0.01, ***: p<0.001
Correlation coefficients between physical activity level and anthropometric data and physical activity patterns
*: p<0.05, **: p<0.01, ***: p<0.001
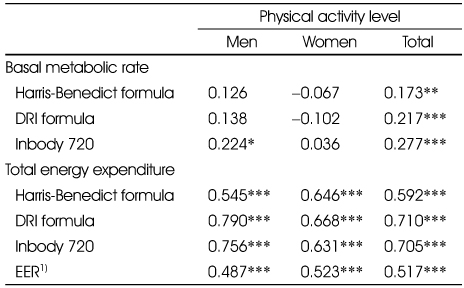
Correlation coefficients between physical activity level and basal metabolic rate and total energy expenditure calculated by different methods
1) EER : Estimated energy requirements
*: p<0.05, **: p<0.01, ***: p<0.001
Correlation coefficients among different methods of the basal metabolic rate
1) H-B BMR : basal metabolic rate calculated by Harris-Benedict formula
2) DRI BMR : basal metabolic rate calculated by DRI formula
3) Inbody BMR : basal metabolic rate measured by Inbody 720
***: p<0.001
Correlation coefficients among different methods of total energy expenditure
1) H-B TEE (Total energy expenditure) : basal metabolic rate calculated by Harris-Benedict formula × physical activity level
2) DRI TEE : basal metabolic rate calculated by DRI formula × physical activity level
3) Inbody TEE : basal metabolic rate measured by Inbody 720 × physical activity level
***: p<0.001
Table 1
General characteristics of the study subjects by gender
1) N (%)
Table 2
Anthropometric data of the study subjects by gender
1) Mean±SD 2) BMI=weight (kg) / height2 (m2) ***: p<0.001 significantly different by t-test
Table 3
Expending time by 5 activity levels and physical activity level
1) Mean±SD, values are min per day 2) (%) *: p<0.05, **: p<0.01, ***: p<0.001 significantly different respectively by t-test
Table 4
Basal metabolic rate and total energy expenditure calculated by different methods
1) Harris-Benedict formula (H-B formula) BMR : Men : 66.4 + 13.7 × weight (kg) + 5 × height (cm) − 6.8 × age Women : 655 + 9.6 × weight (kg) + 1.8 × height (cm) − 4.7 × age 2) Formula in DRI for Koreans (1st revision, 2010) BMR : Men : 204 – 4.0 × age + 450.5 × height (cm) + 11.69 × weight (kg) Women : 255 – 2.35 × age + 361.6 × height (cm) + 9.39 × weight (kg) 3) Inbody 720 BMR : 370 + LBM × 21.6 4) EER (Estimated energy requirements) : Men : 662 – 9.53 × age + PA × 15.91 × weight (kg) + 539.6 × height (cm) PA=1.0 (sedentary), 1.11 (low active), 1.25 (active), 1.48 (very active) Women : 354 – 6.91 × age + PA × 9.36 × Weight (kg) + 726 × Height (cm) PA=1.0 (sedentary), 1.12 (low active), 1.27 (active), 1.45 (very active) 5) Mean±SD 6) TEE (Total energy expenditure) : BMR (calculated by H-B formula, DRI formula, Inbody 720) × physical activity level ***: p<0.001 significantly different by t-test abcd: Significantly different at p<0.001 by repeated measure ANOVA test
Table 5
Correlation coefficients between age and anthropometric data and physical activity patterns
*: p<0.05, **: p<0.01, ***: p<0.001
Table 6
Correlation coefficients between age and basal metabolic rate and total energy expenditure calculated by different methods
1) EER : Estimated energy requirements *: p<0.05, **: p<0.01, ***: p<0.001
Table 7
Correlation coefficients between physical activity level and anthropometric data and physical activity patterns
*: p<0.05, **: p<0.01, ***: p<0.001
Table 8
Correlation coefficients between physical activity level and basal metabolic rate and total energy expenditure calculated by different methods
1) EER : Estimated energy requirements *: p<0.05, **: p<0.01, ***: p<0.001
Table 9
Correlation coefficients among different methods of the basal metabolic rate
1) H-B BMR : basal metabolic rate calculated by Harris-Benedict formula 2) DRI BMR : basal metabolic rate calculated by DRI formula 3) Inbody BMR : basal metabolic rate measured by Inbody 720 ***: p<0.001
Table 10
Correlation coefficients among different methods of total energy expenditure
1) H-B TEE (Total energy expenditure) : basal metabolic rate calculated by Harris-Benedict formula × physical activity level 2) DRI TEE : basal metabolic rate calculated by DRI formula × physical activity level 3) Inbody TEE : basal metabolic rate measured by Inbody 720 × physical activity level ***: p<0.001


