
Articles
- Page Path
- HOME > Korean J Community Nutr > Volume 22(2); 2017 > Article
-
Research Article
- Distribution and Exposure Prevalence of Carbohydrate-based Food Intake among Obese Korean Adults Based on the Health Examinees (HEXA) Study
-
Yuri Han, Sung-Ok Kwon, Sang-Ah Lee

-
Korean Journal of Community Nutrition 2017;22(2):159-170.
DOI: https://doi.org/10.5720/kjcn.2017.22.2.159
Published online: April 30, 2017
Department of Preventive Medicine, Kangwon National University School of Medicine, Gangwon-do, Korea.
- Corresponding author: Sang-Ah Lee. Department of Preventive Medicine, Kangwon National University School of Medicine, 1, Gangwondaehak-gil, Gangwon-do, 24341, Korea. Tel: (033) 250-8871, sangahlee@kangwon.ac.kr
• Received: April 19, 2017 • Revised: April 24, 2017 • Accepted: April 24, 2017
Copyright © 2017 The Korean Society of Community Nutrition
This is an Open-Access article distributed under the terms of the Creative Commons Attribution Non-Commercial License (http://creativecommons.org/licenses/by-nc/3.0/) which permits unrestricted non-commercial use, distribution, and reproduction in any medium, provided the original work is properly cited.
- 1,831 Views
- 4 Download
- 5 Crossref
Abstract
-
Objectives
- The purpose of this study was to estimate the distribution and exposure prevalence of total carbohydrate intake and the carbohydrate-based foods such as rice, noodles, sweet potatoes, sweet drinks, milk and fruits and to characterize intake patterns among obese Korean adults.
-
Methods
- Subjects included 137,363 adults aged 40 years or older who participated in a Health Examinees (HEXA) Study. Multiple regression analysis of data from Semi-Quantitative Food Frequency Questionnaire (SQFFQ) identified food sources of carbohydrates. Weight, height and waist circumstance (WC) were measured, and the body mass index (BMI) was calculated. Obesity was defined as BMI ≥ 25 kg/m2 and abdominal obesity as WC ≥ 90 cm and ≥ 85 cm for males and females, respectively.
-
Results
- Obese adults appeared to have a higher total carbohydrate intake in the univariate analysis but had eaten less after adjustment for general and lifestyle factors, compared to normal weight adults (OR 0.78, 95% CI 0.73-0.82 for general obesity; OR 0.79, 95% CI 0.74-0.85, for abdominal obesity; P trend < 0.0001, respectively). Based on advance analysis for the food sources of carbohydrates, obese subjects had lower intake of rice (OR 0.86, 95% CI 0.68 -1.09 for general obesity; OR 0.87, 95% CI 0.67-1.13, for abdominal obesity; P trend < 0.0001, respectively) and higher intake of noodles (OR 1.21, 95% CI 1.16-1.27 for general obesity; OR 1.25, 95% CI 1.19-1.32, for abdominal obesity; P trend < 0.0001 respectively). With regard to other food sources of carbohydrates such as milk and fruits, intake was lower among obese compared to normal weight subjects.
-
Conclusions
- In the Korean middle-aged and older obesity groups, the intake of carbohydrates and the related foods was lower than in normal weight subjects, except for noodles. We conclude that a higher intake of noodles may enhance weight-gain. Therefore, this study suggested that the guidelines should consider the types of carbohydrate sources and the amount consumed from foods in order to provide proper guidance with regard to control and prevent obesity among Korean adults.
- 1. Balakumar P, Maung-U K, Jagadeesh G. Prevalence and prevention of cardiovascular disease and diabetes mellitus. Pharmacol Res 2016; 113(Pt A): 600-609.ArticlePubMed
- 2. Flegal KM, Kit BK, Orpana H, Graubard BI. Association of all-cause mortality with overweight and obesity using standard body mass index categories: A systematic review and meta-analysis. JAMA 2013; 309(1): 71-82.ArticlePubMedPMC
- 3. Carmienke S, Freitag MH, Pischon T, Schlattmann P, Fankhaenel T, Goebel H. General and abdominal obesity parameters and their combination in relation to mortality: a systematic review and meta-regression analysis. Eur J Clin Nutr 2013; 67(6): 573-585.ArticlePubMedPDF
- 4. World Health Organization. GLOBAL STATUS REPORT ON NONCOMMUNICABLE DISEASES 2014 [Internet]. World Health Organization; 2014; cited 2017 Apr 1]. Available from: http://www.who.int/nmh/publications/ncd-status-report-2014/en/.
- 5. World Health Organization. Obesity and Overweight [Internet]. World Health Organization; 2016; cited 2017 Apr 4]. Available from: http://www.who.int/mediacentre/factsheets/fs311/en/.
- 6. Korea Centers for Disease Control and Prevention. Korea Health Statistics 2015. Korea Centers for Disease Control and Prevention; 2015; cited 2017 Mar 31]. Available from: https://knhanes.cdc.go.kr/knhanes/index.do.
- 7. Nguyen DM, El-Serag HB. The epidemiology of obesity. Gastroenterol Clin North Am 2010; 39(1): 1-7.ArticlePubMedPMC
- 8. Mozaffarian D, Hao T, Rimm EB, Willett WC, Hu FB. Changes in diet and lifestyle and long-term weight gain in women and men. N Engl J Med 2011; 364(25): 2392-2404.ArticlePubMedPMC
- 9. Fogelholm M, Anderssen S, Gunnarsdottir I, Lahti-Koski M. Dietary macronutrients and food consumption as determinants of long-term weight change in adult populations: a systematic literature review. Food Nutr Res 2012; 56: 1-45.Article
- 10. Cohen E, Cragg M, deFonseka J, Hite A, Rosenberg M, Zhou B. Statistical review of US macronutrient consumption data, 1965-2011: Americans have been following dietary guidelines, coincident with the rise in obesity. Nutrition 2015; 31(5): 727-732.ArticlePubMed
- 11. Murakami K, McCaffrey TA, Livingstone MB. Associations of dietary glycaemic index and glycaemic load with food and nutrient intake and general and central obesity in British adults. Br J Nutr 2013; 110(11): 2047-2057.ArticlePubMed
- 12. Aller EE, Abete I, Astrup A, Martinez JA, van Baak MA. Starches, sugars and obesity. Nutrients 2011; 3(3): 341-369.ArticlePubMedPMC
- 13. Youn S, Woo HD, Cho YA, Shin A, Chang N, Kim J. Association between dietary carbohydrate, glycemic index, glycemic load, and the prevalence of obesity in Korean men and women. Nutr Res 2012; 32(3): 153-159.ArticlePubMed
- 14. Ahn Y, Kwon E, Shim JE, Park MK, Joo Y, Kimm K. Validation and reproducibility of food frequency questionnaire for Korean genome epidemiologic study. Eur J Clin Nutr 2007; 61(12): 1435-1441.ArticlePubMedPDF
- 15. Kim JH, Lee JE, Jung IK. Dietary pattern classifications and the association with general obesity and abdominal obesity in Korean women. J Acad Nutr Diet 2012; 112(10): 1550-1559.ArticlePubMed
- 16. Serra-Majem L, Bautista-Castaño I. Relationship between bread and obesity. Br J Nutr 2015; 113(S2): S29-S35.ArticlePubMed
- 17. McKeown NM, Troy LM, Jacques PF, Hoffmann U, O'Donnell CJ, Fox CS. Whole-and refined-grain intakes are differentially associated with abdominal visceral and subcutaneous adiposity in healthy adults: the Framingham Heart Study. Am J Clin Nutr 2010; 92(5): 1165-1171.ArticlePubMedPMC
- 18. Pauline KB, Rimm EB. Whole grain consumption and weight gain: a review of the epidemiological evidence, potential mechanisms and opportunities for future research. Proc Nutr Soc 2003; 62(1): 25-29.ArticlePubMed
- 19. Atkinson FS, Foster-Powell K, Brand-Miller JC. International tables of glycemic index and glycemic load values: 2008. Diabetes Care 2008; 31(12): 2281-2283.ArticlePubMedPMCPDF
- 20. Radhika G, Van Dam RM, Sudha V, Ganesan A, Mohan V. Refined grain consumption and the metabolic syndrome in urban Asian Indians (Chennai Urban Rural Epidemiology Study 57). Metabolism 2009; 58(5): 675-681.ArticlePubMed
- 21. Malik VS, Popkin BM, Bray GA, Després JP, Hu FB. Sugar-sweetened beverages, obesity, type 2 diabetes mellitus, and cardiovascular disease risk. Circulation 2010; 121(11): 1356-1364.ArticlePubMedPMC
- 22. Zuñiga YL, Rebello SA, Oi PL, Zheng H, Lee J, Tai ES. Rice and noodle consumption is associated with insulin resistance and hyperglycaemia in an Asian population. Br J Nutr 2014; 111(6): 1118-1128.ArticlePubMed
- 23. Cheung BM. The cardiovascular continuum in Asia: a new paradigm for the metabolic syndrome. J Cardiovasc Pharmacol 2005; 46(2): 125-129.ArticlePubMed
- 24. Pereira MA. Sugar-sweetened and artificially-sweetened beverages in relation to obesity risk. Adv Nutr 2014; 5(6): 797-808.ArticlePubMedPMC
- 25. Ha K, Chung S, Lee HS, Kim CI, Joung H, Paik HY. Association of dietary sugars and sugar-sweetened beverage intake with obesity in Korean children and adolescents. Nutrients 2016; 8(1): 31.ArticlePubMedPMC
- 26. Joo NS, Yang SW, Park SJ, Choi SJ, Song BC, Yeum KJ. Milk consumption and Framingham risk score: Analysis of the Korea National Health and Nutrition Examination Survey data (2008-2011). Yonsei Med J 2016; 57(1): 197-202.ArticlePubMedPMCLink
- 27. Wang W, Wu Y, Zhang D. Association of dairy products consumption with risk of obesity in children and adults: a meta-analysis of mainly cross-sectional studies. Ann Epidemiol 2016; 26(12): 870-882.ArticlePubMed
- 28. Bertoia ML, Mukamal KJ, Cahill LE, Hou T, Ludwig DS, Mozaffarian D. Changes in intake of fruits and vegetables and weight change in United States men and women followed for up to 24 years: Analysis from three prospective cohort studies. PLoS Med 2015; 12(9): e1001878.ArticlePubMedPMC
- 29. Rizzoli R, Bischoff-Ferrari H, Dawson-Hughes B, Weaver C. Nutrition and bone health in women after the menopause. Womens Health (Lond) 2014; 10(6): 599-608.ArticlePubMedLink
REFERENCES
Appendix
Contribution of specific foods for carbohydrate intake

Table 1

Characteristics of the study subjects according to the quintile categories of total carbohydrate intake
Table 2

Odds ratios and 95% confidence interval for obesity according to the distribution of total carbohydrate intake and major carbohydrate source foods

Table 4

Odds ratios and 95% confidence interval of obesity according to the noodle intake in Korean adults
1) Obesity: BMI ≥ 25 kg/m2, Abdominal obesity: Waist Circumference M ≥ 90/F ≥ 85
2) The tertile for g/day for each noodle
3) Model 1: Crude
4) Model 2: Adjusted for age, sex, education, job, married, income
5) Model 3: Adjusted for Model 2 + drinking status, smoking status, exercise, total energy intake
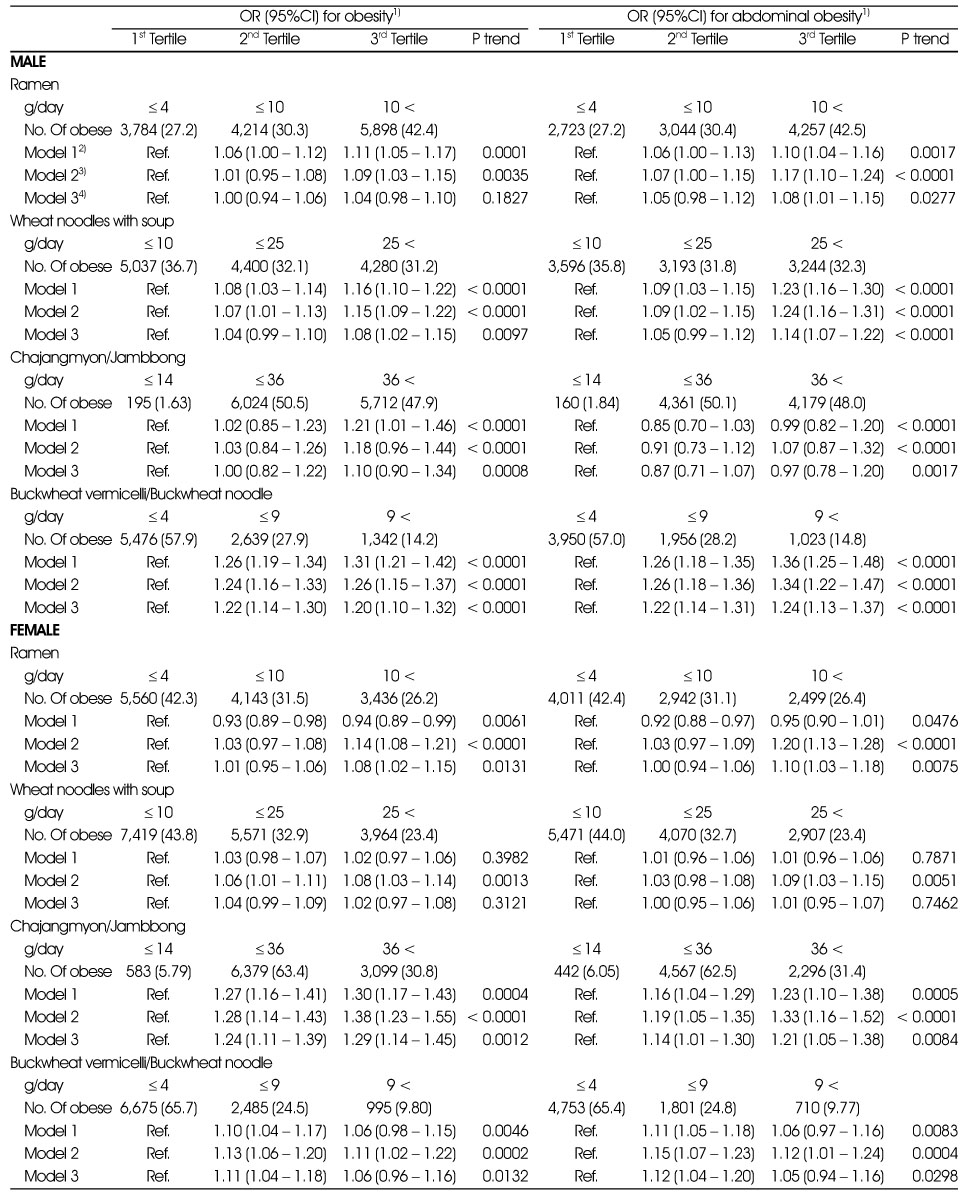
Figure & Data
REFERENCES
Citations
Citations to this article as recorded by 
- Calcium- and Sodium-Rich Food Intake among Koreans with and without Metabolic Syndrome: Cross-Sectional Analysis of the Korean Genome and Epidemiology Study
Byeonggeun Choi, Jiyoon Kim, Yeonjin Kim, Jiae Shin, Sang-Ah Lee
Nutrients.2024; 16(15): 2439. CrossRef - In vitro safety and efficacy of probiotics mixture
on carbohydrate digestion inhibition
Eunsol Seo, Jang-Bin Woo, MinYeong Seo, Jeongmin Woo
Korean Journal of Food Preservation.2023; 30(3): 538. CrossRef - Assessment of dietary quality and nutrient intake of obese children in Changwon area
Ji-Sook Park, Ha-Neul Choi, Jae-Young Kim, Sang-Hyuk Ma, Jung-Eun Yim
Journal of Nutrition and Health.2022; 55(6): 630. CrossRef - Comparison of the levels of energy intake from dish and food groups by gender and age among Korean obese adults: data obtained from the 2013-2018 Korea National Health and Nutrition Examination Survey
Cheongmin Sohn, Woori Na, Chaeryeon Kim, Seunghee Choi, Oh Yoen Kim, Jounghee Lee, Mi Ock Yoon, Myoungsook Lee
Journal of Nutrition and Health.2022; 55(6): 670. CrossRef - Relationship between Obesity and Dental Caries in Some University Students: A Pilot Study
SooJeong Hwang, Hoon Kim, MinSeock Seo
Journal of Dental Hygiene Science.2021; 21(2): 127. CrossRef
 Cite
CiteDistribution and Exposure Prevalence of Carbohydrate-based Food Intake among Obese Korean Adults Based on the Health Examinees (HEXA) Study
Distribution and Exposure Prevalence of Carbohydrate-based Food Intake among Obese Korean Adults Based on the Health Examinees (HEXA) Study
Characteristics of the study subjects according to the quintile categories of total carbohydrate intake
P values were calculated by chi-square test
Odds ratios and 95% confidence interval for obesity according to the distribution of total carbohydrate intake and major carbohydrate source foods
1) Obesity: BMI ≥ 25 kg/m2, Abdominal obesity: Waist Circumference M ≥ 90/F ≥ 85
2) Model 1: Crude
3) Model 2: Adjusted for age, sex, education, job, married, income
4) Model 3: Adjusted for Model 2 + drinking status, smoking status, exercise, total energy intake
Distribution of carbohydrate source foods intake according to the noodle intake
1) Model 1: Adjusted for age, sex
2) Model 2: Adjusted for age, sex, education, job, married, income, total energy intake
Odds ratios and 95% confidence interval of obesity according to the noodle intake in Korean adults
1) Obesity: BMI ≥ 25 kg/m2, Abdominal obesity: Waist Circumference M ≥ 90/F ≥ 85
2) The tertile for g/day for each noodle
3) Model 1: Crude
4) Model 2: Adjusted for age, sex, education, job, married, income
5) Model 3: Adjusted for Model 2 + drinking status, smoking status, exercise, total energy intake
Odds ratios and 95% confidence interval of obesity according to the noodle intake by gender
1) Obesity: BMI ≥ 25 kg/m2, Abdominal obesity: Waist Circumference M ≥ 90/F ≥ 85
2) Model 1: Crude
3) Model 2: Adjusted for age, sex, education, job, married, income
4) Model 3: Adjusted for Model 2 + drinking status, smoking status, exercise, total energy intake
Table 1
Characteristics of the study subjects according to the quintile categories of total carbohydrate intake
P values were calculated by chi-square test
Table 2
Odds ratios and 95% confidence interval for obesity according to the distribution of total carbohydrate intake and major carbohydrate source foods
1) Obesity: BMI ≥ 25 kg/m2, Abdominal obesity: Waist Circumference M ≥ 90/F ≥ 85 2) Model 1: Crude 3) Model 2: Adjusted for age, sex, education, job, married, income 4) Model 3: Adjusted for Model 2 + drinking status, smoking status, exercise, total energy intake
Table 3
Distribution of carbohydrate source foods intake according to the noodle intake
1) Model 1: Adjusted for age, sex 2) Model 2: Adjusted for age, sex, education, job, married, income, total energy intake
Table 4
Odds ratios and 95% confidence interval of obesity according to the noodle intake in Korean adults
1) Obesity: BMI ≥ 25 kg/m2, Abdominal obesity: Waist Circumference M ≥ 90/F ≥ 85 2) The tertile for g/day for each noodle 3) Model 1: Crude 4) Model 2: Adjusted for age, sex, education, job, married, income 5) Model 3: Adjusted for Model 2 + drinking status, smoking status, exercise, total energy intake
Table 5
Odds ratios and 95% confidence interval of obesity according to the noodle intake by gender
1) Obesity: BMI ≥ 25 kg/m2, Abdominal obesity: Waist Circumference M ≥ 90/F ≥ 85 2) Model 1: Crude 3) Model 2: Adjusted for age, sex, education, job, married, income 4) Model 3: Adjusted for Model 2 + drinking status, smoking status, exercise, total energy intake


