Articles
- Page Path
- HOME > Korean J Community Nutr > Volume 22(4); 2017 > Article
-
Research Article
- Effects of Nutrition Education at a Community Health Center on Overweight and Obese Middle-aged Women in Jeonbuk Area-Focused on Personalized Daily Energy Requirement and Food Exchange Units
-
Se-Yeon Kim, Sook-Bae Kim

-
Korean Journal of Community Nutrition 2017;22(4):307-322.
DOI: https://doi.org/10.5720/kjcn.2017.22.4.307
Published online: August 31, 2017
1Department of Nutrition Services, Chonbuk National University Hospital, Jeonju, Korea.
2Department of Food Science & Human Nutrition, Research Institute of Human Ecology, Chonbuk National University, Jeonju, Korea.
- Corresponding author: Sook-Bae Kim. Chonbuk National University, 567, Baekje-daero, Deokjin-gu, Jeonju 54896, Korea. Tel: (063) 270-3823, Fax: (063) 270-3854, sbkim@jbnu.ac.kr
Copyright © 2017 The Korean Society of Community Nutrition
This is an Open-Access article distributed under the terms of the Creative Commons Attribution Non-Commercial License (http://creativecommons.org/licenses/by-nc/3.0/) which permits unrestricted non-commercial use, distribution, and reproduction in any medium, provided the original work is properly cited.
- 1,100 Views
- 2 Download
- 4 Crossref
Abstract
-
Objectives
- This study examined the effects of nutrition education focused on personalized daily energy requirement and food units using Food Exchange System on anthropometric, biochemical characteristics, nutrition knowledge, dietary attitude and nutrient intakes for overweight and obese in a public health center.
-
Methods
- The subjects were 60 overweight/obese women based on BMI (educated 30 vs. noneducated 30, 50~64 years). Educated group was provided individual and/or group lessons (40 min/ lesson/week, 5 week), ‘Introduction: obese & health’, ‘6 nutrients and 6 food groups’, ‘My obesity & daily needed energy’, ‘Meal planning for personalized daily energy and food units using Food Exchange Systems’, and ‘Smart food choices’. After education, we examined the differences in anthropometric/biochemical characteristics, nutrition knowledge, dietary attitude and nutrient intakes between educated group and non-educated group.
-
Results
- After nutrition education, in the educated group, there were improvements on anthropometric/biochemical characteristics, nutrition knowledge, dietary attitude and nutrient intakes in the educated group compared to the non-educated group. We observed a decrease in the mean weight, total cholesterol (TC) and the incidence of overweight/obesity and hypercholesterolemia and an increase in the mean lean body mass. The scores of nutrition knowledge, ‘Function of carbohydrate, protein, vitamin, mineral’ and ‘Food Sources of fat, vitamin, mineral’ were increased. The scores of dietary attitudes, ‘Taking a joyful meal, a leisurely meal, a balanced meal, a meal with sufficient vegetables, a meal with diversity, a meal with spicy foods, a meal with overeating’ were increased. The intakes of energy, carbohydrate, fat, protein, vitamin A, thiamin, Zn and cholesterol were decreased. The scores of INQ, protein, vitamin A, vitamin C, thiamin, riboflavin, vitamin B6, folate, Ca, P, Fe, Zn were increased.
-
Conclusions
- The nutrition education focused on personalized daily energy requirement and food exchange unit using Food Exchange System for overweight and obese may improve food behavior, dietary intakes and symptoms of overweight and obese, even in a community health center.
- 1. Chang YK, Chung YJ, Moon HK, Yoon JS, Park HR, Kim BH. Nutritional assessment. 2nd ed. Seoul: Shingwang publishing; 2009. p. 65-70.
- 2. Choi HM, Kim JH, Kim CI, Song KH, Jang KJ, Min HS, et al. 21st century nutrition. 3rd ed. Paju: Kyomunsa; 2009. p. 77-96.
- 3. Ministry of Health and Welfare. Korea Centers for Disease Control and Prevention. Korea health statistics 2012: Korea National Health and Nutrition Examination Survey (KNHANES V-3) [Internet]. Ministry of Health and Welfare; 2012; cited 2014 May 15]. Available from: http://www.knhanes.cdc.go.kr/.
- 4. Koo JO. Association of bone mineral density and blood pressure, calcium, intake among adult women in Seoul, Kyunggi area: based on 2011 KNHANES. Korean J Community Nutr 2013; 18(3): 269-282.Article
- 5. Carr MC. The emergence of the metabolic syndrome with menopause. J Clin Endocrinol Metab 2003; 88(6): 2404-2411.ArticlePubMed
- 6. Kim SK, Sunwoo JG, Lee EJ. Relation of mineral nutrition status and climacteric symptoms in pre-and postmenopausal women. Korean J Nutr 2006; 39(2): 121-132.
- 7. Lee EJ. Effects of weight control program on nutrient intakes and physical fitness in obese Korean adult women. Korean J Community Nutr 2009; 14(6): 756-766.
- 8. Lee MS. The characteristics of dietary habits of obese, overweight or normal subjects in Seoul. Korean J Community Nutr 2004; 9(2): 161-172.
- 9. Kwon GJ. Effect of eating behavior on obese female. New Med 2003; 46(6): 64-80.
- 10. Lee O, Kim J, Lee H, Choue R. Nutritional status, quality of diet and quality of life postmenopausal women with mild climacteric symptoms based on food group intake patterns. Korean J Community Nutr 2012; 17(1): 69-80.Article
- 11. Kim YH, Kim Y. A study on body mass index and associated factors of the middle aged women in small city. Korean J Community Nutr 2002; 7(4): 506-515.
- 12. Choi JH, Yang JH, Han JP. A comparative analysis of body composition and blood lipid profile during exercise and detraining in exercise type in the middle-aged obese women. J Korea Sports Med 2006; 45(3): 526-536.
- 13. Park YS, Lee JW, Seo JS, Lee BK, Lee HS, Lee SK. Nutrition education and counseling. 5th ed. Paju: Kyomunsa; 2016. p. 2-13.
- 14. Oh JY, Kim SB. Development and effects' analysis of nutrition education program for diabetes mellitus at community health center: Focused on individual daily energy requirements and food exchange units. Korean J Community Nutr 2010; 15(4): 485-497.
- 15. Korean Diabetes Association. Guideline of food exchange system for diabetes. 3rd ed. Seoul: Korean Diabetes Association; 2010. p. 1-124.
- 16. Kim SB, Choi HJ. Effects of nutrition education using food exchange system: changes in elementary students' nutrition knowledge, dietary attitude and nutrients intake. Korean J Community Nutr 2008; 13(6): 922-933.
- 17. Guo JL, Kim SK. Effects on nutrition education of Chinese college students in Korea: Focused on personalized daily energy requirement and food exchange units. Korean J Community Nutr 2013; 18(6): 565-576.Article
- 18. Oh SW. Effects of nutrition education using pamphlet for the elderly diabetes mellitus: Focused on individual daily needed food exchange units [master's thesis]. Chonbuk National University; 2010.
- 19. Hwang ER. The comparison of health status and nutrient intakes on middle-aged women by weight control program performed in the community health center [master's thesis]. Shilla University; 2008.
- 20. Kang JS, Kim HS. A study on the evaluation of nutritional education program for the middle aged obese women. Korean J Food Nutr 2004; 17(4): 356-367.
- 21. Yim KS. The effects of a nutrition education program for hypertensive female elderly at the public health center. Korean J Community Nutr 2008; 13(5): 640-652.
- 22. Eom HS, Jeong MJ, Kim SB. A study on nutrition knowledge, dietary attitude, food habit of middle school students in Chonbuk area. Korean J Community Nutr 2005; 10(5): 574-581.
- 23. Korean Society for The Study of Obesity. General information of obese [Internet]. Korean Society for The Study of Obesity; 2014; cited 2014 Apr 8]. Available from: http://www.kosso.or.kr.
- 24. Son SM, Im HS, Kim JH, Lee JH, Seo JS, Son JM. Clinical Nutrition. 4th ed. Paju: Kyomunsa; 2009. p. 147-149.
- 25. Rural Development Administration. Korean Community Nutrition Society. Easy knowing database by one portion size of foods. 2nd ed. Paju: Kyomunsa; 2013. p. 4-350.
- 26. The Korean Nutrition Society. Dietary reference intakes for Koreans. 1st revision. Seoul: The Korean Nutrition Society; 2010. p. 25-499.
- 27. Jang HJ. Effect of nutrition education program with oriental therapy for overweight and obese adult at the public health center [master's thesis]. Chonbuk National University; 2010.
- 28. Kim KJ, Lee WJ, Lee SJ, Ann NY, Oh HR, Sin YJ. Health status and lifestyle including diet, exercise, and daily activities in obese adults. J Korean Sports Med 2005; 23(1): 54-63.
- 29. Ahn NY, Kim KJ. Effects of health education for the nutrient intakes and eating habits in youth athletes. Korean J Coach Sci 2011; 13(1): 277-282.
- 30. Yoon JS, Jeong YH, Park JA, Oh HM. The effect of individualized nutritional education on adults having two or more symptoms of chronic degenerative disease. Korean J Community Nutr 2002; 7(6): 794-802.
- 31. Shim JE, Paik HY, Moon HK. Breakfast consumption pattern, diet quality and health outcomes in adults from 2001 National Health and Nutrition Survey. J Nutr Health 2007; 40(5): 451-462.
- 32. Mclnnis KJ. Diet, exercise, and the challenge of combating obesity in primary care. J Cardiovasc Nurs 2003; 18(2): 93-100.ArticlePubMed
- 33. Law M. Salt, blood pressure and cardiovascular diseases. J Cardiovasc Risk 2000; 7(1): 5-8.ArticlePubMed
REFERENCES
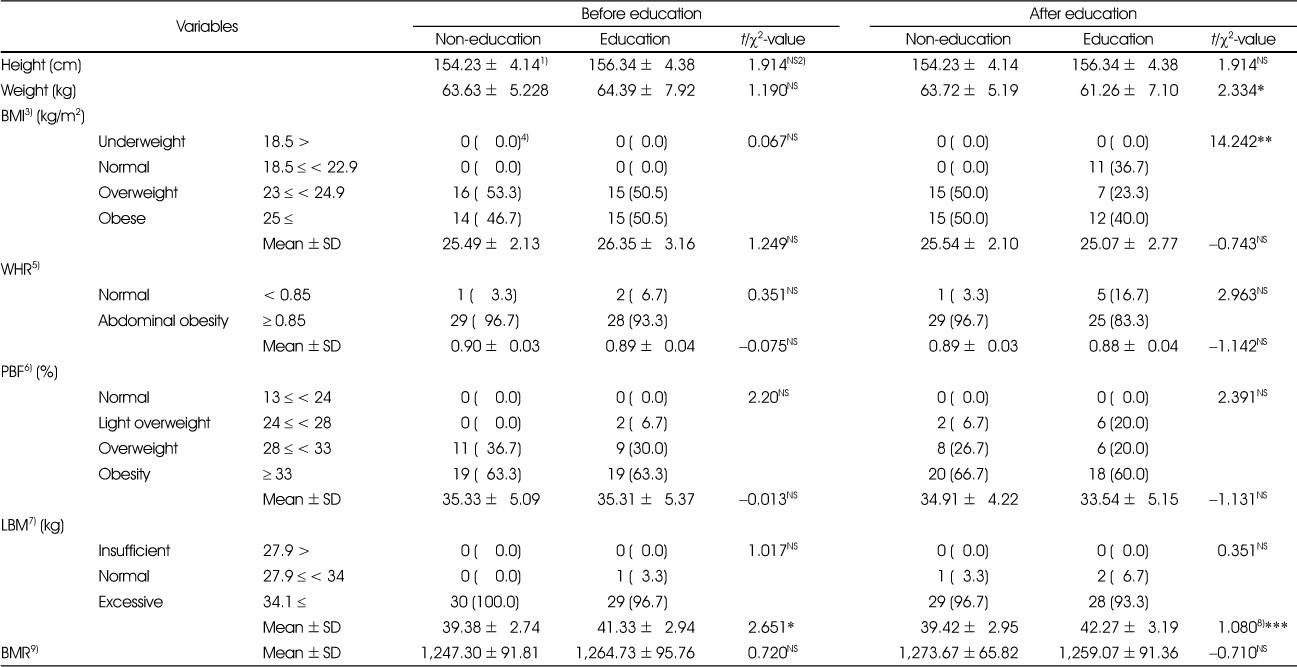
Effect of nutrition education on anthropometric characteristics

1) Mean ±SD
2) NS: Not Significant
3) BMI: Body Mass Index, BMI = Weight (kg) / [Height (m)]2, < 18.5: underweight, 18.5~22.9: normal, 23.0~24.9: overweight, ≥ 25.0: obese
4) N (%),
5) WHR: Waist/Hip
6) PBF: Percentage of body fat(%)
7) LBM: Lean Body Mass(kg)
8) By ANCOVA test
9) BMR: basal metabolic rate
*: p < 0.05, **: p < 0.01, ***: p < 0.001
Figure & Data
REFERENCES
Citations

- Evaluation of Irisin Levels in Cancer Anorexia Cachexia Syndrome and the Relationship between Nutrition Education and Quality of Life
Diler Us Altay, Duygu Mataracı Değirmenci, Salih Can Çelik, Abdullah Üner, Tevfik Noyan, Çağrı Akalın
Cumhuriyet Science Journal.2024; 45(4): 636. CrossRef - Influence of Comprehensive Lifestyle Intervention (LSI) Program on Health, Fatigue, and Quality of Life in Middle-Aged Women
Su-Jin Jung, Seung-Ok Lee, Min-Jun Choi, Jun Heo, Soo-Wan Chae, Baik-Hwan Cho
Journal of Lifestyle Medicine.2022; 12(3): 127. CrossRef - Effects of Nutrition Education and Exercise Program on Obesity Index and Behavioral Modification in Moderate Obese Women
Myung-Hee Chang, Su-Jin Jung
Korean Journal of Community Nutrition.2018; 23(4): 318. CrossRef - Effects of an Intensive Management Program for Diabetic Patients on a Blood Biochemical Profile and Diabetes Knowledge
Su-Jeong Yeo, Bok-Hee Kim
Korean Journal of Community Nutrition.2018; 23(2): 148. CrossRef
Contents and tools of nutrition education
Effect of nutrition education on anthropometric characteristics
1) Mean ±SD
2) NS: Not Significant
3) BMI: Body Mass Index, BMI = Weight (kg) / [Height (m)]2, < 18.5: underweight, 18.5~22.9: normal, 23.0~24.9: overweight, ≥ 25.0: obese
4) N (%),
5) WHR: Waist/Hip
6) PBF: Percentage of body fat(%)
7) LBM: Lean Body Mass(kg)
8) By ANCOVA test
9) BMR: basal metabolic rate
*: p < 0.05, **: p < 0.01, ***: p < 0.001
Effect of nutrition education on biochemical characteristics
1) N (%)
2) NS: Not Significant
3) Fast blood sugar
4) Impaired Fasting Glucose
*: p < 0.05, ***: p < 0.001
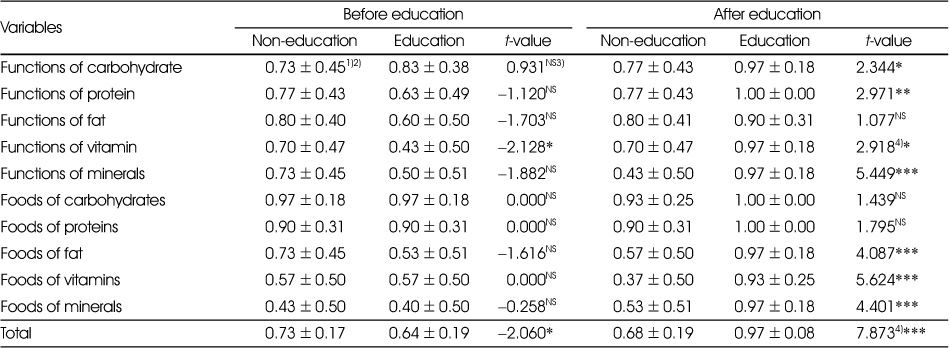
Effect of nutrition education on nutrition knowledge
1) Score: non-corrected, 0; corrected, 1
2) Mean ±SD
3) NS: Not Significant
4) By ANCOVA test
*: p < 0.05, **: p < 0.01, ***: p < 0.001
Effect of nutrition education on dietary attitudes
1) Score: seldom, 1; often, 2; frequent, 3; always, 4
2) Mean ±SD
3) NS: Not Significant
4) (R) denotes a negatively phrased and reversely scored item
**: p < 0.01, ***: p < 0.001
Effect of nutrition education on meals and snacks
1) N (%)
2) NS: Not Significant
3) By ANCOVA test
*: p < 0.05, **: p < 0.01, ***: p < 0.001
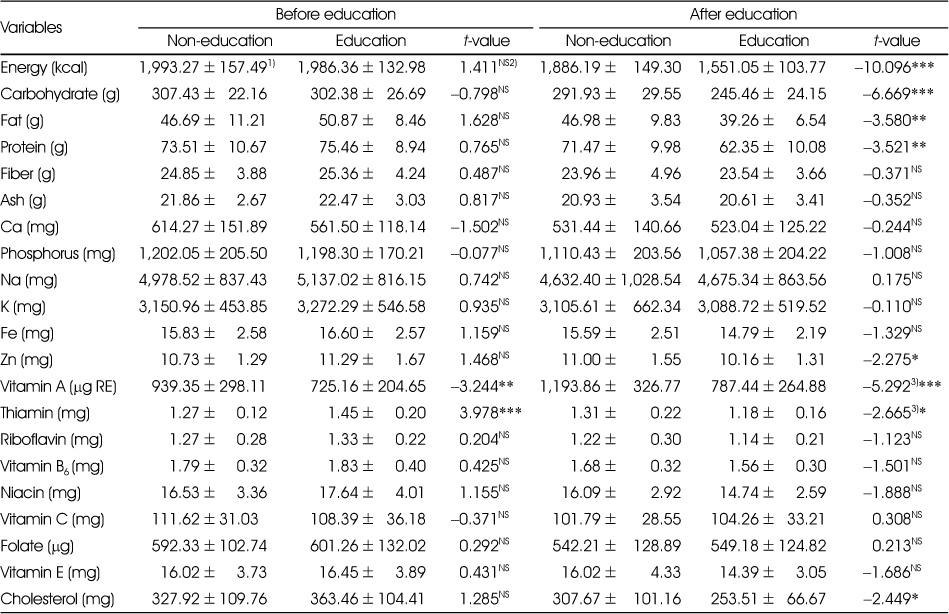
Effects of nutrition education on nutrient intake
1) Mean ±SD
2) NS: Not Significant
3) By ANCOVA test
*: p < 0.05, **: p < 0.01, ***: p < 0.001
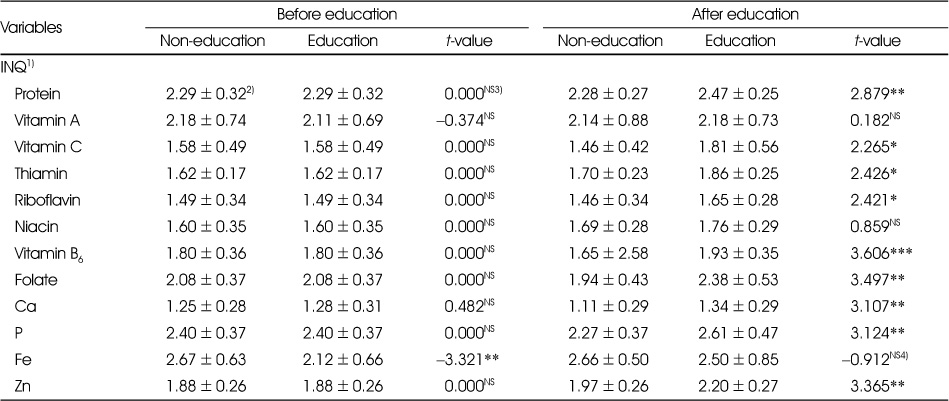
Effects of nutrition education on INQ
1) INQ: index of nutritional quality
2) Mean ±SD
3) NS: Not Significant
4) By ANCOVA test
*: p < 0.05, **: p < 0.01, ***: p < 0.001
Effects of nutrition education on energy, protein, fiber and vitamins intake
1) N (%)
2) NS: Not Significant
3) EAR: Estimated Average Requirement
4) RNI: Recommended Nutrient Intake
5) AI: Adequate Intake
6) UL: Tolerable Upper Intake Level
*: p < 0.05, **: p < 0.01
Effects of nutrition education on mineral intake
1) N (%)
2) NS: Not Significant
3) EAR: Estimated Average Requirement
4) RNI: Recommended Nutrient Intake
5) UL: Tolerable Upper Intake Level
6) AI: Adequate Intake,
**: p < 0.01
1) Mean ±SD 2) NS: Not Significant 3) BMI: Body Mass Index, BMI = Weight (kg) / [Height (m)]2, < 18.5: underweight, 18.5~22.9: normal, 23.0~24.9: overweight, ≥ 25.0: obese 4) N (%), 5) WHR: Waist/Hip 6) PBF: Percentage of body fat(%) 7) LBM: Lean Body Mass(kg) 8) By ANCOVA test 9) BMR: basal metabolic rate *:
1) N (%) 2) NS: Not Significant 3) Fast blood sugar 4) Impaired Fasting Glucose *:
1) Score: non-corrected, 0; corrected, 1 2) Mean ±SD 3) NS: Not Significant 4) By ANCOVA test *:
1) Score: seldom, 1; often, 2; frequent, 3; always, 4 2) Mean ±SD 3) NS: Not Significant 4) (R) denotes a negatively phrased and reversely scored item **:
1) N (%) 2) NS: Not Significant 3) By ANCOVA test *:
1) Mean ±SD 2) NS: Not Significant 3) By ANCOVA test *:
1) INQ: index of nutritional quality 2) Mean ±SD 3) NS: Not Significant 4) By ANCOVA test *:
1) N (%) 2) NS: Not Significant 3) EAR: Estimated Average Requirement 4) RNI: Recommended Nutrient Intake 5) AI: Adequate Intake 6) UL: Tolerable Upper Intake Level *:
1) N (%) 2) NS: Not Significant 3) EAR: Estimated Average Requirement 4) RNI: Recommended Nutrient Intake 5) UL: Tolerable Upper Intake Level 6) AI: Adequate Intake, **:

 KSCN
KSCN


 Cite
Cite


