
Articles
- Page Path
- HOME > Korean J Community Nutr > Volume 29(4); 2024 > Article
-
Research Article
- Analysis of health behavior changes among residents in depopulation areas in Korea: a cross-sectional study based on Community Health Survey data from 2010 to 2019
-
Miyong Yon†

-
Korean Journal of Community Nutrition 2024;29(4):348-357.
DOI: https://doi.org/10.5720/kjcn.2024.00001
Published online: August 31, 2024
Principal Researcher, Department of Building a Digital Health Ecosystem, Korea Health Industry Development Institute, Cheongju, Korea
- †Corresponding author: Miyong Yon Department of Building a Digital Health Ecosystem, Korea Health Industry Development Institute, Osong Health Technology Administration Complex, 187 Osongseangmyeong2-ro, Osong-eup, Heungdeok-gu, Cheongju 28159, Korea Tel: +82-43-713-8470 Fax: +82-43-713-8907 Email: ymy0827@khidi.or.kr
• Received: January 3, 2024 • Revised: March 8, 2024 • Accepted: May 20, 2024
© 2024 The Korean Society of Community Nutrition
This is an Open-Access article distributed under the terms of the Creative Commons Attribution Non-Commercial License (http://creativecommons.org/licenses/by-nc/4.0) which permits unrestricted non-commercial use, distribution, and reproduction in any medium, provided the original work is properly cited.
- 3,502 Views
- 31 Download
- 1 Crossref
Abstract
-
Objectives
- The total population of Korea began to decline in 2019; in particular, the population in rural areas has been rapidly decreasing and is aging. Therefore, the government has designated depopulation areas and is seeking ways to support them. In this study, we determined that observing whether health gaps occurred due to population decline in local areas was necessary. Therefore, we attempted to examine changes in health behavior in depopulation areas in a time series manner using Community Health Survey data.
-
Methods
- The analysis used Community Health Survey data from 2010 to 2019, and regional classification was divided by depopulation areas designated by the Ministry of the Interior and Safety. Trends in health behavior and chronic disease prevalence between depopulation and non-depopulation areas were analyzed. All analyses were conducted using complex sample analysis procedures in SAS 9.4 software.
-
Results
- The smoking rate steadily decreased in both depopulation and non-depopulation areas, whereas the high-risk drinking rate increased slightly. The walking practice rate did not improve in depopulation areas compared to non-depopulation areas. Furthermore, nutritional labeling usage rate was consistently lower in depopulation areas than in non-depopulation areas, with the gap being the largest. The prevalence of obesity, diabetes, and hypertension showed that the gap between depopulation and non-depopulation areas is continuously increasing.
-
Conclusions
- Health behaviors in depopulation areas have not improved, and the prevalence of chronic diseases is increasing rapidly. Therefore, the demand for health care services that support healthy lifestyle practices and chronic disease management in these areas is expected to increase.
INTRODUCTION
METHODS
RESULTS
DISCUSSION
CONCLUSIONS
-
Conflict of Interest
There are no financial or other issues that might lead to conflict of interest.
-
Funding
This study was performed with financial support from the Korea Disease Control and Prevention Agency in 2023.
-
Data Availability
Data sharing is not applicable to this article as no new data were created or analyzed in this study.
NOTES
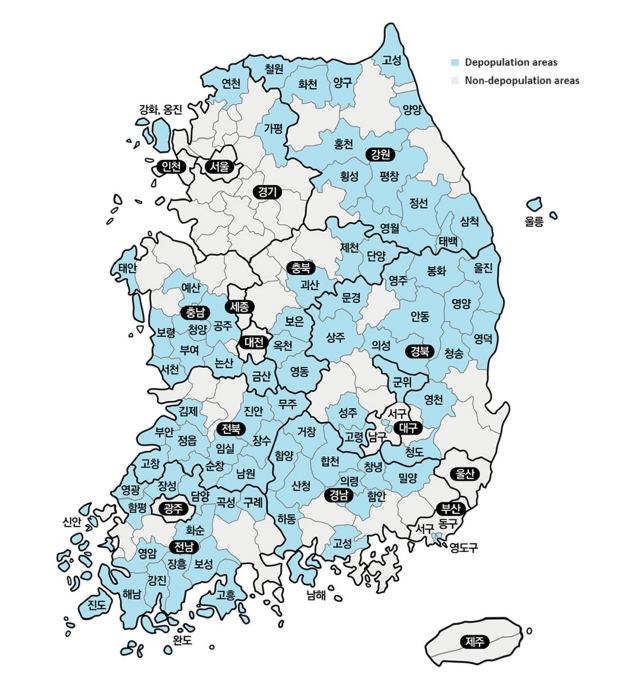
Fig. 2.
Obesity rate trends between depopulation and non-depopulation areas.
Obesity rate by region type was measured as a percentage of complex sampling design effect and appropriate sampling weights of the national survey using the SURVEYFREQ procedure in the SAS program.
P for trend adjusted for sex, age and education level from PROC SURVEYLOGISTIC procedures.

Fig. 3.
Diabetes prevalence trends between depopulation and non-depopulation areas.
Diabetes prevalence by region type was measured as a percentage of complex sampling design effect and appropriate sampling weights of the national survey, using the SURVEYFREQ procedure in the SAS program.
P for trend adjusted for sex, age and education level from PROC SURVEYLOGISTIC procedures.
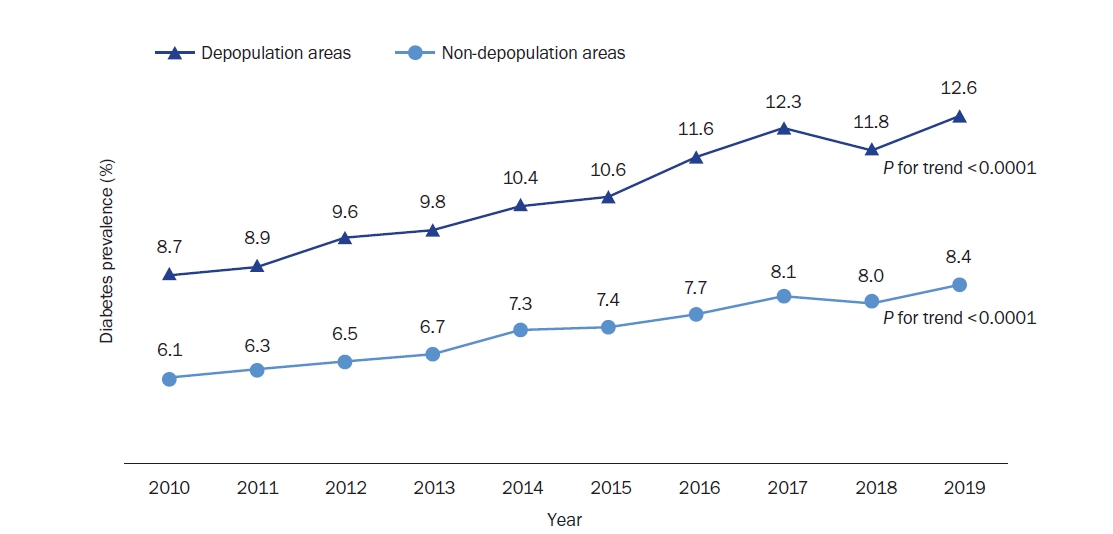
Fig. 4.
Hypertension prevalence trends between depopulation and non-depopulation areas.
Hypertension prevalence by region type was measured as a percentage of the complex sampling design effect and appropriate sampling weights of the national survey using the SURVEYFREQ procedure in the SAS program.
P for trend adjusted for sex, age and education level from PROC SURVEYLOGISTIC procedures.
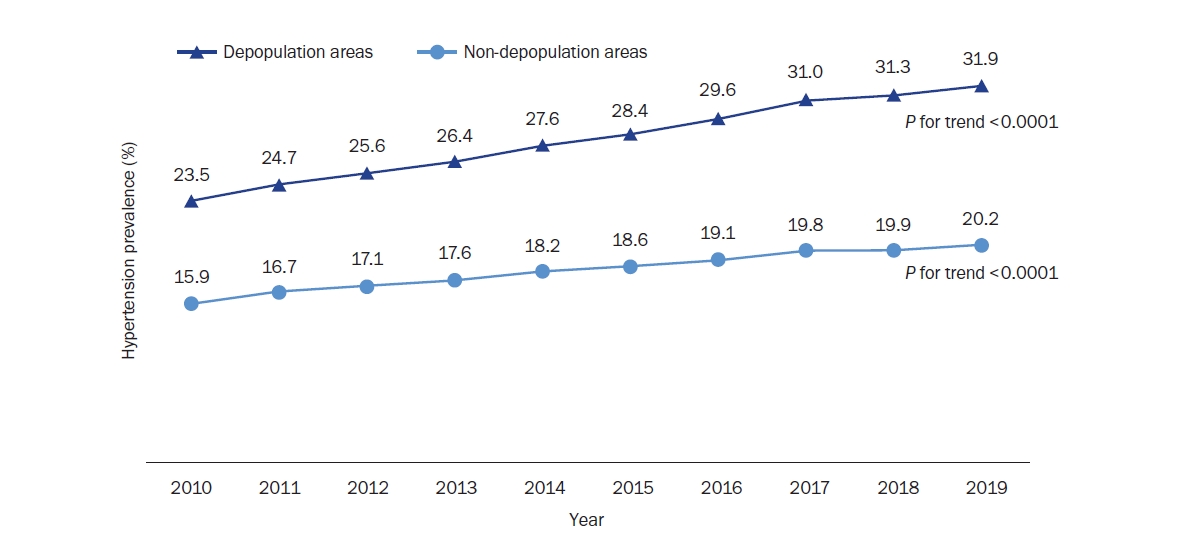
Table 1.Characteristics of distribution of subjects between depopulation and non-depopulation areas
Table 2.Health behavior practice trends between depopulation and non-depopulation areas
Table 3.ORs for health behavior practice between depopulation and non-depopulation areas
Table 4.ORs for chronic disease between depopulation and non-depopulation areas
- 1. Ministry of the Interior and Safety. Notice on designation of population decline area (Ministry of the Interior and Safety Notice No. 2021-66, October 19, 2021) [Internet]. Ministry of the Interior and Safety; 2022 [updated 2022 Feb 23; cited 2023 May 10]. Available from: https://www.mois.go.kr/frt/bbs/type001/commonSelectBoardArticle.do?bbsId=BBSMSTR_000000000016&nttId=90651
- 2. Chang I, Jung CW. Characteristics of population change in depopulation areas and future policy responses in Korea. GRI REVIEW 2022; 24(4): 1-27.
- 3. Cho KH, Lee JW, Kim SC. Improving the financial support system for depopulation areas. Korea Research Institute for Local Administration; 2017. Report No. 2017-4.
- 4. Choi HS, Song G, Ko Y, Chae S, Ahn Y. Status of major health indicators in population shrinking regions, Korea. Public Health Wkly Rep 2022; 15(13): 816-828.
- 5. SunWoo D, Oh JS. Policy issues for maintaining the living activity function of elderly people. Health Welf Policy Forum 2009; 149: 64-76.
- 6. An S, Kim NH, Kim YN. Comparison of health status and the effectiveness of health cost between rural and urban residents. Korea Rural Economic Institute; 2019. Report No. P257.
- 7. Yi YJ, Kim EJ. The effects of accessibility to medical facilities and public transportation on perceived health of urban and rural elderly : using generalized ordered logit model. J Korean Reg Dev Assoc 2015; 27(1): 65-88.
- 8. Kang H, Park K. Comparison of correlates of depression in late-life between urban and rural areas. J Korea Gerontol Soc 2012; 32(1): 129-143.
- 9. Kim MJ, Park E. The prevalence and the related factors of metabolic syndrome in urban and rural community. Korean J Adult Nurs 2014; 26(1): 67-77.ArticleLink
- 10. Jun MJ, Moon SW. An analysis on the determinants of life satisfaction for the elderly in Korea - a comparison between the capital and non-capital regions. J Korean Reg Dev Assoc 2016; 28(2): 153-171.
- 11. Lee YJ. Elderly healthy level of regional disparities compare. J Korea Content Asso 2015; 15(11): 347-358.Article
- 12. Chang I, Jung CW. The spatial distribution of the vulnerable in depopulation areas and its policy implications. J Korean Off Statistics 2022; 27(3): 55-78.
- 13. Jeong J, Lee A. Analysis on the characteristics of areas of population decline by cluster type. Korean J Public Adm 2022; 31(3): 61-89.
- 14. Kang MK. Implication of spatial distribution characteristics: surging one person household. Korea Res Inst Hum Settl Policy Brief 2011; 311: 1-6.
- 15. Korea Health Promotion Institute. Indicators of a health gap [Internet]. Korea Health Promotion Institute; 2021 [cited 2023 Mar 8]. Available from: https://www.khepi.or.kr/board?menuId=MENU00742&siteId=null-
- 16. Ju YJ, Kim W, Chang K, Lee TH, Lee SY. Patients with diabetes in regions with population decline and likelihood of receiving diabetes management education and screenings for related complications in Korea. Prev Med 2024; 178: 107793.ArticlePubMed
- 17. Ministry of Health and Welfare. 2020 National survey on the elderly [Internet]. Ministry of Health and Welfare; 2021 Jul 16 [cited 2023 May 10]. Available from: https://www.mohw.go.kr/board.es?mid=a10411010200&bid=0019&act=view&list_no=366496
- 18. Choi Y, Nam K, Kim CY. Association between convenience of transportation and unmet healthcare needs of rural elderly in Korea. J Prev Med Public Health 2019; 52(6): 355-365.ArticlePubMedPMCPDF
- 19. Kim LY, Yang KS. Empirical analysis of regional characteristic factors determining net inflow and outflow of the population. J Korean Reg Dev Assoc 2013; 25(3): 1-19.
- 20. Ahn SJ. Main contents and meaning of the special act on support for decreasing population areas. Monthly Public Policy; 2022 Aug. p. 18-20.
- 21. Ha H. The implementation of ‘the Special Act on Support for Population Declining Areas’ and its future tasks. National Assembly Research Service; 2023 Feb. Report No. Issues and Perspectives 2055-20230216.
- 22. Ki M. Community-level efforts to reduce health inequalities: lessons from selected countries. Health Welf Policy Forum 2018; 260: 39-49.
- 23. Min B, Choi J. Characterizing regions based on the de facto population: focusing on the local areas in South Korea. J Korean Urban Manag Assoc 2023; 36(4): 41-60.Article
REFERENCES
Figure & Data
REFERENCES
Citations
Citations to this article as recorded by 
- What health risks arise in shrinking cities? A systematic review
Gukhwa Jang, Youngmee Jeon, Youngsoo You, Hyung Rae Cho
Sustainable Cities and Society.2026; 146: 107502. CrossRef
 Cite
CiteAnalysis of health behavior changes among residents in depopulation areas in Korea: a cross-sectional study based on Community Health Survey data from 2010 to 2019

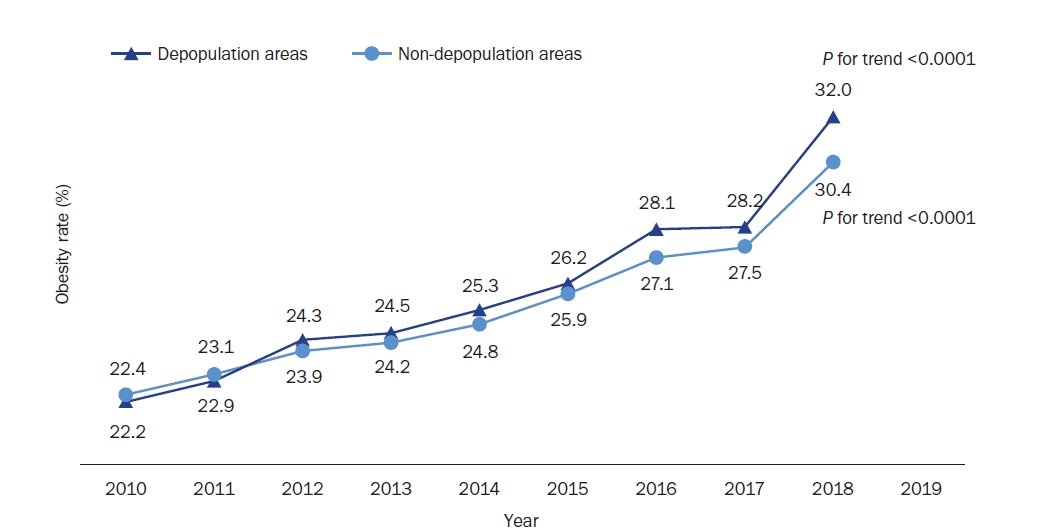


Fig. 1. Distribution of depopulation and non-depopulation areas.
Fig. 2. Obesity rate trends between depopulation and non-depopulation areas.Obesity rate by region type was measured as a percentage of complex sampling design effect and appropriate sampling weights of the national survey using the SURVEYFREQ procedure in the SAS program.P for trend adjusted for sex, age and education level from PROC SURVEYLOGISTIC procedures.
Fig. 3. Diabetes prevalence trends between depopulation and non-depopulation areas.Diabetes prevalence by region type was measured as a percentage of complex sampling design effect and appropriate sampling weights of the national survey, using the SURVEYFREQ procedure in the SAS program.P for trend adjusted for sex, age and education level from PROC SURVEYLOGISTIC procedures.
Fig. 4. Hypertension prevalence trends between depopulation and non-depopulation areas.Hypertension prevalence by region type was measured as a percentage of the complex sampling design effect and appropriate sampling weights of the national survey using the SURVEYFREQ procedure in the SAS program.P for trend adjusted for sex, age and education level from PROC SURVEYLOGISTIC procedures.
Fig. 1.
Fig. 2.
Fig. 3.
Fig. 4.
Analysis of health behavior changes among residents in depopulation areas in Korea: a cross-sectional study based on Community Health Survey data from 2010 to 2019
| 2010 |
2011 |
2012 |
2013 |
2014 |
||||||||||||
|---|---|---|---|---|---|---|---|---|---|---|---|---|---|---|---|---|
| Depopulation areas | Non-depopulation areas | P-value | Depopulation areas | Non-depopulation areas | P-value | Depopulation areas | Non-depopulation areas | P-value | Depopulation areas | Non-depopulation areas | P-value | Depopulation areas | Non-depopulation areas | P-value | ||
| Sex | Male | 49.0 | 49.5 | 0.0430 | 49.0 | 49.5 | 0.0212 | 49.0 | 49.6 | 0.0191 | 49.1 | 49.6 | 0.0245 | 49.1 | 49.6 | 0.0291 |
| Female | 51.0 | 50.5 | 51.0 | 50.5 | 51.0 | 50.4 | 50.9 | 50.4 | 50.9 | 50.4 | ||||||
| Age group | 19–29 years | 13.4 | 19.8 | < 0.0001 | 12.7 | 19.1 | < 0.0001 | 12.2 | 18.6 | < 0.0001 | 11.7 | 18.2 | < 0.0001 | 11.5 | 18.0 | < 0.0001 |
| 30–39 years | 12.4 | 21.9 | 12.0 | 21.2 | 11.7 | 20.8 | 11.3 | 20.2 | 10.8 | 19.5 | ||||||
| 40–49 years | 16.7 | 22.7 | 16.2 | 22.4 | 16.0 | 22.3 | 15.7 | 22.0 | 15.6 | 22.0 | ||||||
| 50–59 years | 18.5 | 17.3 | 19.6 | 18.5 | 19.8 | 18.9 | 20.4 | 19.5 | 20.5 | 19.7 | ||||||
| 60–69 years | 17.5 | 10.3 | 16.7 | 10.4 | 16.5 | 10.5 | 15.8 | 10.5 | 16.5 | 10.8 | ||||||
| ≥ 70 years | 21.6 | 8.1 | 22.7 | 8.5 | 23.8 | 8.9 | 25.2 | 9.6 | 25.1 | 9.9 | ||||||
| Education level | ≤ Middle school graduate | 53.3 | 23.9 | < 0.0001 | 53.2 | 23.4 | < 0.0001 | 52.8 | 22.8 | < 0.0001 | 52.4 | 22.1 | < 0.0001 | 51.2 | 21.7 | < 0.0001 |
| High school graduate | 30.3 | 39.6 | 30.9 | 40.0 | 30.5 | 39.4 | 30.5 | 39.3 | 30.6 | 39.0 | ||||||
| ≥ College graduate | 16.4 | 36.5 | 15.9 | 36.6 | 16.7 | 37.7 | 17.1 | 38.6 | 18.2 | 39.3 | ||||||
| 2015 |
2016 |
2017 |
2018 |
2019 |
||||||||||||
| Depopulation areas | Non-depopulation areas | P-value | Depopulation areas | Non-depopulation areas | P-value | Depopulation areas | Non-depopulation areas | P-value | Depopulation areas | Non-depopulation areas | P-value | Depopulation areas | Non-depopulation areas | P-value | ||
| Sex | Male | 49.2 | 49.6 | 0.0558 | 49.2 | 49.6 | 0.0848 | 49.3 | 49.6 | 0.1874 | 49.4 | 49.6 | 0.3430 | 49.4 | 49.6 | 0.5816 |
| Female | 50.8 | 50.4 | 50.8 | 50.4 | 50.7 | 50.4 | 50.6 | 50.4 | 50.6 | 50.4 | ||||||
| Age group | 19–29 years | 11.3 | 17.9 | < 0.0001 | 11.1 | 17.9 | < 0.0001 | 10.9 | 17.8 | < 0.0001 | 10.7 | 17.7 | < 0.0001 | 10.3 | 17.6 | < 0.0001 |
| 30–39 years | 10.2 | 18.9 | 9.9 | 18.4 | 9.5 | 17.9 | 9.1 | 17.4 | 8.6 | 16.8 | ||||||
| 40–49 years | 15.3 | 21.7 | 14.8 | 21.2 | 14.3 | 20.8 | 13.8 | 20.3 | 13.2 | 19.7 | ||||||
| 50–59 years | 20.5 | 19.8 | 20.6 | 19.9 | 20.6 | 19.9 | 20.5 | 20.0 | 20.3 | 20.1 | ||||||
| 60–69 years | 17.1 | 11.5 | 17.3 | 12.0 | 17.6 | 12.4 | 17.9 | 12.7 | 18.9 | 13.4 | ||||||
| ≥ 70 years | 25.6 | 10.2 | 26.3 | 10.6 | 27.1 | 11.2 | 28.0 | 11.9 | 28.6 | 12.4 | ||||||
| Education level | ≤ Middle school graduate | 50.0 | 20.8 | < 0.0001 | 49.6 | 20.6 | < 0.0001 | 48.8 | 20.0 | < 0.0001 | 48.4 | 19.8 | < 0.0001 | 47.3 | 19.6 | < 0.0001 |
| High school graduate | 30.6 | 38.5 | 30.2 | 37.9 | 30.7 | 37.6 | 31.6 | 37.6 | 31.6 | 37.3 | ||||||
| ≥ College graduate | 19.4 | 40.7 | 20.2 | 41.5 | 20.6 | 42.4 | 20.0 | 42.5 | 21.1 | 43.0 | ||||||
| 2010 | 2011 | 2012 | 2013 | 2014 | 2015 | 2016 | 2017 | 2018 | 2019 | P for trend | ||
|---|---|---|---|---|---|---|---|---|---|---|---|---|
| Smoking | Depopulation areas | 23.0 | 22.8 | 22.1 | 21.5 | 21.2 | 19.8 | 19.4 | 18.6 | 18.5 | 18.1 | < 0.0001 |
| Non-depopulation areas | 24.6 | 24.0 | 23.8 | 23.2 | 22.7 | 21.0 | 21.1 | 20.3 | 20.4 | 19.0 | < 0.0001 | |
| High risk drinking | Depopulation areas | 14.8 | 18.7 | 15.8 | 18.8 | 19.5 | 19.8 | 19.0 | 19.7 | 19.4 | 19.1 | < 0.0001 |
| Non-depopulation areas | 15.9 | 19.0 | 17.0 | 18.6 | 18.8 | 18.8 | 18.5 | 18.6 | 18.4 | 18.0 | < 0.0001 | |
| Physical activity | Depopulation areas | 27.0 | 29.4 | 30.1 | 30.7 | 26.5 | 25.6 | 26.9 | 27.2 | - | 26.0 | < 0.0001 |
| Non-depopulation areas | 20.9 | 20.6 | 19.9 | 20.7 | 21.2 | 22.6 | 21.7 | 22.0 | - | 23.7 | < 0.0001 | |
| Walking practice | Depopulation areas | 86.6 | 83.7 | 84.2 | 82.6 | 80.1 | 79.9 | 78.8 | 80.0 | 80.1 | 79.9 | < 0.0001 |
| Non-depopulation areas | 82.5 | 81.4 | 81.2 | 81.3 | 81.4 | 82.3 | 81.5 | 82.9 | 85.3 | 84.0 | < 0.0001 | |
| Nutrition facts usage | Depopulation areas | 24.0 | 21.6 | 22.0 | 22.9 | 15.1 | 15.2 | 15.9 | 15.8 | 14.0 | 19.0 | < 0.0001 |
| Non-depopulation areas | 34.4 | 34.9 | 34.3 | 33.1 | 25.6 | 25.1 | 25.8 | 26.4 | 25.2 | 29.1 | < 0.0001 | |
| Depopulation areas |
Non-depopulation areas |
||||||
|---|---|---|---|---|---|---|---|
| OR | 95% CI | P-value | OR | 95% CI | P-value | ||
| Smoking | Year | 0.964 | (0.960–0.968) | < 0.0001 | 0.964 | (0.962–0.966) | < 0.0001 |
| Sex | 0.036 | (0.035–0.037) | < 0.0001 | 0.049 | (0.048–0.050) | < 0.0001 | |
| Age group | 0.978 | (0.977–0.979) | < 0.0001 | 0.981 | (0.981–0.981) | < 0.0001 | |
| Education level | 0.8 87 | (0.872–0.902) | < 0.0001 | 0.785 | (0.778–0.791) | < 0.0001 | |
| High risk drinking | Year | 1.037 | (1.032–1.042) | < 0.0001 | 1.015 | (1.013–1.018) | < 0.0001 |
| Sex | 0.167 | (0.161–0.172) | < 0.0001 | 0.203 | (0.200–0.205) | < 0.0001 | |
| Age group | 0.990 | (0.989–0.991) | < 0.0001 | 0.994 | (0.994–0.994) | < 0.0001 | |
| Education level | 1.006 | (0.985–1.028) | 0.5596 | 0.874 | (0.866–0.882) | < 0.0001 | |
| Physical activity | Year | 0.990 | (0.985–0.995) | < 0.0001 | 1.022 | (1.020–1.024) | < 0.0001 |
| Sex | 0.671 | (0.660–0.681) | < 0.0001 | 0.607 | (0.601–0.613) | < 0.0001 | |
| Age group | 0.988 | (0.987–0.989) | < 0.0001 | 0.995 | (0.994–0.995) | < 0.0001 | |
| Education level | 0.839 | (0.825–0.853) | < 0.0001 | 1.000 | (0.992–1.008) | 0.9571 | |
| Walking practice | Year | 0.952 | (0.947–0.958) | < 0.0001 | 1.022 | (1.019–1.024) | < 0.0001 |
| Sex | 0.753 | (0.733–0.775) | < 0.0001 | 0.868 | (0.856–0.879) | < 0.0001 | |
| Age group | 0.994 | (0.993–0.995) | < 0.0001 | 1.004 | (1.004–1.005) | < 0.0001 | |
| Education level | 1.055 | (1.028–1.083) | < 0.0001 | 0.980 | (0.970–0.990) | 0.0002 | |
| Nutrition facts usage | Year | 0.935 | (0.930–0.940) | < 0.0001 | 0.942 | (0.940–0.944) | < 0.0001 |
| Sex | 3.271 | (3.193–3.352) | < 0.0001 | 3.635 | (3.600–3.670) | < 0.0001 | |
| Age group | 0.965 | (0.964–0.966) | < 0.0001 | 0.976 | (0.976–0.976) | < 0.0001 | |
| Education level | 1.912 | (1.876–1.948) | < 0.0001 | 1.831 | (1.817–1.845) | < 0.0001 | |
| Depopulation areas |
Non-depopulation areas |
||||||
|---|---|---|---|---|---|---|---|
| OR | 95% CI | P-value | OR | 95% CI | P-value | ||
| Obesity | Year | 1.062 | (1.058–1.066) | < 0.0001 | 1.049 | (1.047–1.051) | < 0.0001 |
| Sex | 0.675 | (0.663–0.687) | < 0.0001 | 0.447 | (0.443–0.452) | < 0.0001 | |
| Age group | 0.992 | (0.991–0.992) | < 0.0001 | 1.005 | (1.005–1.006) | < 0.0001 | |
| Education level | 0.922 | (0.907–0.900) | < 0.0001 | 0.911 | (0.905–0.918) | < 0.0001 | |
| Diabetes | Year | 1.037 | (1.034–1.041) | < 0.0001 | 1.020 | (1.018–1.023) | < 0.0001 |
| Sex | 0.769 | (0.754–0.785) | < 0.0001 | 0.637 | (0.628–0.646) | < 0.0001 | |
| Age group | 1.032 | (1.031–1.033) | < 0.0001 | 1.057 | (1.057–1.058) | < 0.0001 | |
| Education level | 0.762 | (0.745–0.779) | < 0.0001 | 0.762 | (0.753–0.770) | < 0.0001 | |
| Hypertension | Year | 1.032 | (1.029–1.035) | < 0.0001 | 1.009 | (1.007–1.011) | < 0.0001 |
| Sex | 1.120 | (1.103–1.137) | < 0.0001 | 0.718 | (0.711–0.726) | < 0.0001 | |
| Age group | 1.064 | (1.063–1.064) | < 0.0001 | 1.079 | (1.079–1.080) | < 0.0001 | |
| Education level | 0.840 | (0.827–0.852) | < 0.0001 | 0.826 | (0.819–0.833) | < 0.0001 | |
Table 1. Characteristics of distribution of subjects between depopulation and non-depopulation areas
%. Sex, age and education level by region type were measured as percentages with the effect of the complex sampling design effect and appropriate sampling weights of the national survey using the SURVEYFREQ procedure in the SAS program.
Table 2. Health behavior practice trends between depopulation and non-depopulation areas
All estimates were produced to represent the Korean population using complex sampling design parameters, such as strata, cluster, and sample weight, in the PROC SURVEYFREQ procedures.
Table 3. ORs for health behavior practice between depopulation and non-depopulation areas
OR and 95% CI were calculated from survey logistic regression analyses. OR, odds ratio; 95% CI, 95% confidence interval.
Table 4. ORs for chronic disease between depopulation and non-depopulation areas
OR and 95% CI were calculated from survey logistic regression analyses. OR, odds ratio; 95% CI, 95% confidence interval.


