
Articles
- Page Path
- HOME > Korean J Community Nutr > Volume 29(4); 2024 > Article
-
Research Article
- Exploring the customer perceived value of online grocery shopping: a cross-sectional study of Korean and Chinese consumers using Means-End Chain theory
-
Xinyu Jiang1)
 , Hyo Bin Im1), Min A Lee2),†
 -
Korean Journal of Community Nutrition 2024;29(4):318-335.
DOI: https://doi.org/10.5720/kjcn.2024.00007
Published online: August 31, 2024
1)Graduate Student, Department of Foods and Nutrition, Kookmin University, Seoul, Korea
2)Professor, Department of Foods and Nutrition, Kookmin University, Seoul, Korea
- †Corresponding author: Min A Lee Department of Foods and Nutrition, Kookmin University, 77 Jeongneung-ro, Seongbuk-gu, Seoul 02707, Korea Tel: +82-2-910-5745 Fax: +82-2-910-5249 Email: malee@kookmin.ac.kr
• Received: July 26, 2024 • Revised: August 9, 2024 • Accepted: August 18, 2024
© 2024 The Korean Society of Community Nutrition
This is an Open-Access article distributed under the terms of the Creative Commons Attribution Non-Commercial License (http://creativecommons.org/licenses/by-nc/4.0) which permits unrestricted non-commercial use, distribution, and reproduction in any medium, provided the original work is properly cited.
- 7,686 Views
- 91 Download
- 2 Crossref
Abstract
-
Objectives
- Despite the growing market share of online grocery shopping, there is a need to understand customer perceived value due to the ongoing advancements in information technology. This study explores the connections between attributes, consequences, and values. Additionally, it conducts a cross-country comparison of consumers’ online grocery shopping behaviors to gain a deeper understanding of consumer market segments and any potential variations among them.
-
Methods
- Data was collected through an online questionnaire survey conducted from May 1 to 15, 2024, targeting 400 consumers in Seoul, Korea, and Shanghai, China, who have experience with online grocery shopping. The survey utilized the Means-End Chain theory and association pattern technique hard laddering. Data collation and analysis were conducted using the IBM SPSS Statistics 28.0 program. The LadderUX software was employed to analyze the links between attributes, consequences, and values and create the consumer purchasing process’s implication matrix and hierarchical value map (HVM).
-
Results
- The study identified key attributes that influence online grocery shopping decisions, including delivery service, price, freshness, and quality. Korean consumers demonstrated a higher sensitivity to price (19.0%) and delivery service (17.0%). In contrast, Chinese consumers prioritized delivery service (15.0%) and after-sales service (14.8%). Commonly cited consequences included time saving (12.6% for Koreans, 11.3% for Chinese), whereas prevalent values encompassed convenience (36.8% for Koreans, 19.6% for Chinese) and economic value (26.6% for Koreans, 14.7% for Chinese). The HVM underscored these insights, highlighting diverse consumer preferences and country-specific nuances.
-
Conclusions
- The findings highlight the current state of online food consumption and consumers’ value systems, revealing variations among countries. These findings offer empirical insights that can be used to create customized global marketing strategies that resonate with various consumer preferences and market dynamics.
INTRODUCTION
METHODS
RESULTS
DISCUSSION
CONCLUSIONS
-
Conflict of Interest
There are no financial or other issue that might lead to conflict of interest.
-
Funding
None.
-
Data Availability
The participants of this study did not give written consent for their data to be shared publicly, so due to the sensitive nature of the research supporting data is not available.
NOTES
Fig. 1.Hierarchical value map of Korean consumers (cut-off = 7). Links that have less than 7 mentions are not displayed. Each line represents the perceived association of online grocery shopping consumers. The five lines with the highest number of associations are bolded, indicating more referenced associations.

Fig. 2.Hierarchical value map of Chinese consumers (cut-off = 7). Links that have less than 7 mentions are not displayed. Each line represents the perceived association of online grocery shopping consumers. The five lines with the highest number of associations are bolded, indicating more referenced associations.

Table 1.Demographic characteristics
| Characteristic | Total (n = 400) | Korean (n = 200) | Chinese (n = 200) | χ2 |
|---|---|---|---|---|
| Gender | 0.000 | |||
| Man | 200 (50.0) | 100 (50.0) | 100 (50.0) | |
| Woman | 200 (50.0) | 100 (50.0) | 100 (50.0) | |
| Age (year) | 0.200 | |||
| 20–29 | 80 (20.0) | 40 (20.0) | 40 (20.0) | |
| 30–39 | 78 (19.5) | 40 (20.0) | 38 (19.0) | |
| 40–49 | 78 (19.5) | 40 (20.0) | 38 (19.0) | |
| 50–59 | 82 (20.5) | 40 (20.0) | 42 (21.0) | |
| ≥ 60 | 82 (20.5) | 40 (20.0) | 42 (21.0) | |
| Education | 4.315 | |||
| Junior high school | 6 (1.5) | 1 (0.5) | 5 (2.5) | |
| High school | 44 (11.0) | 26 (13.0) | 18 (9.0) | |
| Bachelor’s | 294 (73.5) | 144 (72.0) | 150 (75.0) | |
| Master’s or above | 56 (14.0) | 29 (14.5) | 27 (13.5) | |
| Occupation | 43.899*** | |||
| Office worker | 213 (53.3) | 94 (47.0) | 119 (59.5) | |
| Student | 34 (8.5) | 12 (6.0) | 22 (11.0) | |
| Homemaker | 33 (8.3) | 28 (14.0) | 5 (2.5) | |
| Self-employed | 26 (6.5) | 15 (7.5) | 11 (5.5) | |
| Specialized worker | 25 (6.3) | 22 (11.0) | 3 (1.5) | |
| Service industrial | 23 (5.8) | 11 (5.5) | 12 (6.0) | |
| Public official | 11 (2.8) | 2 (1.0) | 9 (4.5) | |
| Production worker | 11 (2.8) | 3 (1.5) | 8 (4.0) | |
| Others | 24 (6.0) | 13 (6.5) | 11 (5.5) | |
| Monthly income | - | |||
| Below 1,000,000 KRW or 4,000 CNY | 34 (8.5) | 15 (7.5) | 19 (9.5) | |
| 1,000,000-2,999,999 KRW or 4,000–5,999 CNY | 84 (21.0) | 57 (28.5) | 27 (13.5) | |
| 3,000,000–4,999,999 KRW or 6,000–7,999 CNY | 107 (26.8) | 66 (33.0) | 41 (20.5) | |
| 5,000,000–6,999,999 KRW or 8,000–9,999 CNY | 70 (17.5) | 29 (14.5) | 41 (20.5) | |
| More than 7,000,000 KRW or 10,000 CNY | 93 (23.3) | 26 (13.0) | 67 (33.5) | |
| No regular income | 12 (3.0) | 7 (3.5) | 5 (2.5) | |
| Composition of a family | 45.836*** | |||
| 1 | 50 (12.5) | 41 (20.5) | 9 (4.5) | |
| 2 | 66 (16.5) | 44 (22.0) | 22 (11.0) | |
| 3 | 134 (33.5) | 51 (25.5) | 83 (41.5) | |
| 4 | 110 (27.5) | 53 (26.5) | 57 (28.5) | |
| 5 | 34 (8.5) | 11 (5.5) | 23 (11.5) | |
| More than 6 | 6 (1.5) | 0 (0.0) | 6 (3.0) |
Table 2.Online grocery shopping behaviors
| Dimension | Total (n = 400) | Korean (n = 200) | Chinese (n = 200) | χ2 |
|---|---|---|---|---|
| Online purchaser | 2.670 | |||
| Self | 364 (91.0) | 179 (89.5) | 185 (92.5) | |
| Parents | 22 (5.5) | 11 (5.5) | 11 (5.5) | |
| Others | 14 (3.5) | 10 (5.0) | 4 (2.0) | |
| Online frequency increase | 12.676* | |||
| Absolutely not | 8 (2.0) | 3 (1.5) | 5 (2.5) | |
| Maybe not | 29 (7.3) | 10 (5.0) | 19 (9.5) | |
| Ordinary | 135 (33.8) | 80 (40.0) | 55 (27.5) | |
| Maybe yes | 181 (45.3) | 91 (45.5) | 90 (45.0) | |
| Absolutely yes | 47 (11.8) | 16(8.0) | 31 (15.5) | |
| Online frequency | 50.609*** | |||
| Daily | 23 (5.8) | 2 (1.0) | 21 (10.5) | |
| Once every 2–3 days | 149 (37.3) | 54 (27.0) | 95 (47.5) | |
| Once every week | 115 (28.8) | 64 (32.0) | 51 (25.5) | |
| 2–3 times a month | 83 (20.8) | 57 (28.5) | 26 (13.0) | |
| Once every month | 20 (5.0) | 16 (8.0) | 4 (2.0) | |
| Once every 2–3 months | 10 (2.5) | 7 (3.5) | 3 (1.5) | |
| Shopping channel | 15.403** | |||
| Almost all through physical stores | 25 (6.3) | 19 (9.5) | 6 (3.0) | |
| Physical stores more than online | 82 (20.5) | 50 (25.0) | 32 (16.0) | |
| Half and half | 139 (34.8) | 67 (33.5) | 72 (36.0) | |
| Online more than physical stores | 113 (28.3) | 46 (23.0) | 67 (33.5) | |
| Almost all through online | 41 (10.3) | 18 (9.0) | 23 (11.5) | |
| Single spending amount (KRW) | - | |||
| Below 10,000 | 2 (0.5) | 2 (1.0) | - | |
| 10,000–20,000 | 22 (5.5) | 22 (11.0) | - | |
| 20,000–30,000 | 34 (8.5) | 34 (17.0) | - | |
| 30,000–50,000 | 76 (19.0) | 76 (38.0) | - | |
| 50,000–70,000 | 48 (12.0) | 48 (24.0) | - | |
| 70,000–100,000 | 15 (3.8) | 15 (7.5) | - | |
| More than 100,000 | 3 (0.8) | 3 (1.5) | - | |
| Single spending amount (CNY) | - | |||
| Below 50 | 31 (7.8) | - | 31 (15.5) | |
| 50–99 | 74 (18.5) | - | 74 (37.0) | |
| 100–199 | 59 (14.8) | - | 59 (29.5) | |
| 200–299 | 25 (6.3) | - | 25 (12.5) | |
| 300–399 | 5 (1.3) | - | 5 (2.5) | |
| More than 400 | 6 (1.5) | - | 6 (3.0) | |
| Online grocery shopping channels1) | - | |||
| Online shopping platforms (Coupang, Meituan maicai, etc.) | 283 (29.9) | 162 (36.4) | 121 (24.2) | |
| Online supermarket mall (E-mart mall, Rt-mart mall, etc.) | 231 (24.4) | 98 (22.0) | 133 (26.5) | |
| Food specializing mall (Oasis, Womai, etc.) | 142 (15.0) | 83 (18.7) | 59 (11.8) | |
| Home shopping (CJ O-shopping, CNRmall, etc.) | 117 (12.4) | 35 (7.9) | 82 (16.4) | |
| Quick commerce (B-mart, Dingdong [Cayman] limited, etc.) | 102 (10.8) | 25 (5.6) | 77 (15.4) | |
| Online department store mall (SSG.com, Jd.com, etc.) | 51 (5.4) | 27 (6.1) | 24 (4.8) | |
| Others | 20 (2.1) | 15 (3.4) | 5 (1.0) | |
| Total | 946 (100.0) | 445 (100.0) | 501 (100.0) | |
| Online grocery shopping types1) | - | |||
| Fruits | 259 (10.6) | 92 (7.6) | 167 (13.7) | |
| Vegetables | 223 (9.2) | 93 (7.7) | 130 (10.6) | |
| Meat | 230 (9.4) | 112 (9.2) | 118 (9.7) | |
| Eggs | 209 (8.6) | 95 (7.8) | 114 (9.3) | |
| Aquatic products | 140 (5.7) | 69 (5.7) | 71 (5.8) | |
| Grains and their products | 184 (7.6) | 101 (8.3) | 83 (6.8) | |
| Milk and dairy products | 269 (11.0) | 126 (10.4) | 143 (11.7) | |
| Ready-to-cook processed foods | 231 (9.5) | 143 (11.8) | 88 (7.2) | |
| Ready-to-eat processed foods | 216 (8.9) | 117 (9.6) | 99 (8.1) | |
| Processed meat products | 183 (7.5) | 95 (7.8) | 88 (7.2) | |
| Processed seafood products | 120 (4.9) | 77 (6.3) | 43 (3.5) | |
| Other processed foods | 172 (7.1) | 94 (7.7) | 78 (6.4) | |
| Total | 2,436 (100.0) | 1,214 (100.0) | 1,222 (100.0) |
Table 3.Attribute-consequence-value coding content
| Category1) | Total (n = 400) | Korean (n = 200) | Chinese (n = 200) |
|---|---|---|---|
| Attributes | |||
| 1. Cross-platform service | 21 (1.8) | 7 (1.2) | 14 (2.3) |
| 2. Delivery service | 192 (16.0) | 102 (17.0) | 90 (15.0) |
| 3. After-sales service | 105 (8.8) | 16 (2.7) | 89 (14.8) |
| 4. Search service | 44 (3.7) | 13 (2.2) | 31 (5.2) |
| 5. Internet homepage and application | 57 (4.8) | 35 (5.8) | 22 (3.6) |
| 6. Technology innovation | 15 (1.3) | 3 (0.5) | 12 (2.0) |
| 7. Review | 85 (7.1) | 36 (6.0) | 49 (8.2) |
| 8. Platform reputation | 38 (3.2) | 7 (1.2) | 31 (5.2) |
| 9. Marketing promotions | 79 (6.6) | 50 (8.3) | 29 (4.8) |
| 10. Safety | 31 (2.6) | 11 (1.8) | 20 (3.3) |
| 11. Packaging | 25 (2.1) | 14 (2.3) | 11 (1.8) |
| 12. Brand | 24 (2.0) | 11 (1.8) | 13 (2.2) |
| 13. Price | 157 (13.1) | 114 (19.0) | 43 (7.2) |
| 14. Type | 56 (4.7) | 25 (4.2) | 31 (5.2) |
| 15. Freshness | 111 (9.3) | 73 (12.2) | 38 (6.3) |
| 16. Quality | 110 (9.2) | 67 (11.2) | 43 (7.2) |
| 17. Distance perception | 4 (0.3) | 3 (0.5) | 1 (0.2) |
| 18. Weather factor | 5 (0.4) | 0 (0.0) | 5 (0.8) |
| 19. Transmission of disease | 0 (0.0) | 0 (0.0) | 0 (0.0) |
| 20. Work factor | 5 (0.4) | 1 (0.2) | 4 (0.7) |
| 21. Home factor | 5 (0.4) | 0 (0.0) | 5 (0.8) |
| 22. Living status | 10 (0.8) | 1 (0.2) | 9 (1.5) |
| 23. Consumption burden | 21 (1.8) | 11 (1.8) | 10 (1.7) |
| Total | 1,200 (100.0) | 600 (100.0) | 600 (100.0) |
| Consequence | |||
| 24. Convenient access | 262 (7.3) | 131 (7.3) | 131 (7.3) |
| 25. Delivery on time | 285 (7.9) | 139 (7.7) | 146 (8.1) |
| 26. Save time | 430 (11.9) | 227 (12.6) | 203 (11.3) |
| 27. Stay on budget | 221 (6.1) | 82 (4.6) | 139 (7.7) |
| 28. Stress decrease | 173 (4.8) | 44 (2.4) | 129 (7.2) |
| 29. Problem solving | 220 (6.1) | 43 (2.4) | 177 (9.8) |
| 30. Service guarantee | 209 (5.8) | 45 (2.5) | 164 (9.1) |
| 31. Product comparison | 165 (4.6) | 73 (4.1) | 92 (5.1) |
| 32. Price comparison | 248 (6.9) | 163 (9.1) | 85 (4.7) |
| 33. Grocery supplies | 132 (3.7) | 80 (4.4) | 52 (2.9) |
| 34. No need to go out | 180 (5.0) | 127 (7.1) | 53 (2.9) |
| 35. Sensory quality | 90 (2.5) | 48 (2.7) | 42 (2.3) |
| 36. Food security | 180 (5.0) | 121 (6.7) | 59 (3.3) |
| 37. Financial savings | 185 (5.1) | 158 (8.8) | 27 (1.5) |
| 38. Free choice | 89 (2.5) | 39 (2.2) | 50 (2.8) |
| 39. Can do other things | 58 (1.6) | 35 (1.9) | 23 (1.3) |
| 40. Making a difference | 20 (0.6) | 6 (0.3) | 14 (0.8) |
| 41. Avoid for health | 32 (0.9) | 18 (1.0) | 14 (0.8) |
| 42. Bulk purchase | 45 (1.3) | 23 (1.3) | 22 (1.2) |
| 43. Fast shipping | 306 (8.5) | 154 (8.6) | 152 (8.4) |
| 44. Consumption promotion | 70 (1.9) | 44 (2.4) | 26 (1.4) |
| Total | 3,600 (100.0) | 1,800 (100.0) | 1,800 (100.0) |
| Value | |||
| 45. Universal | 210 (5.8) | 84 (4.7) | 126 (7.0) |
| 46. Convenience | 1,015 (28.2) | 663 (36.8) | 352 (19.6) |
| 47. Economic | 743 (20.6) | 479 (26.6) | 264 (14.7) |
| 48. Hedonic | 195 (5.4) | 39 (2.2) | 156 (8.7) |
| 49. Superiority | 303 (8.4) | 70 (3.9) | 233 (12.9) |
| 50. Ease of use | 222 (6.2) | 82 (4.6) | 140 (7.8) |
| 51. Compatible | 164 (4.6) | 37 (2.1) | 127 (7.0) |
| 52. Normative | 159 (4.4) | 10 (0.6) | 149 (8.3) |
| 53. Stability | 254 (7.1) | 132 (7.3) | 122 (6.8) |
| 54. Trust | 335 (9.3) | 204 (11.3) | 131 (7.3) |
| Total | 3,600 (100.0) | 1,800 (100.0) | 1,800 (100.0) |
Table 4.Implication matrix between attributes and consequences of Korean consumers (n = 200)
Table 5.Implication matrix between consequences and values of Korean consumers (n = 200)
Table 6.Implication matrix between attributes and consequences of Chinese consumers (n = 200)
Table 7.Implication matrix between consequences and values of Chinese consumers (n = 200)
- 1. Lee MS. A qualitative study on consumer’s online food purchase experience and the influencing factors of purchase and user satisfaction. [master’s thesis]. Yonsei University; 2022.
- 2. Xi G, Zhen F, Cao X, Xu F. The interaction between e-shopping and store shopping: empirical evidence from Nanjing, China. Transp Lett 2020; 12(3): 157-165.Article
- 3. Chevalier S. Retail e-commerce sales worldwide from 2014 to 2027 [Internet]. Statista; 2024 [cited 2024 Jul 10]. Available from: https://www.statista.com/statistics/379046/worldwide-retail-e-commerce-sales/
- 4. Gielens K, Steenkamp JBEM. Branding in the era of digital (dis)intermediation. Int J Res Mark 2019; 36(3): 367-384.Article
- 5. Kim H. Use of mobile grocery shopping application: motivation and decision-making process among South Korean consumers. J Theor Appl Electron Commer Res 2021; 16(7): 2672-2693.Article
- 6. KOrean Statistical Information Service (KOSIS). Transaction value of online shopping mall by commodity groups/sales channel [Internet]. KOSIS; 2024 [cited 2024 Aug 7]. Available from: https://kosis.kr/statHtml/statHtml.do?orgId=101&tblId=DT_1KE10071&conn_path=I2&language=en
- 7. Ministry of Commerce of the People’s Republic of China. [China online retail market development report 2023] [Internet]. Ministry of Commerce of the People’s Republic of China; 2023 [cited 2024 Aug 8]. Available from: https://cif.mofcom.gov.cn/cif/html/upload/20240313102933492_2023%E5%B9%B4%E4%B8%AD%E5%9B%BD%E7%BD%91%E7%BB%9C%E9%9B%B6%E5%94%AE%E5%B8%82%E5%9C%BA%E5%8F%91%E5%B1%95%E6%8A%A5%E5%91%8A.pdf. Chinese
- 8. ECRC. [The scale of the fresh food e-commerce market will approach 650 billion yuan in 2023, and the total financing amount will drop by more than 70% year-on-year] [Internet]. ECRC; 2024 [cited 2024 Aug 8]. Available from: https://www.100ec.cn/detail--6638102.html. Chinese
- 9. Mortimer G, Fazal HS, Martin J. Online grocery shopping: the impact of shopping frequency on perceived risk. Int Rev Retail Distribution Consum Res 2016; 26(2): 202-223.Article
- 10. Ramus K, Asger Nielsen N. Online grocery retailing: what do consumers think? Internet Res 2005; 15(3): 335-352.Article
- 11. Frank DA, Peschel AO. Sweetening the deal: the ingredients that drive consumer adoption of online grocery shopping. J Food Prod Mark 2020; 26(8): 535-544.Article
- 12. Hsiao C, Ju Rebecca Yen H, Li EY. Exploring consumer value of multi‐channel shopping: a perspective of means‐end theory. Internet Res 2012; 22(3): 318-339.Article
- 13. Nguyen TH, Ngo HQ, Dương TT, Adeola O. Motivations influencing virtual supermarket shopping: an exploratory study using means-end chains analysis. Cogent Bus Manag 2021; 8(1): 1954491.Article
- 14. Zeithaml VA. Consumer perceptions of price, quality, and value: a means-end model and synthesis of evidence. J Mark 1988; 52(3): 2-22.ArticleLink
- 15. Monroe KB, Chapman JD. Framing effects on buyers’ subjective product evaluations. Advances Consum Res 1987; 14(1): 193-197.
- 16. Hsin Chang H, Wang H. The moderating effect of customer perceived value on online shopping behavior. Online Inf Rev 2011; 35(3): 333-359.
- 17. Mohd-Any AA, Winklhofer H, Ennew C. Measuring users’ value experience on a travel website (e-value): what value is cocreated by the user? J Travel Res 2015; 54(4): 496-510.
- 18. Dastane O, Goi CL, Rabbanee FK. The development and validation of a scale to measure perceived value of mobile commerce (MVAL-SCALE). J Retail Consum Serv 2023; 71: 103222.Article
- 19. Chen Z, Dubinsky AJ. A conceptual model of perceived customer value in e-commerce: a preliminary investigation. Psychol Mark 2003; 20(4): 323-347.Article
- 20. Choi J, Jang S, Choi JY. Determinants of selection behavior in online distribution channels for fresh food. Int J Consum Stud 2022; 46(6): 2318-2332.ArticleLink
- 21. Zheng Q, Chen J, Zhang R, Wang HH. What factors affect Chinese consumers’ online grocery shopping? Product attributes, e-vendor characteristics and consumer perceptions. China Agric Econ Rev 2020; 12(2): 193-213.Article
- 22. Wang HH, Han X, Jiang Y, Wu G. Revealed consumers’ preferences for fresh produce attributes in Chinese online markets: a case of domestic and imported apples. PLoS One 2022; 17(6): e0270257.ArticlePubMedPMC
- 23. Costa AIA, Dekker M, Jongen WMF. An overview of means-end theory: potential application in consumer-oriented food product design. Trends Food Sci Technol 2004; 15(7-8): 403-415.Article
- 24. Reynolds TJ, Olson JC. Understanding consumer decision making. Routledge; 2001. p. 1-466.
- 25. Sankaran R, Chakraborty S. Why customers make mobile payments? Applying a means-end chain approach. Mark Intell Plan 2021; 39(1): 109-124.Article
- 26. Al-Abdullatif AM, Aladsani HK. Understanding instructors’ cognitive structure toward the academic use of social network sites: the means-end chain theory. Sage Open 2021; 11(3): 21582440211029927.ArticleLink
- 27. Wen J, Huang S. Chinese tourists’ motivations of visiting a highly volatile destination: a means-end approach. Tour Recreat Res 2019; 45(1): 80-93.Article
- 28. Jeng MY, Yeh TM, Pai FY. Analyzing older adults’ perceived values of using smart bracelets by means-end chain. Healthcare (Basel) 2020; 8(4): 494.ArticlePubMedPMC
- 29. Bradburn NM, Sudman S, Wansink B. Asking questions: the definitive guide to questionnaire design -- for market research, political polls, and social and health questionnaires. 2nd ed. Jossey-Bass; 2004. p. 21-29.
- 30. Russell CG, Flight I, Leppard P, van Lawick van Pabst JA, Syrette JA, Cox DN. A comparison of paper-and-pencil and computerised methods of “hard” laddering. Food Qual Prefer 2004; 15(3): 279-291.Article
- 31. Diedericks L, Erasmus AC, Donoghue S. Now is the time to embrace interactive electronic applications of Association Pattern Technique. J Retail Consum Serv 2020; 56: 102191.Article
- 32. Hand C, Dall’Olmo Riley F, Harris P, Singh J, Rettie R. Online grocery shopping: the influence of situational factors. Eur J Mark 2009; 43(9/10): 1205-1219.Article
- 33. Kang C, Moon J, Kim T, Choe Y. Why consumers go to online grocery: comparing vegetables with grains. Proceedings of 2016 49th Hawaii International Conference on System Sciences (HICSS); 2016 Jan 5-8; HI, USA. p. 3604-3613.Article
- 34. Chocarro R, Cortiñas M, Villanueva ML. Situational variables in online versus offline channel choice. Electron Commer Res Appl 2013; 12(5): 347-361.Article
- 35. Liu B. Analysis of factors influencing online grocery shopping by Korean and Chinese consumers: application of behavioral reasoning theory and technology continuance theory. [dissertation]. Kookmin University; 2023.
- 36. Vanden Abeele V, Hauters E, Zaman B. Increasing the reliability and validity of quantitative laddering data with LadderUX. Proceedings of CHI '12 Extended Abstracts on Human Factors in Computing Systems (CHI EA ‘12); 2012 May 5-10; NY, USA. p. 2057-2062.
- 37. Kilwinger FBM, van Dam YK. Methodological considerations on the means-end chain analysis revisited. Psychol Mark 2021; 38(9): 1513-1524.ArticleLink
- 38. Alba J, Lynch J, Weitz B, Janiszewski C, Lutz R, Sawyer A, et al. Interactive home shopping: consumer, retailer, and manufacturer incentives to participate in electronic marketplaces. J Mark 1997; 61(3): 38-53.ArticleLink
- 39. To PL, Liao C, Lin TH. Shopping motivations on internet: a study based on utilitarian and hedonic value. Technovation 2007; 27(12): 774-787.Article
- 40. Kim J. Analysis for growth potential in response to changes in the online food market. Sustainability 2020; 12(11): 4386.Article
- 41. Singh R, Rosengren S. Why do online grocery shoppers switch? An empirical investigation of drivers of switching in online grocery. J Retail Consum Serv 2020; 53: 101962.Article
- 42. Driediger F, Bhatiasevi V. Online grocery shopping in Thailand: consumer acceptance and usage behavior. J Retail Consum Serv 2019; 48: 224-237.Article
REFERENCES
Figure & Data
REFERENCES
Citations
Citations to this article as recorded by 
- Beyond the stage: how performing arts tourism shapes tourist perceptions and destination image
Islam Elbayoumi Salem, Mohammed Ali Bait Ali Sulaiman, Enrico di Bella, Sara Preti, Mohamed Kamal Abdien, Ahmed Magdy
Journal of Hospitality and Tourism Insights.2026; 9(1): 375. CrossRef - Decoding digital market power: a network-based framework for consumer behaviour and strategic advantage
Larissa M. Batrancea, Ömer Akgüller, Mehmet Ali Balcı, Anca Nichita, Mircea-Iosif Rus
Journal of Marketing Analytics.2026;[Epub] CrossRef
 Cite
CiteExploring the customer perceived value of online grocery shopping: a cross-sectional study of Korean and Chinese consumers using Means-End Chain theory
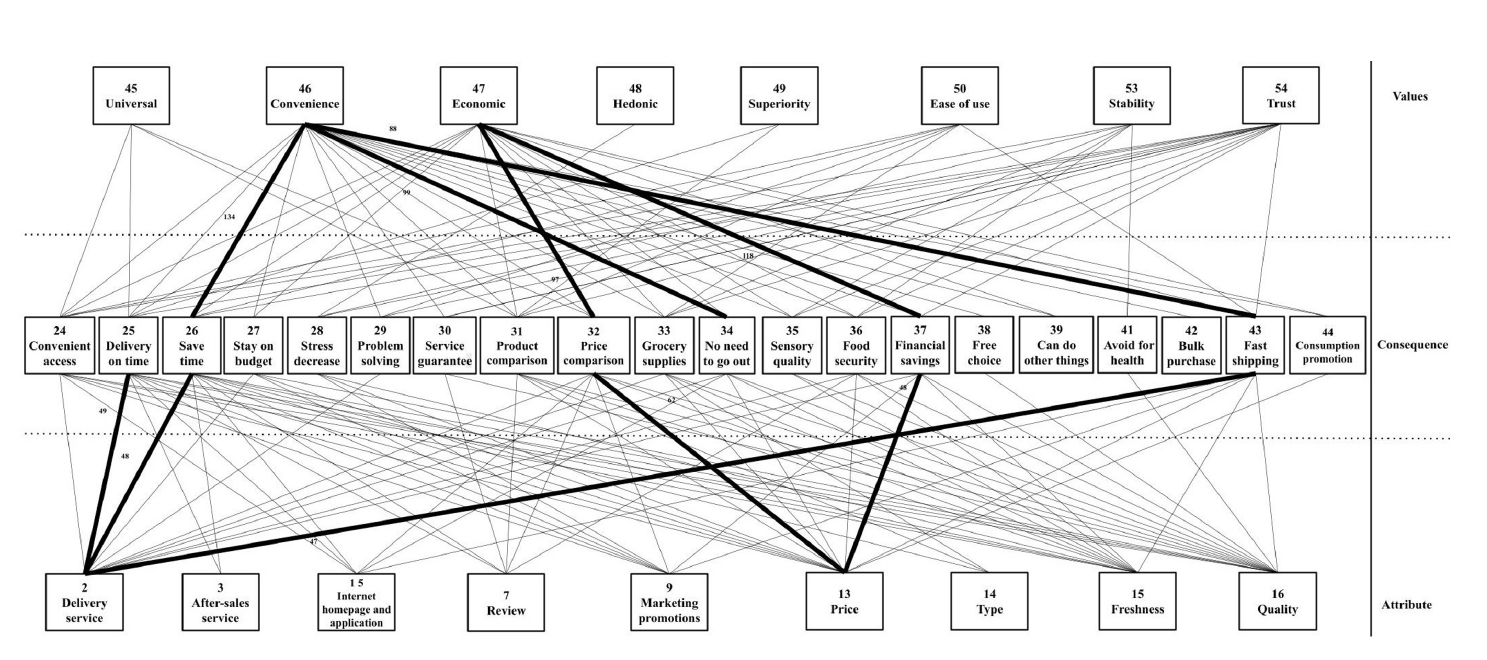
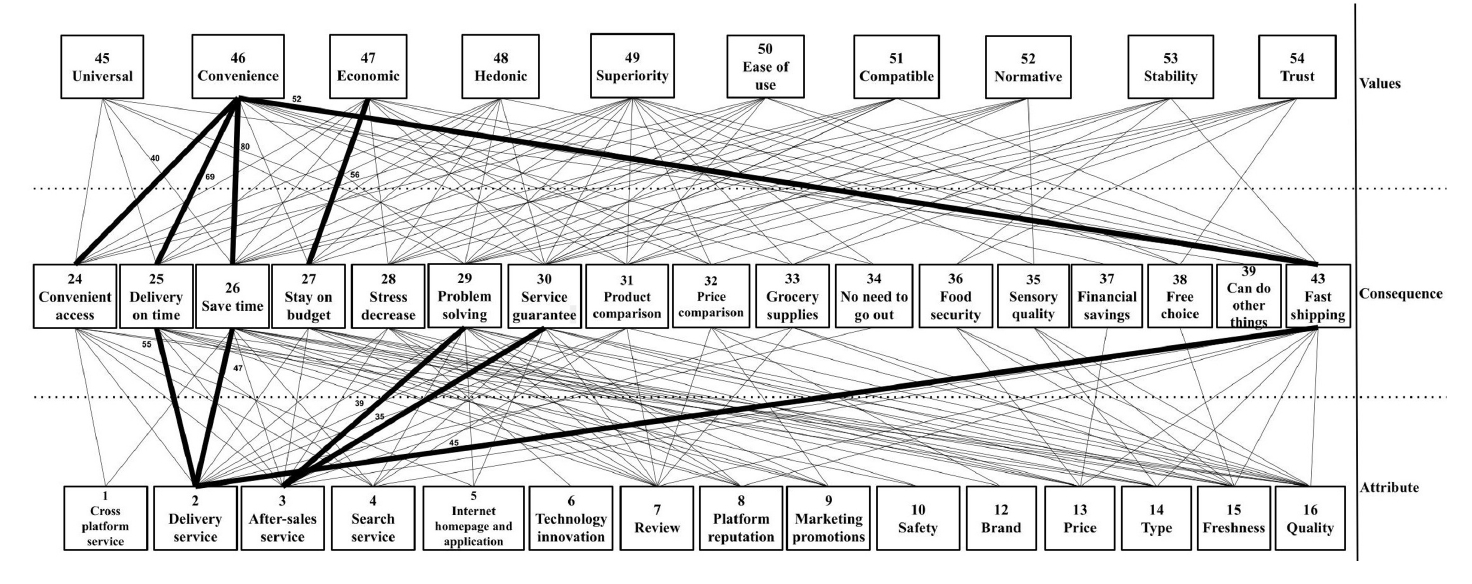
Fig. 1. Hierarchical value map of Korean consumers (cut-off = 7). Links that have less than 7 mentions are not displayed. Each line represents the perceived association of online grocery shopping consumers. The five lines with the highest number of associations are bolded, indicating more referenced associations.
Fig. 2. Hierarchical value map of Chinese consumers (cut-off = 7). Links that have less than 7 mentions are not displayed. Each line represents the perceived association of online grocery shopping consumers. The five lines with the highest number of associations are bolded, indicating more referenced associations.
Fig. 1.
Fig. 2.
Exploring the customer perceived value of online grocery shopping: a cross-sectional study of Korean and Chinese consumers using Means-End Chain theory
| Characteristic | Total (n = 400) | Korean (n = 200) | Chinese (n = 200) | χ2 |
|---|---|---|---|---|
| Gender | 0.000 | |||
| Man | 200 (50.0) | 100 (50.0) | 100 (50.0) | |
| Woman | 200 (50.0) | 100 (50.0) | 100 (50.0) | |
| Age (year) | 0.200 | |||
| 20–29 | 80 (20.0) | 40 (20.0) | 40 (20.0) | |
| 30–39 | 78 (19.5) | 40 (20.0) | 38 (19.0) | |
| 40–49 | 78 (19.5) | 40 (20.0) | 38 (19.0) | |
| 50–59 | 82 (20.5) | 40 (20.0) | 42 (21.0) | |
| ≥ 60 | 82 (20.5) | 40 (20.0) | 42 (21.0) | |
| Education | 4.315 | |||
| Junior high school | 6 (1.5) | 1 (0.5) | 5 (2.5) | |
| High school | 44 (11.0) | 26 (13.0) | 18 (9.0) | |
| Bachelor’s | 294 (73.5) | 144 (72.0) | 150 (75.0) | |
| Master’s or above | 56 (14.0) | 29 (14.5) | 27 (13.5) | |
| Occupation | 43.899 |
|||
| Office worker | 213 (53.3) | 94 (47.0) | 119 (59.5) | |
| Student | 34 (8.5) | 12 (6.0) | 22 (11.0) | |
| Homemaker | 33 (8.3) | 28 (14.0) | 5 (2.5) | |
| Self-employed | 26 (6.5) | 15 (7.5) | 11 (5.5) | |
| Specialized worker | 25 (6.3) | 22 (11.0) | 3 (1.5) | |
| Service industrial | 23 (5.8) | 11 (5.5) | 12 (6.0) | |
| Public official | 11 (2.8) | 2 (1.0) | 9 (4.5) | |
| Production worker | 11 (2.8) | 3 (1.5) | 8 (4.0) | |
| Others | 24 (6.0) | 13 (6.5) | 11 (5.5) | |
| Monthly income | - | |||
| Below 1,000,000 KRW or 4,000 CNY | 34 (8.5) | 15 (7.5) | 19 (9.5) | |
| 1,000,000-2,999,999 KRW or 4,000–5,999 CNY | 84 (21.0) | 57 (28.5) | 27 (13.5) | |
| 3,000,000–4,999,999 KRW or 6,000–7,999 CNY | 107 (26.8) | 66 (33.0) | 41 (20.5) | |
| 5,000,000–6,999,999 KRW or 8,000–9,999 CNY | 70 (17.5) | 29 (14.5) | 41 (20.5) | |
| More than 7,000,000 KRW or 10,000 CNY | 93 (23.3) | 26 (13.0) | 67 (33.5) | |
| No regular income | 12 (3.0) | 7 (3.5) | 5 (2.5) | |
| Composition of a family | 45.836 |
|||
| 1 | 50 (12.5) | 41 (20.5) | 9 (4.5) | |
| 2 | 66 (16.5) | 44 (22.0) | 22 (11.0) | |
| 3 | 134 (33.5) | 51 (25.5) | 83 (41.5) | |
| 4 | 110 (27.5) | 53 (26.5) | 57 (28.5) | |
| 5 | 34 (8.5) | 11 (5.5) | 23 (11.5) | |
| More than 6 | 6 (1.5) | 0 (0.0) | 6 (3.0) |
| Dimension | Total (n = 400) | Korean (n = 200) | Chinese (n = 200) | χ2 |
|---|---|---|---|---|
| Online purchaser | 2.670 | |||
| Self | 364 (91.0) | 179 (89.5) | 185 (92.5) | |
| Parents | 22 (5.5) | 11 (5.5) | 11 (5.5) | |
| Others | 14 (3.5) | 10 (5.0) | 4 (2.0) | |
| Online frequency increase | 12.676 |
|||
| Absolutely not | 8 (2.0) | 3 (1.5) | 5 (2.5) | |
| Maybe not | 29 (7.3) | 10 (5.0) | 19 (9.5) | |
| Ordinary | 135 (33.8) | 80 (40.0) | 55 (27.5) | |
| Maybe yes | 181 (45.3) | 91 (45.5) | 90 (45.0) | |
| Absolutely yes | 47 (11.8) | 16(8.0) | 31 (15.5) | |
| Online frequency | 50.609 |
|||
| Daily | 23 (5.8) | 2 (1.0) | 21 (10.5) | |
| Once every 2–3 days | 149 (37.3) | 54 (27.0) | 95 (47.5) | |
| Once every week | 115 (28.8) | 64 (32.0) | 51 (25.5) | |
| 2–3 times a month | 83 (20.8) | 57 (28.5) | 26 (13.0) | |
| Once every month | 20 (5.0) | 16 (8.0) | 4 (2.0) | |
| Once every 2–3 months | 10 (2.5) | 7 (3.5) | 3 (1.5) | |
| Shopping channel | 15.403 |
|||
| Almost all through physical stores | 25 (6.3) | 19 (9.5) | 6 (3.0) | |
| Physical stores more than online | 82 (20.5) | 50 (25.0) | 32 (16.0) | |
| Half and half | 139 (34.8) | 67 (33.5) | 72 (36.0) | |
| Online more than physical stores | 113 (28.3) | 46 (23.0) | 67 (33.5) | |
| Almost all through online | 41 (10.3) | 18 (9.0) | 23 (11.5) | |
| Single spending amount (KRW) | - | |||
| Below 10,000 | 2 (0.5) | 2 (1.0) | - | |
| 10,000–20,000 | 22 (5.5) | 22 (11.0) | - | |
| 20,000–30,000 | 34 (8.5) | 34 (17.0) | - | |
| 30,000–50,000 | 76 (19.0) | 76 (38.0) | - | |
| 50,000–70,000 | 48 (12.0) | 48 (24.0) | - | |
| 70,000–100,000 | 15 (3.8) | 15 (7.5) | - | |
| More than 100,000 | 3 (0.8) | 3 (1.5) | - | |
| Single spending amount (CNY) | - | |||
| Below 50 | 31 (7.8) | - | 31 (15.5) | |
| 50–99 | 74 (18.5) | - | 74 (37.0) | |
| 100–199 | 59 (14.8) | - | 59 (29.5) | |
| 200–299 | 25 (6.3) | - | 25 (12.5) | |
| 300–399 | 5 (1.3) | - | 5 (2.5) | |
| More than 400 | 6 (1.5) | - | 6 (3.0) | |
| Online grocery shopping channels |
- | |||
| Online shopping platforms (Coupang, Meituan maicai, etc.) | 283 (29.9) | 162 (36.4) | 121 (24.2) | |
| Online supermarket mall (E-mart mall, Rt-mart mall, etc.) | 231 (24.4) | 98 (22.0) | 133 (26.5) | |
| Food specializing mall (Oasis, Womai, etc.) | 142 (15.0) | 83 (18.7) | 59 (11.8) | |
| Home shopping (CJ O-shopping, CNRmall, etc.) | 117 (12.4) | 35 (7.9) | 82 (16.4) | |
| Quick commerce (B-mart, Dingdong [Cayman] limited, etc.) | 102 (10.8) | 25 (5.6) | 77 (15.4) | |
| Online department store mall (SSG.com, Jd.com, etc.) | 51 (5.4) | 27 (6.1) | 24 (4.8) | |
| Others | 20 (2.1) | 15 (3.4) | 5 (1.0) | |
| Total | 946 (100.0) | 445 (100.0) | 501 (100.0) | |
| Online grocery shopping types1) | - | |||
| Fruits | 259 (10.6) | 92 (7.6) | 167 (13.7) | |
| Vegetables | 223 (9.2) | 93 (7.7) | 130 (10.6) | |
| Meat | 230 (9.4) | 112 (9.2) | 118 (9.7) | |
| Eggs | 209 (8.6) | 95 (7.8) | 114 (9.3) | |
| Aquatic products | 140 (5.7) | 69 (5.7) | 71 (5.8) | |
| Grains and their products | 184 (7.6) | 101 (8.3) | 83 (6.8) | |
| Milk and dairy products | 269 (11.0) | 126 (10.4) | 143 (11.7) | |
| Ready-to-cook processed foods | 231 (9.5) | 143 (11.8) | 88 (7.2) | |
| Ready-to-eat processed foods | 216 (8.9) | 117 (9.6) | 99 (8.1) | |
| Processed meat products | 183 (7.5) | 95 (7.8) | 88 (7.2) | |
| Processed seafood products | 120 (4.9) | 77 (6.3) | 43 (3.5) | |
| Other processed foods | 172 (7.1) | 94 (7.7) | 78 (6.4) | |
| Total | 2,436 (100.0) | 1,214 (100.0) | 1,222 (100.0) |
| Category |
Total (n = 400) | Korean (n = 200) | Chinese (n = 200) |
|---|---|---|---|
| Attributes | |||
| 1. Cross-platform service | 21 (1.8) | 7 (1.2) | 14 (2.3) |
| 2. Delivery service | 192 (16.0) | 102 (17.0) | 90 (15.0) |
| 3. After-sales service | 105 (8.8) | 16 (2.7) | 89 (14.8) |
| 4. Search service | 44 (3.7) | 13 (2.2) | 31 (5.2) |
| 5. Internet homepage and application | 57 (4.8) | 35 (5.8) | 22 (3.6) |
| 6. Technology innovation | 15 (1.3) | 3 (0.5) | 12 (2.0) |
| 7. Review | 85 (7.1) | 36 (6.0) | 49 (8.2) |
| 8. Platform reputation | 38 (3.2) | 7 (1.2) | 31 (5.2) |
| 9. Marketing promotions | 79 (6.6) | 50 (8.3) | 29 (4.8) |
| 10. Safety | 31 (2.6) | 11 (1.8) | 20 (3.3) |
| 11. Packaging | 25 (2.1) | 14 (2.3) | 11 (1.8) |
| 12. Brand | 24 (2.0) | 11 (1.8) | 13 (2.2) |
| 13. Price | 157 (13.1) | 114 (19.0) | 43 (7.2) |
| 14. Type | 56 (4.7) | 25 (4.2) | 31 (5.2) |
| 15. Freshness | 111 (9.3) | 73 (12.2) | 38 (6.3) |
| 16. Quality | 110 (9.2) | 67 (11.2) | 43 (7.2) |
| 17. Distance perception | 4 (0.3) | 3 (0.5) | 1 (0.2) |
| 18. Weather factor | 5 (0.4) | 0 (0.0) | 5 (0.8) |
| 19. Transmission of disease | 0 (0.0) | 0 (0.0) | 0 (0.0) |
| 20. Work factor | 5 (0.4) | 1 (0.2) | 4 (0.7) |
| 21. Home factor | 5 (0.4) | 0 (0.0) | 5 (0.8) |
| 22. Living status | 10 (0.8) | 1 (0.2) | 9 (1.5) |
| 23. Consumption burden | 21 (1.8) | 11 (1.8) | 10 (1.7) |
| Total | 1,200 (100.0) | 600 (100.0) | 600 (100.0) |
| Consequence | |||
| 24. Convenient access | 262 (7.3) | 131 (7.3) | 131 (7.3) |
| 25. Delivery on time | 285 (7.9) | 139 (7.7) | 146 (8.1) |
| 26. Save time | 430 (11.9) | 227 (12.6) | 203 (11.3) |
| 27. Stay on budget | 221 (6.1) | 82 (4.6) | 139 (7.7) |
| 28. Stress decrease | 173 (4.8) | 44 (2.4) | 129 (7.2) |
| 29. Problem solving | 220 (6.1) | 43 (2.4) | 177 (9.8) |
| 30. Service guarantee | 209 (5.8) | 45 (2.5) | 164 (9.1) |
| 31. Product comparison | 165 (4.6) | 73 (4.1) | 92 (5.1) |
| 32. Price comparison | 248 (6.9) | 163 (9.1) | 85 (4.7) |
| 33. Grocery supplies | 132 (3.7) | 80 (4.4) | 52 (2.9) |
| 34. No need to go out | 180 (5.0) | 127 (7.1) | 53 (2.9) |
| 35. Sensory quality | 90 (2.5) | 48 (2.7) | 42 (2.3) |
| 36. Food security | 180 (5.0) | 121 (6.7) | 59 (3.3) |
| 37. Financial savings | 185 (5.1) | 158 (8.8) | 27 (1.5) |
| 38. Free choice | 89 (2.5) | 39 (2.2) | 50 (2.8) |
| 39. Can do other things | 58 (1.6) | 35 (1.9) | 23 (1.3) |
| 40. Making a difference | 20 (0.6) | 6 (0.3) | 14 (0.8) |
| 41. Avoid for health | 32 (0.9) | 18 (1.0) | 14 (0.8) |
| 42. Bulk purchase | 45 (1.3) | 23 (1.3) | 22 (1.2) |
| 43. Fast shipping | 306 (8.5) | 154 (8.6) | 152 (8.4) |
| 44. Consumption promotion | 70 (1.9) | 44 (2.4) | 26 (1.4) |
| Total | 3,600 (100.0) | 1,800 (100.0) | 1,800 (100.0) |
| Value | |||
| 45. Universal | 210 (5.8) | 84 (4.7) | 126 (7.0) |
| 46. Convenience | 1,015 (28.2) | 663 (36.8) | 352 (19.6) |
| 47. Economic | 743 (20.6) | 479 (26.6) | 264 (14.7) |
| 48. Hedonic | 195 (5.4) | 39 (2.2) | 156 (8.7) |
| 49. Superiority | 303 (8.4) | 70 (3.9) | 233 (12.9) |
| 50. Ease of use | 222 (6.2) | 82 (4.6) | 140 (7.8) |
| 51. Compatible | 164 (4.6) | 37 (2.1) | 127 (7.0) |
| 52. Normative | 159 (4.4) | 10 (0.6) | 149 (8.3) |
| 53. Stability | 254 (7.1) | 132 (7.3) | 122 (6.8) |
| 54. Trust | 335 (9.3) | 204 (11.3) | 131 (7.3) |
| Total | 3,600 (100.0) | 1,800 (100.0) | 1,800 (100.0) |
| 24 | 25 | 26 | 27 | 28 | 29 | 30 | 31 | 32 | 33 | 34 | 35 | 36 | 37 | 38 | 39 | 40 | 41 | 42 | 43 | 44 | |
|---|---|---|---|---|---|---|---|---|---|---|---|---|---|---|---|---|---|---|---|---|---|
| 1 | 4|0 | 4|0 | 4|0 | 2|0 | - | 1|0 | 1|0 | - | 2|0 | 1|0 | - | - | - | - | - | 1|0 | - | - | - | - | 1|0 |
| 2 | 27|0 | 49|0 | 48|0 | 7|0 | 3|0 | 9|0 | 3|0 | 4|0 | 20|0 | 12|0 | 34|0 | 4|0 | 12|0 | 14|0 | 4|0 | 6|0 | 1|0 | - | 4|0 | 47|0 | 1|0 |
| 3 | 4|0 | 7|0 | 7|0 | - | 2|0 | 5|0 | 4|0 | 2|0 | 2|0 | - | 2|0 | 1|0 | 2|0 | 3|0 | 1|0 | 2|0 | - | - | - | 3|0 | 1|0 |
| 4 | 5|0 | 4|0 | 6|0 | 2|0 | 3|0 | - | 1|0 | 1|0 | 2|0 | 2|0 | 3|0 | - | 2|0 | 4|0 | 1|0 | 1|0 | - | - | - | 2|0 | - |
| 5 | 20|0 | 15|0 | 19|0 | 1|0 | 1|0 | 2|0 | 1|0 | 3|0 | 8|0 | 2|0 | 7|0 | 1|0 | 4|0 | 4|0 | 3|0 | 1|0 | - | - | - | 12|0 | 1|0 |
| 6 | 1|0 | - | 1|0 | 1|0 | - | - | - | - | 1|0 | - | - | - | 1|0 | 2|0 | 1|0 | - | - | - | 1|0 | - | - |
| 7 | 6|0 | 7|0 | 16|0 | 6|0 | 3|0 | 3|0 | 7|0 | 15|0 | 9|0 | 1|0 | 5|0 | 2|0 | 8|0 | 6|0 | 2|0 | - | 1|0 | 2|0 | - | 4|0 | 3|0 |
| 8 | 2|0 | 1|0 | 4|0 | - | - | 1|0 | 1|0 | - | 1|0 | 1|0 | 1|0 | - | - | 1|0 | 2|0 | 2|0 | - | - | - | 3|0 | 1|0 |
| 9 | 8|0 | 9|0 | 21|0 | 11|0 | 8|0 | 6|0 | 3|0 | 3|0 | 21|0 | 4|0 | 6|0 | 4|0 | 3|0 | 23|0 | - | 3|0 | 2|0 | 1|0 | 2|0 | 7|0 | 5|0 |
| 10 | 3|0 | 1|0 | 3|0 | 1|0 | - | 1|0 | 2|0 | - | 4|0 | 3|0 | 6|0 | - | 3|0 | 2|0 | - | 1|0 | - | 1|0 | - | 1|0 | 1|0 |
| 11 | 2|0 | 3|0 | 4|0 | - | 1|0 | 1|0 | 2|0 | 3|0 | 1|0 | 1|0 | 4|0 | - | 6|0 | 2|0 | - | 4|0 | - | 1|0 | - | 6|0 | 1|0 |
| 12 | 2|0 | 1|0 | 4|0 | - | - | 1|0 | - | 3|0 | 4|0 | 2|0 | 3|0 | 1|0 | 2|0 | 4|0 | 1|0 | 1|0 | 1|0 | - | - | 1|0 | 2|0 |
| 13 | 20|0 | 13|0 | 35|0 | 33|0 | 8|0 | 5|0 | 5|0 | 14|0 | 62|0 | 8|0 | 17|0 | 6|0 | 13|0 | 48|0 | 7|0 | 4|0 | - | 2|0 | 6|0 | 22|0 | 12|0 |
| 14 | 5|0 | 3|0 | 8|0 | 4|0 | - | 2|0 | - | 8|0 | 5|0 | 8|0 | 6|0 | 3|0 | 4|0 | 6|0 | 6|0 | 2|0 | 1|0 | - | 1|0 | 2|0 | 3|0 |
| 15 | 13|0 | 10|0 | 24|0 | 4|0 | 7|0 | 3|0 | 4|0 | 9|0 | 10|0 | 16|0 | 18|0 | 15|0 | 30|0 | 17|0 | 4|0 | 3|0 | - | 4|0 | 3|0 | 21|0 | 4|0 |
| 16 | 7|0 | 8|0 | 16|0 | 9|0 | 6|0 | 2|0 | 10|0 | 7|0 | 9|0 | 19|0 | 10|0 | 10|0 | 30|0 | 16|0 | 6|0 | 2|0 | - | 7|0 | 3|0 | 18|0 | 6|0 |
| 17 | 2|0 | 3|0 | 2|0 | - | - | - | - | - | - | - | - | - | - | - | - | - | - | - | 1|0 | 1|0 | - |
| 18 | - | - | - | - | - | - | - | - | - | - | - | - | - | - | - | - | - | - | - | - | - |
| 19 | - | - | - | - | - | - | - | - | - | - | - | - | - | - | - | - | - | - | - | - | - |
| 20 | - | - | 1|0 | - | - | - | - | - | - | - | - | - | 1|0 | - | - | 1|0 | - | - | - | - | - |
| 21 | - | - | - | - | - | - | - | - | - | - | - | - | - | - | - | - | - | - | - | - | - |
| 22 | - | - | - | - | 1|0 | - | - | - | - | - | - | - | - | - | - | - | - | - | - | 1|0 | 1|0 |
| 23 | - | 1|0 | 3|0 | 2|0 | 1|0 | 1|0 | 1|0 | 2|0 | 3|0 | 2|0 | 4|0 | 1|0 | 1|0 | 4|0 | 1|0 | 1|0 | - | - | 1|0 | 3|0 | 1|0 |
| 45 | 46 | 47 | 48 | 49 | 50 | 51 | 52 | 53 | 54 | |
|---|---|---|---|---|---|---|---|---|---|---|
| 24 | 13|0 | 61|0 | 18|0 | 1|0 | 5|0 | 8|0 | - | 1|0 | 8|0 | 16|0 |
| 25 | 8|0 | 72|0 | 22|0 | 3|0 | 8|0 | 3|0 | 2|0 | 1|0 | 5|0 | 15|0 |
| 26 | 6|0 | 134|0 | 48|0 | 1|0 | 6|0 | 8|0 | 3|0 | 2|0 | 6|0 | 12|0 |
| 27 | 3|0 | 13|0 | 58|0 | 2|0 | 1|0 | 1|0 | - | - | 3|0 | 2|0 |
| 28 | 2|0 | 6|0 | 5|0 | 7|0 | 4|0 | 2|0 | 1|0 | 1|0 | 7|0 | 9|0 |
| 29 | 3|0 | 8|0 | 4|0 | 1|0 | 2|0 | 8|0 | 1|0 | - | 6|0 | 10|0 |
| 30 | 4|0 | 7|0 | 5|0 | - | 2|0 | 2|0 | 3|0 | 2|0 | 2|0 | 18|0 |
| 31 | 9|0 | 14|0 | 14|0 | 2|0 | 8|0 | 8|0 | 2|0 | - | 5|0 | 12|0 |
| 32 | 9|0 | 26|0 | 99|0 | 2|0 | 5|0 | 3|0 | 4|0 | 1|0 | 5|0 | 10|0 |
| 33 | 6|0 | 29|0 | 15|0 | 2|0 | - | 8|0 | 1|0 | - | 9|0 | 12|0 |
| 34 | 4|0 | 97|0 | 9|0 | 1|0 | 6|0 | 4|0 | - | - | 3|0 | 2|0 |
| 35 | 1|0 | 9|0 | 8|0 | 2|0 | 1|0 | 2|0 | 3|0 | - | 8|0 | 14|0 |
| 36 | 1|0 | 16|0 | 9|0 | 3|0 | - | 2|0 | 5|0 | - | 48|0 | 38|0 |
| 37 | 3|0 | 15|0 | 118|0 | 1|0 | 3|0 | 3|0 | 6|0 | - | - | 7|0 |
| 38 | 5|0 | 16|0 | 4|0 | 1|0 | 4|0 | 4|0 | 1|0 | 1|0 | - | 3|0 |
| 39 | 1|0 | 21|0 | 7|0 | - | 3|0 | 1|0 | 1|0 | 1|0 | - | - |
| 40 | 1|0 | - | 1|0 | 3|0 | 1|0 | - | - | - | - | - |
| 41 | - | - | 1|0 | 1|0 | 1|0 | - | - | - | 11|0 | 4|0 |
| 42 | - | 19|0 | 2|0 | - | 1|0 | - | - | - | - | - |
| 43 | 3|0 | 88|0 | 25|0 | 2|0 | 5|0 | 9|0 | 2|0 | - | 6|0 | 14|0 |
| 44 | 3|0 | 12|0 | 8|0 | 3|0 | 4|0 | 6|0 | 2|0 | - | - | 6|0 |
| 24 | 25 | 26 | 27 | 28 | 29 | 30 | 31 | 32 | 33 | 34 | 35 | 36 | 37 | 38 | 39 | 40 | 41 | 42 | 43 | 44 | |
|---|---|---|---|---|---|---|---|---|---|---|---|---|---|---|---|---|---|---|---|---|---|
| 1 | 8|0 | 5|0 | 7|0 | 5|0 | 1|0 | 2|0 | 2|0 | 1|0 | 1|0 | - | 2|0 | 1|0 | - | - | - | - | - | - | 1|0 | 6|0 | - |
| 2 | 30|0 | 55|0 | 47|0 | 11|0 | 16|0 | 19|0 | 14|0 | 8|0 | 4|0 | 3|0 | 8|0 | - | 3|0 | 2|0 | 1|0 | 2|0 | - | - | 1|0 | 45|0 | 1|0 |
| 3 | 18|0 | 19|0 | 30|0 | 21|0 | 30|0 | 39|0 | 35|0 | 10|0 | 5|0 | 7|0 | 5|0 | 4|0 | 6|0 | 3|0 | 4|0 | 4|0 | - | 2|0 | 1|0 | 24|0 | 1|0 |
| 4 | 8|0 | 10|0 | 14|0 | 6|0 | 5|0 | 7|0 | 8|0 | 8|0 | 6|0 | 2|0 | 2|0 | 1|0 | - | 1|0 | 3|0 | - | 1|0 | - | - | 8|0 | 3|0 |
| 5 | 11|0 | 6|0 | 4|0 | 4|0 | 2|0 | 8|0 | 7|0 | 5|0 | 3|0 | - | 1|0 | - | 3|0 | 1|0 | 3|0 | 1|0 | 2|0 | - | - | 5|0 | - |
| 6 | 1|0 | 1|0 | 1|0 | 3|0 | 8|0 | 5|0 | 5|0 | 3|0 | 3|0 | 1|0 | 1|0 | - | 1|0 | - | - | - | 1|0 | 1|0 | - | 1|0 | - |
| 7 | 5|0 | 8|0 | 16|0 | 12|0 | 13|0 | 17|0 | 15|0 | 12|0 | 8|0 | 7|0 | 1|0 | 5|0 | 4|0 | - | 6|0 | - | 2|0 | 3|0 | 1|0 | 10|0 | 2|0 |
| 8 | 3|0 | 7|0 | 15|0 | 6|0 | 8|0 | 11|0 | 15|0 | 4|0 | 4|0 | 2|0 | 2|0 | 2|0 | 2|0 | - | - | 1|0 | 1|0 | - | 1|0 | 9|0 | - |
| 9 | 5|0 | 8|0 | 8|0 | 10|0 | 6|0 | 9|0 | 5|0 | 5|0 | 8|0 | 1|0 | 6|0 | - | - | 3|0 | - | 2|0 | 1|0 | 1|0 | 1|0 | 6|0 | 2|0 |
| 10 | 6|0 | 10|0 | 2|0 | 5|0 | 7|0 | 2|0 | 4|0 | 3|0 | 3|0 | - | 2|0 | - | 2|0 | 2|0 | 4|0 | 2|0 | 1|0 | 1|0 | 1|0 | - | 3|0 |
| 11 | 3|0 | 2|0 | 2|0 | 2|0 | 1|0 | 3|0 | 3|0 | 1|0 | - | 3|0 | 2|0 | 1|0 | 1|0 | 1|0 | 4|0 | - | - | 1|0 | 2|0 | 1|0 | - |
| 12 | 1|0 | 1|0 | 5|0 | 11|0 | 2|0 | 1|0 | 3|0 | 3|0 | 3|0 | - | 3|0 | - | 1|0 | - | 1|0 | 1|0 | - | - | - | 2|0 | 1|0 |
| 13 | 5|0 | 4|0 | 17|0 | 20|0 | 8|0 | 8|0 | 5|0 | 5|0 | 14|0 | 1|0 | 3|0 | 2|0 | 7|0 | 7|0 | 6|0 | 1|0 | - | - | 5|0 | 9|0 | 2|0 |
| 14 | 7|0 | 3|0 | 7|0 | 5|0 | 3|0 | 5|0 | 9|0 | 4|0 | 6|0 | 6|0 | 5|0 | 7|0 | 5|0 | 2|0 | 2|0 | 3|0 | - | 1|0 | 2|0 | 8|0 | 3|0 |
| 15 | 1|0 | 8|0 | 7|0 | 7|0 | 5|0 | 16|0 | 10|0 | 6|0 | 3|0 | 7|0 | 1|0 | 9|0 | 10|0 | 2|0 | 8|0 | 2|0 | - | 2|0 | 1|0 | 7|0 | 2|0 |
| 16 | 10|0 | 9|0 | 13|0 | 6|0 | 4|0 | 12|0 | 15|0 | 8|0 | 7|0 | 8|0 | 4|0 | 7|0 | 6|0 | - | 3|0 | - | 2|0 | 3|0 | 1|0 | 10|0 | 2|0 |
| 17 | - | 1|0 | 2|0 | - | - | - | - | - | - | - | - | - | - | - | - | - | - | - | - | - | - |
| 18 | - | 1|0 | 3|0 | 1|0 | 2|0 | 1|0 | - | 1|0 | 1|0 | - | 3|0 | - | - | - | - | 1|0 | - | - | - | - | 1|0 |
| 19 | - | - | - | - | - | - | - | - | - | - | - | - | - | - | - | - | - | - | - | - | - |
| 20 | - | - | 1|0 | - | 2|0 | 2|0 | 1|0 | 1|0 | - | 1|0 | - | - | 1|0 | - | 2|0 | - | - | - | - | 1|0 | - |
| 21 | 2|0 | 2|0 | 2|0 | - | - | 2|0 | 2|0 | - | - | 1|0 | - | - | 1|0 | 1|0 | - | 1|0 | - | - | - | 1|0 | - |
| 22 | - | 1|0 | 5|0 | 2|0 | 2|0 | 3|0 | 1|0 | 1|0 | 2|0 | - | 1|0 | 1|0 | 1|0 | 1|0 | 2|0 | - | 2|0 | - | - | 1|0 | 1|0 |
| 23 | 5|0 | 2|0 | 4|0 | 2|0 | 1|0 | - | 2|0 | 1|0 | 2|0 | - | 1|0 | - | - | 2|0 | 1|0 | 3|0 | - | - | 3|0 | 1|0 | - |
| 45 | 46 | 47 | 48 | 49 | 50 | 51 | 52 | 53 | 54 | |
|---|---|---|---|---|---|---|---|---|---|---|
| 24 | 36|0 | 40|0 | 13|0 | 10|0 | 11|0 | 7|0 | 6|0 | 4|0 | - | 3|0 |
| 25 | 23|0 | 69|0 | 27|0 | 12|0 | 14|0 | 6|0 | 1|0 | 6|0 | 3|0 | 3|0 |
| 26 | 11|0 | 80|0 | 35|0 | 25|0 | 28|0 | 15|0 | 10|0 | 9|0 | 2|0 | 1|0 |
| 27 | 5|0 | 10|0 | 56|0 | 12|0 | 26|0 | 6|0 | 11|0 | 5|0 | 5|0 | 3|0 |
| 28 | 2|0 | 7|0 | 10|0 | 17|0 | 17|0 | 21|0 | 17|0 | 23|0 | 7|0 | 5|0 |
| 29 | 12|0 | 31|0 | 6|0 | 15|0 | 20|0 | 24|0 | 17|0 | 23|0 | 12|0 | 15|0 |
| 30 | 11|0 | 6|0 | 10|0 | 16|0 | 32|0 | 11|0 | 15|0 | 27|0 | 16|0 | 20|0 |
| 31 | 3|0 | 13|0 | 8|0 | 6|0 | 13|0 | 15|0 | 5|0 | 9|0 | 9|0 | 10|0 |
| 32 | 1|0 | 8|0 | 35|0 | 1|0 | 16|0 | 1|0 | 7|0 | 4|0 | 3|0 | 9|0 |
| 33 | 4|0 | 7|0 | 5|0 | 2|0 | 7|0 | - | 3|0 | 5|0 | 7|0 | 10|0 |
| 34 | 2|0 | 16|0 | 5|0 | 4|0 | 9|0 | 5|0 | 5|0 | 1|0 | 3|0 | 3|0 |
| 35 | 1|0 | 4|0 | - | 3|0 | 8|0 | 3|0 | 2|0 | 7|0 | 6|0 | 6|0 |
| 36 | 3|0 | 4|0 | 3|0 | 1|0 | 4|0 | - | - | 6|0 | 27|0 | 7|0 |
| 37 | - | 3|0 | 13|0 | 1|0 | 2|0 | - | 3|0 | - | 2|0 | 4|0 |
| 38 | - | 5|0 | 2|0 | 5|0 | 8|0 | 9|0 | 6|0 | 2|0 | 5|0 | 8|0 |
| 39 | 2|0 | 8|0 | 1|0 | 1|0 | 3|0 | 3|0 | 1|0 | 1|0 | 2|0 | 2|0 |
| 40 | 1|0 | - | 2|0 | - | 1|0 | 1|0 | 1|0 | 4|0 | - | 3|0 |
| 41 | 1|0 | - | - | 1|0 | 2|0 | 1|0 | 1|0 | - | 3|0 | 6|0 |
| 42 | - | 5|0 | 3|0 | 4|0 | 4|0 | 1|0 | - | - | - | 4|0 |
| 43 | 11|0 | 52|0 | 33|0 | 18|0 | 10|0 | 7|0 | 9|0 | 6|0 | 7|0 | 3|0 |
| 44 | 2|0 | 1|0 | - | 2|0 | 2|0 | 5|0 | 2|0 | 2|0 | 2|0 | 6|0 |
Table 1. Demographic characteristics
n (%). KRW, Korean Won; CNY, Chinese Yuan.
Table 2. Online grocery shopping behaviors
n (%). KRW, Korean Won; CNY, Chinese Yuan. Multiple responses.
Table 3. Attribute-consequence-value coding content
n (%). Multiple responses.
Table 4. Implication matrix between attributes and consequences of Korean consumers (n = 200)
0|0, direct linkages; |, indirect linkages; 1–23, attributes; 24–44, consequences.
Table 5. Implication matrix between consequences and values of Korean consumers (n = 200)
0|0, direct linkages; |, indirect linkages; 24–44, consequences; 45–54, values.
Table 6. Implication matrix between attributes and consequences of Chinese consumers (n = 200)
0|0, direct linkages; |, indirect linkages; 1–23, attributes; 24–44, consequences.
Table 7. Implication matrix between consequences and values of Chinese consumers (n = 200)
0|0, direct linkages; |, indirect linkages; 24–44, consequences; 45–54, values.


