
Articles
- Page Path
- HOME > Korean J Community Nutr > Volume 29(5); 2024 > Article
-
Research Article
제주지역 성인의 먹거리 보장에 따른 먹거리 구매 실태 및 정책 인지와 먹거리 환경 만족도: 2022년 제주 먹거리 실태조사 자료를 활용하여 -
김수민1,*
 , 장유정1,*, 함현지1, 고한빈1, 채인숙2, 하경호3,†
 - Food purchase patterns, food policy recognition, and food environment satisfaction among adults in Jeju, Korea, according to food security: a cross-sectional study
-
Sumin Kim1,*, Youjeong Jang1,*, Hyunji Ham1, Hanbin Ko1, Insuk Chai2, Kyungho Ha3,†
-
Korean Journal of Community Nutrition 2024;29(5):406-417.
DOI: https://doi.org/10.5720/kjcn.2024.00012
Published online: October 31, 2024
1제주대학교 식품영양학과 대학원생
2제주대학교 식품영양학과 교수
3제주대학교 식품영양학과 부교수
1Graduate Student, Department of Food Science and Nutrition, Jeju National University, Jeju, Korea
2Professor, Department of Food Science and Nutrition, Jeju National University, Jeju, Korea
3Associate Professor, Department of Food Science and Nutrition, Jeju National University, Jeju, Korea
- †Corresponding author: Kyungho Ha Department of Food Science and Nutrition, Jeju National University, 102 Jejudaehak-ro, Jeju 63243, Korea Tel: +82-64-754-3553 Fax: +82-64-725-2539 Email: kyungho.ha@jejunu.ac.kr
• Received: July 16, 2024 • Revised: September 20, 2024 • Accepted: October 14, 2024
© 2024 The Korean Society of Community Nutrition
This is an Open-Access article distributed under the terms of the Creative Commons Attribution Non-Commercial License (http://creativecommons.org/licenses/by-nc/4.0) which permits unrestricted non-commercial use, distribution, and reproduction in any medium, provided the original work is properly cited.
- 3,006 Views
- 59 Download
Abstract
-
Objectives
- Recently, food insecurity has been a major public health issue along with the food crisis caused by COVID-19, climate change, and the polarization of food supply due to socioeconomic disparities. Food insecurity is known to be related to the food choices and environment of the consumer. Therefore, this study aimed to evaluate the food security statuses of adults in Jeju and investigate their food purchase patterns, food policy recognition, and food environment satisfaction.
-
Methods
- Based on data from the 2022 Jeju Food Survey, 346 adults aged ≥ 19 years in Jeju were classified into food security and insecurity groups (quantitatively and qualitatively) using the questionnaire. Food purchase patterns, including purchasing frequency, items, and reasons, were surveyed for local and eco-friendly foods. The recognition and necessity of several food policies and satisfaction with diet and food environment (availability, accessibility, affordability, accommodation, and acceptability) were measured using the Likert scale.
-
Results
- Among the total participants, 47.4% were in the food insecurity group. The frequency of purchasing local and eco-friendly foods did not significantly differ by food security status. The insecurity group exhibited a higher recognition rate of basic rights to food (36.0%) than the security group (24.7%, P = 0.023). The recognition and necessity of specific food policies did not significantly differ by food security status, except for the policy of promoting food communities, for which the food security group exhibited higher recognition than the food insecurity group did (P = 0.004). The food insecurity group exhibited significantly lower scores regarding satisfaction toward diet and food environment factors (P < 0.05 for all).
-
Conclusion
- Overall, the food security group reported higher satisfaction with their diet and food environment than the food insecurity group. Further in-depth studies to investigate the determinants of food insecurity and effective promotional strategies for food policies are needed.
INTRODUCTION
METHODS
RESULTS
DISCUSSION
-
CONFLICT OF INTEREST
There are no financial or other issues that might lead to conflict of interest.
-
FUNDING
This work was supported by the Jeju Special Self-Governing Province.
-
DATA AVAILABILITY
Research data is available upon request to the corresponding author.
NOTES
SUPPLEMENTARY MATERIALS
Supplementary Table 1.
Fig. 1.Food security status of the study participants (A) and major cause of food insecurity (B, C).
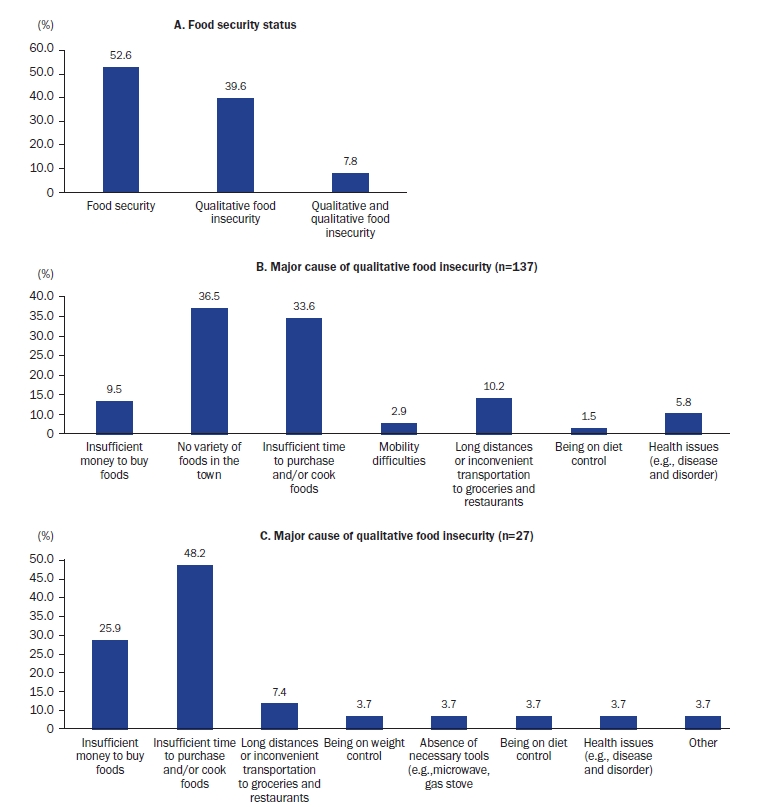
Table 1.General characteristics of study participants by food security status
| Characteristic | Total (n = 346) | Food security (n = 182) | Food insecurity (n = 164) | P-value1) |
|---|---|---|---|---|
| Sex | 0.017 | |||
| Male | 152 (43.9) | 91 (50.0) | 61 (37.2) | |
| Female | 194 (56.1) | 91 (50.0) | 103 (62.8) | |
| Age (year) | 47.1 ± 16.2 | 47.3 ± 17.4 | 46.8 ± 14.8 | 0.780 |
| Age group (year) | 0.111 | |||
| 19–29 | 62 (17.9) | 39 (21.4) | 23 (14.0) | |
| 30–39 | 53 (15.3) | 24 (13.2) | 29 (17.7) | |
| 40–49 | 65 (18.8) | 31 (17.0) | 34 (20.7) | |
| 50–59 | 88 (25.4) | 41 (22.5) | 47 (28.7) | |
| ≥ 60 | 78 (22.5) | 47 (25.8) | 31 (18.9) | |
| Region | ||||
| Jeju-si dong | 207 (59.8) | 108 (59.3) | 99 (60.4) | 0.609 |
| Jeju-si eup-myeon | 48 (13.9) | 26 (14.3) | 22 (13.4) | |
| Seogwipo-si dong | 49 (14.2) | 29 (15.9) | 20 (12.2) | |
| Seogwipo-si eup-myeon | 42 (12.1) | 19 (10.4) | 23 (14.0) | |
| Education level | 0.802 | |||
| Less than high school | 148 (42.8) | 79 (43.4) | 69 (42.1) | |
| College or above | 198 (57.2) | 103 (56.6) | 95 (57.9) | |
| Household type | 0.874 | |||
| Single person | 56 (16.2) | 30 (16.5) | 26 (15.9) | |
| Multi-person | 290 (83.8) | 152 (83.5) | 138 (84.1) | |
| Occupation (n = 344) | 0.655 | |||
| Managers/professionals/clerk | 119 (34.6) | 60 (33.1) | 59 (36.2) | |
| Service/sales workers | 104 (30.2) | 52 (28.7) | 52 (31.9) | |
| Forestry and fishery workers/elementary workers/other | 51 (14.8) | 28 (15.5) | 23 (14.1) | |
| Unemployed (including students and housewives) | 70 (20.4) | 41 (22.7) | 29 (17.8) | |
| Monthly household income (n = 343, KRW) | 0.241 | |||
| < 2,000,000 | 54 (15.7) | 29 (16.1) | 25 (15.3) | |
| 2,000,000–2,999,999 | 41 (12.0) | 17 (9.4) | 24 (14.7) | |
| 3,000,000–4,999,999 | 123 (35.9) | 61 (33.9) | 62 (38.0) | |
| ≥ 5,000,000 | 125 (36.4) | 73 (40.6) | 52 (31.9) |
Table 2.Food purchase of local and ecofriendly foods and related factors by food security status
| Food purchase and related factors | Total (n = 346) | Food security (n = 182) | Food insecurity (n = 164) | P-value1) |
|---|---|---|---|---|
| Frequency of purchasing foods produced in Jeju | 0.668 | |||
| 2–7 times a week | 134 (38.7) | 67 (36.8) | 67 (40.9) | |
| 1–4 times a month | 163 (47.1) | 87 (47.8) | 76 (46.3) | |
| Less than once a month | 49 (14.2) | 28 (15.4) | 21 (12.8) | |
| Types of foods produced in Jeju (n = 315) | 0.411 | |||
| Grains (rice, barley, etc.) | 16 (5.1) | 10 (6.1) | 6 (4.0) | |
| Legumes | 13 (4.1) | 10 (6.1) | 3 (2.0) | |
| Fruits | 33 (10.5) | 15 (9.1) | 18 (12.0) | |
| Vegetables | 87 (27.6) | 40 (24.2) | 47 (31.3) | |
| Meat | 101 (32.1) | 58 (35.2) | 43 (28.7) | |
| Seafood products (fish, shellfish, etc.) | 26 (8.3) | 13 (7.9) | 13 (8.7) | |
| Eggs (egg, etc.) | 25 (7.9) | 12 (7.3) | 13 (8.7) | |
| Milk and dairy products | 14 (4.4) | 7 (4.2) | 7 (4.7) | |
| Other | 0 (0.0) | 0 (0.0) | 0 (0.0) | |
| Main reason for buying foods produced in Jeju (n = 315) | 0.106 | |||
| The ingredients are fresh. | 222 (70.5) | 109 (66.1) | 113 (75.3) | |
| The taste, shape, and quality are good. | 29 (9.2) | 18 (10.9) | 11 (7.3) | |
| It’s cheap. | 12 (3.8) | 8 (4.9) | 4 (2.7) | |
| It helps Jeju’s farmers. | 21 (6.7) | 8 (4.9) | 13 (8.7) | |
| It’s an ingredient that I’ve been eating since I was young. | 27 (8.6) | 19 (11.5) | 8 (5.3) | |
| Other | 4 (1.3) | 3 (1.8) | 1 (0.7) | |
| Difficulties in buying foods produced in Jeju (n = 314) | 0.448 | |||
| There’s no store nearby. | 56 (17.8) | 33 (20.0) | 23 (15.4) | |
| It’s hard to notice the mark of Jeju. | 59 (18.8) | 30 (18.2) | 29 (19.5) | |
| There aren’t many different types of ingredients. | 95 (30.3) | 46 (27.9) | 49 (32.9) | |
| Due to low quality such as taste, appearance, etc. | 13 (4.1) | 7 (4.2) | 6 (4.0) | |
| The price is expensive. | 72 (22.9) | 35 (21.2) | 37 (24.8) | |
| Other | 1 (0.3) | 1 (0.6) | 0 (0.0) | |
| No specific reason | 18 (5.7) | 13 (7.9) | 5 (3.4) | |
| Main reason for not buying foods produced in Jeju (n = 29) | 0.609 | |||
| There’s no store nearby. | 5 (17.2) | 3 (20.0) | 2 (14.3) | |
| Don’t know if it’s from Jeju. | 7 (24.1) | 4 (26.7) | 3 (21.4) | |
| It’s not particularly different from other local agricultural products. | 7 (24.1) | 3 (20.0) | 4 (28.6) | |
| Due to low quality such as taste, appearance, etc. | 1 (3.5) | 1 (6.7) | 0 (0.0) | |
| The price is expensive. | 2 (6.9) | 0 (0.0) | 2 (14.3) | |
| Other | 7 (24.1) | 4 (26.7) | 3 (21.4) | |
| Use of local food stores | 0.506 | |||
| Yes | 135 (39.0) | 68 (37.4) | 67 (40.9) | |
| No | 211 (61.0) | 114 (62.6) | 97 (59.1) | |
| Most difficult aspect of using a local food store (n = 134) | 0.297 | |||
| There aren’t many stores nearby. | 73 (54.5) | 39 (57.4) | 34 (51.5) | |
| The foods are not fresh. | 2 (1.5) | 2 (2.9) | 0 (0.0) | |
| There aren’t many different types of ingredients. | 31 (23.1) | 14 (20.6) | 17 (25.8) | |
| Due to low quality such as taste, appearance, etc. | 5 (3.7) | 1 (1.5) | 4 (6.1) | |
| The price is expensive. | 17 (12.7) | 8 (11.8) | 9 (13.6) | |
| Other | 1 (0.8) | 0 (0.0) | 1 (1.5) | |
| No hard reason | 5 (3.7) | 4 (5.9) | 1 (1.5) | |
| Frequency of purchasing eco-friendly foods2) (n = 344) | 0.984 | |||
| 2–7 times a week | 47 (13.7) | 25 (13.9) | 22 (13.4) | |
| 1–4 times a month | 139 (40.4) | 72 (40.0) | 67 (40.9) | |
| Less than once a month | 158 (45.9) | 83 (46.1) | 75 (45.7) | |
| Main reason for buying eco-friendly foods (n = 234) | 0.467 | |||
| The ingredients are fresh. | 80 (34.2) | 36 (30.0) | 44 (38.6) | |
| The taste, shape, and quality are good. | 13 (5.6) | 5 (4.2) | 8 (7.0) | |
| It’s cheap. | 4 (1.7) | 2 (1.7) | 2 (1.8) | |
| To protect the environment. | 14 (6.0) | 6 (5.0) | 8 (7.0) | |
| It is more nutritious than regular agricultural products. | 15 (6.4) | 9 (7.5) | 6 (5.3) | |
| I can eat it with confidence. | 108 (46.2) | 62 (51.7) | 46 (40.4) | |
| Main reason for not buying eco-friendly foods (n = 104) | 0.018 | |||
| There’s no store nearby. | 21 (20.2) | 13 (22.0) | 8 (17.8) | |
| Eco-friendly product certification is not trustworthy. | 7 (6.7) | 2 (3.4) | 5 (11.1) | |
| There is no difference from general foods. | 20 (19.2) | 16 (27.1) | 4 (8.9) | |
| Due to low quality such as taste, appearance, etc. | 4 (3.9) | 3 (5.1) | 1 (2.2) | |
| The price is expensive. | 40 (38.5) | 16 (27.1) | 24 (53.3) | |
| Other | 12 (11.5) | 9 (15.3) | 3 (6.7) |
Table 3.Food policy recognition and necessity by food security status
| Policy recognition | Total (n = 346) | Food security (n = 182) | Food insecurity (n = 164) | P-value1) |
|---|---|---|---|---|
| Basic rights to food | 0.023 | |||
| Have heard of it | 104 (30.1) | 45 (24.7) | 59 (36.0) | |
| Have never heard of it | 242 (69.9) | 137 (75.3) | 105 (64.0) | |
| Establishment of multi-item production system by organizing small and medium-sized farmers (n = 345) | ||||
| Recognize it2) | 1.3 ± 0.5 | 1.3 ± 0.5 | 1.2 ± 0.4 | 0.054 |
| Consider it necessary3) | 3.7 ± 0.9 | 3.7 ± 0.9 | 3.8 ± 1.0 | 0.658 |
| Support for local food activation | ||||
| Recognize it | 1.8 ± 0.6 | 1.8 ± 0.7 | 1.8 ± 0.6 | 0.989 |
| Consider it necessary | 4.0 ± 0.9 | 4.0 ± 0.9 | 4.0 ± 0.9 | 0.574 |
| Support for processing and distribution using agricultural and fishery products from Jeju | ||||
| Recognize it | 1.5 ± 0.6 | 1.6 ± 0.6 | 1.5 ± 0.6 | 0.273 |
| Consider it necessary | 4.0 ± 0.9 | 4.0 ± 0.8 | 3.9 ± 1.0 | 0.456 |
| Expanding the supply of local food ingredients in public meals (n = 345) | ||||
| Recognize it | 1.6 ± 0.7 | 1.6 ± 0.6 | 1.6 ± 0.7 | 0.782 |
| Consider it necessary | 4.1 ± 0.9 | 4.0 ± 0.8 | 4.2 ± 1.0 | 0.215 |
| Support for eco-friendly agriculture, forestry, and fisheries | ||||
| Recognize it | 1.6 ± 0.6 | 1.6 ± 0.6 | 1.5 ± 0.6 | 0.098 |
| Consider it necessary | 4.0 ± 0.9 | 4.0 ± 0.8 | 4.0 ± 1.0 | 0.985 |
| Strengthening dietary education | ||||
| Recognize it | 1.7 ± 0.7 | 1.7 ± 0.6 | 1.6 ± 0.7 | 0.599 |
| Consider it necessary | 4.1 ± 0.9 | 4.1 ± 0.8 | 4.0 ± 1.0 | 0.807 |
| Strengthening the food safety management system (n = 345) | ||||
| Recognize it | 1.7 ± 0.7 | 1.7 ± 0.7 | 1.7 ± 0.7 | 0.337 |
| Consider it necessary | 4.3 ± 0.8 | 4.3 ± 0.7 | 4.3 ± 0.9 | 0.745 |
| Reduction of household waste (food waste and packaging containers) (n = 345) | ||||
| Recognize it | 2.0 ± 0.7 | 2.1 ± 0.7 | 2.0 ± 0.7 | 0.301 |
| Consider it necessary | 4.4 ± 0.8 | 4.4 ± 0.7 | 4.3 ± 0.9 | 0.663 |
| Ensuring food for the vulnerable (n = 345) | ||||
| Recognize it | 1.8 ± 0.7 | 1.8 ± 0.7 | 1.8 ± 0.7 | 0.604 |
| Consider it necessary | 4.3 ± 0.8 | 4.3 ± 0.7 | 4.23 ± 0.9 | 0.996 |
| Promoting food communities such as village kitchens and social dining (n = 344) | ||||
| Recognize it | 1.5 ± 0.6 | 1.6 ± 0.7 | 1.4 ± 0.6 | 0.004 |
| Consider it necessary | 3.8 ± 0.9 | 3.9 ± 0.9 | 3.7 ± 1.0 | 0.106 |
Table 4.Dietary satisfaction and importance of diet, happiness, and food environment satisfaction by food security status
| Dietary satisfaction and situation | Total (n = 345) | Food security (n = 182) | Food insecurity (n = 164) | P-value1) |
|---|---|---|---|---|
| Dietary satisfaction2) | ||||
| Happiness in life | 3.8 ± 0.7 | 3.9 ± 0.7 | 3.7 ± 0.7 | 0.006 |
| Dietary satisfaction | 3.7 ± 0.7 | 3.9 ± 0.6 | 3.4 ± 0.6 | < 0.0001 |
| Importance of diet in happiness | 4.3 ± 0.7 | 4.4 ± 0.8 | 4.2 ± 0.8 | 0.046 |
| Food environment satisfaction (n = 344)3) | ||||
| Availability | 2.8 ± 0.7 | 3.0 ± 0.7 | 2.7 ± 0.8 | < 0.001 |
| Accessibility | 2.8 ± 0.8 | 2.9 ± 0.7 | 2.7 ± 0.8 | 0.013 |
| Affordability | 2.8 ± 0.7 | 2.9 ± 0.7 | 2.6 ± 0.7 | < 0.0001 |
| Accommodation | 2.8 ± 0.8 | 2.9 ± 0.7 | 2.7 ± 0.8 | 0.003 |
| Acceptability | 2.9 ± 0.6 | 3.0 ± 0.6 | 2.8 ± 0.6 | 0.001 |
- 1. Hwang YJ, Park SJ, Kim SH, Cha WK. Chapter 8: food issues and responses in the COVID-19 era. KREI; 2021. p. 215-242.
- 2. Kim K, Kim MK, Shin YJ. Household food insecurity and its characteristics in Korea. Health Soc Welfare Rev 2009; 29(2): 268-292.Article
- 3. Food and Agriculture Organization (FAO), International Fund for Agricultural Development, United Nations Children’s Fund, World Food Program, World Health Organization. The State of food security and nutrition in the world 2020. Transforming food systems for affordable healthy diets. FAO; 2020.
- 4. Liu Y, Eicher-Miller HA. Food insecurity and cardiovascular disease risk. Curr Atheroscler Rep 2021; 23(6): 24.ArticlePubMedPMCPDF
- 5. Korean Law Information Center. Jeju Special Self-Governing Province food basic rights guarantee ordinance [Internet]. Ministry of the Interior and Safety; 2022 [updated 2022 Nov 23; cited 2023 Dec 28]. Available from: https://www.law.go.kr/LSW/ordinInfoP.do?ordinSeq=1750897
- 6. Hong KW, Kim JY, Kim YS. The conceptualization of the local food, a Korean case. Korean J Bus Adm 2009; 22(3): 1629-1649.
- 7. Kim JD. Danger of food in Korea and its solution. Democr Soc Policy Studies 2011; 2011(20): 41-70.
- 8. Macieira A, Barbosa J, Teixeira P. Food safety in local farming of fruits and vegetables. Int J Environ Res Public Health 2021; 18(18): 9733.ArticlePubMedPMC
- 9. Jukes TH. Organic food. CRC Crit Rev Food Sci Nutr 1977; 9(4): 395-418.ArticlePubMed
- 10. Hurtado-Barroso S, Tresserra-Rimbau A, Vallverdú-Queralt A, Lamuela-Raventós RM. Organic food and the impact on human health. Crit Rev Food Sci Nutr 2019; 59(4): 704-714.ArticlePubMed
- 11. Jeong EM, Choi BO, Jeong CS, Jeong HY. An analysis of the expected effects of regional food plans and future challenges. Korea Rural Economic Institute; 2018 Mar. Report No. P245.
- 12. Jeong EM, Choi BO, Choi JH. The current state and policy tasks for local food plan. Korea Rural Economic Institute; 2019 Oct. Report No. R884.
- 13. Holben DH, Marshall MB. Position of the academy of nutrition and dietetics: food insecurity in the United States. J Acad Nutr Diet 2017; 117(12): 1991-2002.ArticlePubMed
- 14. Champagne CM, Casey PH, Connell CL, Stuff JE, Gossett JM, Harsha DW, et al.; Lower Mississippi Delta Nutrition Intervention Research Initiative. Poverty and food intake in rural America: diet quality is lower in food insecure adults in the Mississippi Delta. J Am Diet Assoc 2007; 107(11): 1886-1894.ArticlePubMed
- 15. Leung CW, Epel ES, Ritchie LD, Crawford PB, Laraia BA. Food insecurity is inversely associated with diet quality of lower-income adults. J Acad Nutr Diet 2014; 114(12): 1943-1953.e2.ArticlePubMed
- 16. McLaughlin C, Tarasuk V, Kreiger N. An examination of at-home food preparation activity among low-income, food-insecure women. J Am Diet Assoc 2003; 103(11): 1506-1512.ArticlePubMed
- 17. Kang MG, Yook SM, Hwang JY. Is it what they eat or how much they eat that matters more in adults with food insecurity in a wealthy-country context? Nutrients 2021; 13(3): 851.ArticlePubMedPMC
- 18. Lee H, Jang Y, Kim S, Ha K. Consumption of protein supplements/protein-fortified foods among young adults in Jeju. J Nutr Health 2024; 57(2): 261-274.ArticleLink
- 19. Ko M, Ha K. Association of delivered food consumption with dietary behaviors and obesity among young adults in Jeju. J Nutr Health 2024; 57(3): 336-348.ArticleLink
- 20. Kim JK. A study on food-related lifestyles and food consciousness of Jeju island for establishing local food system. J Rural Soc 2010; 20(2): 117-161.
- 21. Jeju Special Self-Governing Province. Jeju Food Survey final report. Jeju Special Self-Governing Province; 2022 Oct.
- 22. Seoul Metropolitan Government. 2020 Seoul food statistics survey report [Internet]. Seoul Metropolitan Government; 2021 [updated 2021 Apr 1; cited 2023 Dec 28]. Available from: https://fsi.seoul.go.kr/front/bbs/bbsView.do?currPage=1&listSize=10&searchType=all&searchValu=&bbsCode=1020&bbsSeq=15
- 23. Korean Disease Control and Prevention Agency (KDCA). Korea Health Statistics 2022: Korea National Health and Nutrition Examination Survey (KNHANES IX-1) [Internet]. KDCA; 2023 [updated 2023 Dec 29; cited 2024 Sep 20]. Available from: https://knhanes.kdca.go.kr/knhanes/sub04/sub04_04_01.do
- 24. Lee KI, Kim SH, Jeong SY, Ahn JW, Shim HH, Park IH. 2022 food consumption behavior survey statistical report. Korea Rural Economic Institute; 2022 Dec. Report No. E16-2022-1.
- 25. Jeju Special Self-Governing Province. Study and research for establishing an execution plan for Jeju food plan. Jeju Special Self-Governing Province; 2020 May.
- 26. Jeju Special Self-Governing Province. 2021 Resident Registration Population Statistics [Internet]. Jeju Special Self-Governing Province; 2022 [updated 2022 Jun 4; cited 2022 Jul 01]. Available from: Available from : https://kosis.kr/statHtml/statHtml.do?orgId=101&tblId=DT_1B040B3&vw_cd=MT_ZTITLE&list_id=A_7&scrId=&seqNo=&lang_mode=ko&obj_var_id=&itm_id=&conn_path=MT_ZTITLE&path=%252FstatisticsList%252FstatisticsListIndex.do
- 27. Seoul Metropolitan Government. 2022 Seoul food statistics survey report [Internet]. Seoul Metropolitan Government; 2022 [updated 2023 Apr 25; cited 2023 Dec 28]. Available from: https://fsi.seoul.go.kr/front/bbs/bbsView.do?currPage=1&listSize=10&bbsCode=1020&bbsSeq=38
- 28. Korea Consumer Agency. Survey on consumer lifestyles and consumer awareness in Jeju Province [Internet]. Korea Consumer Agency; 2015 [updated 2015 Dec; cited 2023 Dec 28] Available from: https://www.dbpia.co.kr/Journal/articleDetail?nodeId=NODE06696136
- 29. Whang MJ, Jung YH. 2017 consumption life indicators in Korea. Korean Consumer Agency; 2017 Dec. Report No. 정책연구 17-16.
- 30. Gorton D, Bullen CR, Mhurchu CN. Environmental influences on food security in high-income countries. Nutr Rev 2010; 68(1): 1-29.ArticlePubMed
- 31. Carrillo-Álvarez E, Salinas-Roca B, Costa-Tutusaus L, Milà-Villarroel R, Shankar Krishnan N. The measurement of food insecurity in high-income countries: a scoping review. Int J Environ Res Public Health 2021; 18(18): 9829.ArticlePubMedPMC
REFERENCES
Figure & Data
REFERENCES
Citations
Citations to this article as recorded by 
 Cite
CiteFood purchase patterns, food policy recognition, and food environment satisfaction among adults in Jeju, Korea, according to food security: a cross-sectional study

Fig. 1. Food security status of the study participants (A) and major cause of food insecurity (B, C).
Fig. 1.
Food purchase patterns, food policy recognition, and food environment satisfaction among adults in Jeju, Korea, according to food security: a cross-sectional study
| Characteristic | Total (n = 346) | Food security (n = 182) | Food insecurity (n = 164) | P-value |
|---|---|---|---|---|
| Sex | 0.017 | |||
| Male | 152 (43.9) | 91 (50.0) | 61 (37.2) | |
| Female | 194 (56.1) | 91 (50.0) | 103 (62.8) | |
| Age (year) | 47.1 ± 16.2 | 47.3 ± 17.4 | 46.8 ± 14.8 | 0.780 |
| Age group (year) | 0.111 | |||
| 19–29 | 62 (17.9) | 39 (21.4) | 23 (14.0) | |
| 30–39 | 53 (15.3) | 24 (13.2) | 29 (17.7) | |
| 40–49 | 65 (18.8) | 31 (17.0) | 34 (20.7) | |
| 50–59 | 88 (25.4) | 41 (22.5) | 47 (28.7) | |
| ≥ 60 | 78 (22.5) | 47 (25.8) | 31 (18.9) | |
| Region | ||||
| Jeju-si dong | 207 (59.8) | 108 (59.3) | 99 (60.4) | 0.609 |
| Jeju-si eup-myeon | 48 (13.9) | 26 (14.3) | 22 (13.4) | |
| Seogwipo-si dong | 49 (14.2) | 29 (15.9) | 20 (12.2) | |
| Seogwipo-si eup-myeon | 42 (12.1) | 19 (10.4) | 23 (14.0) | |
| Education level | 0.802 | |||
| Less than high school | 148 (42.8) | 79 (43.4) | 69 (42.1) | |
| College or above | 198 (57.2) | 103 (56.6) | 95 (57.9) | |
| Household type | 0.874 | |||
| Single person | 56 (16.2) | 30 (16.5) | 26 (15.9) | |
| Multi-person | 290 (83.8) | 152 (83.5) | 138 (84.1) | |
| Occupation (n = 344) | 0.655 | |||
| Managers/professionals/clerk | 119 (34.6) | 60 (33.1) | 59 (36.2) | |
| Service/sales workers | 104 (30.2) | 52 (28.7) | 52 (31.9) | |
| Forestry and fishery workers/elementary workers/other | 51 (14.8) | 28 (15.5) | 23 (14.1) | |
| Unemployed (including students and housewives) | 70 (20.4) | 41 (22.7) | 29 (17.8) | |
| Monthly household income (n = 343, KRW) | 0.241 | |||
| < 2,000,000 | 54 (15.7) | 29 (16.1) | 25 (15.3) | |
| 2,000,000–2,999,999 | 41 (12.0) | 17 (9.4) | 24 (14.7) | |
| 3,000,000–4,999,999 | 123 (35.9) | 61 (33.9) | 62 (38.0) | |
| ≥ 5,000,000 | 125 (36.4) | 73 (40.6) | 52 (31.9) |
| Food purchase and related factors | Total (n = 346) | Food security (n = 182) | Food insecurity (n = 164) | P-value |
|---|---|---|---|---|
| Frequency of purchasing foods produced in Jeju | 0.668 | |||
| 2–7 times a week | 134 (38.7) | 67 (36.8) | 67 (40.9) | |
| 1–4 times a month | 163 (47.1) | 87 (47.8) | 76 (46.3) | |
| Less than once a month | 49 (14.2) | 28 (15.4) | 21 (12.8) | |
| Types of foods produced in Jeju (n = 315) | 0.411 | |||
| Grains (rice, barley, etc.) | 16 (5.1) | 10 (6.1) | 6 (4.0) | |
| Legumes | 13 (4.1) | 10 (6.1) | 3 (2.0) | |
| Fruits | 33 (10.5) | 15 (9.1) | 18 (12.0) | |
| Vegetables | 87 (27.6) | 40 (24.2) | 47 (31.3) | |
| Meat | 101 (32.1) | 58 (35.2) | 43 (28.7) | |
| Seafood products (fish, shellfish, etc.) | 26 (8.3) | 13 (7.9) | 13 (8.7) | |
| Eggs (egg, etc.) | 25 (7.9) | 12 (7.3) | 13 (8.7) | |
| Milk and dairy products | 14 (4.4) | 7 (4.2) | 7 (4.7) | |
| Other | 0 (0.0) | 0 (0.0) | 0 (0.0) | |
| Main reason for buying foods produced in Jeju (n = 315) | 0.106 | |||
| The ingredients are fresh. | 222 (70.5) | 109 (66.1) | 113 (75.3) | |
| The taste, shape, and quality are good. | 29 (9.2) | 18 (10.9) | 11 (7.3) | |
| It’s cheap. | 12 (3.8) | 8 (4.9) | 4 (2.7) | |
| It helps Jeju’s farmers. | 21 (6.7) | 8 (4.9) | 13 (8.7) | |
| It’s an ingredient that I’ve been eating since I was young. | 27 (8.6) | 19 (11.5) | 8 (5.3) | |
| Other | 4 (1.3) | 3 (1.8) | 1 (0.7) | |
| Difficulties in buying foods produced in Jeju (n = 314) | 0.448 | |||
| There’s no store nearby. | 56 (17.8) | 33 (20.0) | 23 (15.4) | |
| It’s hard to notice the mark of Jeju. | 59 (18.8) | 30 (18.2) | 29 (19.5) | |
| There aren’t many different types of ingredients. | 95 (30.3) | 46 (27.9) | 49 (32.9) | |
| Due to low quality such as taste, appearance, etc. | 13 (4.1) | 7 (4.2) | 6 (4.0) | |
| The price is expensive. | 72 (22.9) | 35 (21.2) | 37 (24.8) | |
| Other | 1 (0.3) | 1 (0.6) | 0 (0.0) | |
| No specific reason | 18 (5.7) | 13 (7.9) | 5 (3.4) | |
| Main reason for not buying foods produced in Jeju (n = 29) | 0.609 | |||
| There’s no store nearby. | 5 (17.2) | 3 (20.0) | 2 (14.3) | |
| Don’t know if it’s from Jeju. | 7 (24.1) | 4 (26.7) | 3 (21.4) | |
| It’s not particularly different from other local agricultural products. | 7 (24.1) | 3 (20.0) | 4 (28.6) | |
| Due to low quality such as taste, appearance, etc. | 1 (3.5) | 1 (6.7) | 0 (0.0) | |
| The price is expensive. | 2 (6.9) | 0 (0.0) | 2 (14.3) | |
| Other | 7 (24.1) | 4 (26.7) | 3 (21.4) | |
| Use of local food stores | 0.506 | |||
| Yes | 135 (39.0) | 68 (37.4) | 67 (40.9) | |
| No | 211 (61.0) | 114 (62.6) | 97 (59.1) | |
| Most difficult aspect of using a local food store (n = 134) | 0.297 | |||
| There aren’t many stores nearby. | 73 (54.5) | 39 (57.4) | 34 (51.5) | |
| The foods are not fresh. | 2 (1.5) | 2 (2.9) | 0 (0.0) | |
| There aren’t many different types of ingredients. | 31 (23.1) | 14 (20.6) | 17 (25.8) | |
| Due to low quality such as taste, appearance, etc. | 5 (3.7) | 1 (1.5) | 4 (6.1) | |
| The price is expensive. | 17 (12.7) | 8 (11.8) | 9 (13.6) | |
| Other | 1 (0.8) | 0 (0.0) | 1 (1.5) | |
| No hard reason | 5 (3.7) | 4 (5.9) | 1 (1.5) | |
| Frequency of purchasing eco-friendly foods |
0.984 | |||
| 2–7 times a week | 47 (13.7) | 25 (13.9) | 22 (13.4) | |
| 1–4 times a month | 139 (40.4) | 72 (40.0) | 67 (40.9) | |
| Less than once a month | 158 (45.9) | 83 (46.1) | 75 (45.7) | |
| Main reason for buying eco-friendly foods (n = 234) | 0.467 | |||
| The ingredients are fresh. | 80 (34.2) | 36 (30.0) | 44 (38.6) | |
| The taste, shape, and quality are good. | 13 (5.6) | 5 (4.2) | 8 (7.0) | |
| It’s cheap. | 4 (1.7) | 2 (1.7) | 2 (1.8) | |
| To protect the environment. | 14 (6.0) | 6 (5.0) | 8 (7.0) | |
| It is more nutritious than regular agricultural products. | 15 (6.4) | 9 (7.5) | 6 (5.3) | |
| I can eat it with confidence. | 108 (46.2) | 62 (51.7) | 46 (40.4) | |
| Main reason for not buying eco-friendly foods (n = 104) | 0.018 | |||
| There’s no store nearby. | 21 (20.2) | 13 (22.0) | 8 (17.8) | |
| Eco-friendly product certification is not trustworthy. | 7 (6.7) | 2 (3.4) | 5 (11.1) | |
| There is no difference from general foods. | 20 (19.2) | 16 (27.1) | 4 (8.9) | |
| Due to low quality such as taste, appearance, etc. | 4 (3.9) | 3 (5.1) | 1 (2.2) | |
| The price is expensive. | 40 (38.5) | 16 (27.1) | 24 (53.3) | |
| Other | 12 (11.5) | 9 (15.3) | 3 (6.7) |
| Policy recognition | Total (n = 346) | Food security (n = 182) | Food insecurity (n = 164) | P-value |
|---|---|---|---|---|
| Basic rights to food | 0.023 | |||
| Have heard of it | 104 (30.1) | 45 (24.7) | 59 (36.0) | |
| Have never heard of it | 242 (69.9) | 137 (75.3) | 105 (64.0) | |
| Establishment of multi-item production system by organizing small and medium-sized farmers (n = 345) | ||||
| Recognize it |
1.3 ± 0.5 | 1.3 ± 0.5 | 1.2 ± 0.4 | 0.054 |
| Consider it necessary |
3.7 ± 0.9 | 3.7 ± 0.9 | 3.8 ± 1.0 | 0.658 |
| Support for local food activation | ||||
| Recognize it | 1.8 ± 0.6 | 1.8 ± 0.7 | 1.8 ± 0.6 | 0.989 |
| Consider it necessary | 4.0 ± 0.9 | 4.0 ± 0.9 | 4.0 ± 0.9 | 0.574 |
| Support for processing and distribution using agricultural and fishery products from Jeju | ||||
| Recognize it | 1.5 ± 0.6 | 1.6 ± 0.6 | 1.5 ± 0.6 | 0.273 |
| Consider it necessary | 4.0 ± 0.9 | 4.0 ± 0.8 | 3.9 ± 1.0 | 0.456 |
| Expanding the supply of local food ingredients in public meals (n = 345) | ||||
| Recognize it | 1.6 ± 0.7 | 1.6 ± 0.6 | 1.6 ± 0.7 | 0.782 |
| Consider it necessary | 4.1 ± 0.9 | 4.0 ± 0.8 | 4.2 ± 1.0 | 0.215 |
| Support for eco-friendly agriculture, forestry, and fisheries | ||||
| Recognize it | 1.6 ± 0.6 | 1.6 ± 0.6 | 1.5 ± 0.6 | 0.098 |
| Consider it necessary | 4.0 ± 0.9 | 4.0 ± 0.8 | 4.0 ± 1.0 | 0.985 |
| Strengthening dietary education | ||||
| Recognize it | 1.7 ± 0.7 | 1.7 ± 0.6 | 1.6 ± 0.7 | 0.599 |
| Consider it necessary | 4.1 ± 0.9 | 4.1 ± 0.8 | 4.0 ± 1.0 | 0.807 |
| Strengthening the food safety management system (n = 345) | ||||
| Recognize it | 1.7 ± 0.7 | 1.7 ± 0.7 | 1.7 ± 0.7 | 0.337 |
| Consider it necessary | 4.3 ± 0.8 | 4.3 ± 0.7 | 4.3 ± 0.9 | 0.745 |
| Reduction of household waste (food waste and packaging containers) (n = 345) | ||||
| Recognize it | 2.0 ± 0.7 | 2.1 ± 0.7 | 2.0 ± 0.7 | 0.301 |
| Consider it necessary | 4.4 ± 0.8 | 4.4 ± 0.7 | 4.3 ± 0.9 | 0.663 |
| Ensuring food for the vulnerable (n = 345) | ||||
| Recognize it | 1.8 ± 0.7 | 1.8 ± 0.7 | 1.8 ± 0.7 | 0.604 |
| Consider it necessary | 4.3 ± 0.8 | 4.3 ± 0.7 | 4.23 ± 0.9 | 0.996 |
| Promoting food communities such as village kitchens and social dining (n = 344) | ||||
| Recognize it | 1.5 ± 0.6 | 1.6 ± 0.7 | 1.4 ± 0.6 | 0.004 |
| Consider it necessary | 3.8 ± 0.9 | 3.9 ± 0.9 | 3.7 ± 1.0 | 0.106 |
| Dietary satisfaction and situation | Total (n = 345) | Food security (n = 182) | Food insecurity (n = 164) | P-value |
|---|---|---|---|---|
| Dietary satisfaction |
||||
| Happiness in life | 3.8 ± 0.7 | 3.9 ± 0.7 | 3.7 ± 0.7 | 0.006 |
| Dietary satisfaction | 3.7 ± 0.7 | 3.9 ± 0.6 | 3.4 ± 0.6 | < 0.0001 |
| Importance of diet in happiness | 4.3 ± 0.7 | 4.4 ± 0.8 | 4.2 ± 0.8 | 0.046 |
| Food environment satisfaction (n = 344) |
||||
| Availability | 2.8 ± 0.7 | 3.0 ± 0.7 | 2.7 ± 0.8 | < 0.001 |
| Accessibility | 2.8 ± 0.8 | 2.9 ± 0.7 | 2.7 ± 0.8 | 0.013 |
| Affordability | 2.8 ± 0.7 | 2.9 ± 0.7 | 2.6 ± 0.7 | < 0.0001 |
| Accommodation | 2.8 ± 0.8 | 2.9 ± 0.7 | 2.7 ± 0.8 | 0.003 |
| Acceptability | 2.9 ± 0.6 | 3.0 ± 0.6 | 2.8 ± 0.6 | 0.001 |
Table 1. General characteristics of study participants by food security status
n (%) or Mean ± SD.
Table 2. Food purchase of local and ecofriendly foods and related factors by food security status
n (%). The accuracy of statistical significance may be reduced owing to the low number of respondents for some items.
Table 3. Food policy recognition and necessity by food security status
n (%) or Mean ± SD. Measured using a 3-point scale (e.g., don’t know = 1, have heard of it = 2, know well = 3). Measured using a 5-point Likert scale (e.g., unnecessary = 1, normal = 3, necessary = 5).
Table 4. Dietary satisfaction and importance of diet, happiness, and food environment satisfaction by food security status
Mean ± SD. Measured using a 5-point Likert scale (e.g., very dissatisfied = 1, very satisfied = 5). Measured using a 4-point scale (e.g., highly disagree = 1, highly agree = 4).


