
Articles
- Page Path
- HOME > Korean J Community Nutr > Volume 21(1); 2016 > Article
-
Research Article
- Evaluation of Nutrition Quotient and Related Factors in Preschool Children
- Yeon Hyang Jung, Jung Hee Kim
-
Korean Journal of Community Nutrition 2016;21(1):1-11.
DOI: https://doi.org/10.5720/kjcn.2016.21.1.1
Published online: February 29, 2016
Department of Food and Nutrition, College of Natural Sciences, Seoul Women's University, Seoul, Korea.
- Corresponding author: Jung Hee Kim. Department of Food and Nutrition, College of Natural Sciences, Seoul Women's University, 621 Hwarang-ro, Nowon-gu, Seoul 01797, Korea. Tel: (02) 970-5646, Fax: (02) 976-4049, jheekim@swu.ac.kr
• Received: December 29, 2015 • Revised: January 29, 2016 • Accepted: February 18, 2016
Copyright © 2016 The Korean Society of Community Nutrition
This is an Open-Access article distributed under the terms of the Creative Commons Attribution Non-Commercial License (http://creativecommons.org/licenses/by-nc/3.0/) which permits unrestricted non-commercial use, distribution, and reproduction in any medium, provided the original work is properly cited.
- 2,317 Views
- 8 Download
- 12 Crossref
Abstract
-
Objectives
- This study was conducted to evaluate the nutrition quotient (NQ) by gender and understand which factors influence NQ in preschool children.
-
Methods
- Subjects were 245 children (110 boys, 135 girls) aged 4-6 years and their parents. The questionnaire composed of demographic characteristics, eating behavior factors and the NQ questions. The NQ consisted of 19 food behavior checklist items and all items were grouped into 5 factors: balance, diversity, moderation, regularity, and practice. Inbody J05, a measurement device that measures individual's body composition was used to measure children's anthropometric data. All data were statistically analyzed by SPSS program (Ver. 20) and the statistical differences in variables were evaluated by Student t-test, χ2-test, One-way ANOVA and Duncan's multiple range test.
-
Results
- The total NQ score of the subjects was 65.3. The NQ score of girls (67.0) was significantly higher than that of the boys (63.2) (p<0.01). The girls' average scores of NQ factors including diversity (p<0.01) and practice (p<0.05) were higher than those of the boys. The analysis of related-factors influencing NQ scores showed that there was a significant difference among the groups according to feeding methods during infancy (p<0.05), breast feeding group being the highest. Furthermore, the NQ score showed a significant difference depending on how to correct children's unbalanced diet as well as parents' nutrition knowledge. The NQ score of obesity group tended to be lower than that of underweight group although there was no significant difference.
-
Conclusions
- Overall results indicated that the girls had better quality of diet and eating habits than the boys. Children and their parents need proper nutrition education and counseling to correct children's eating habits and to improve diet quality in kindergartens and in children care centers.
- 1. Kang MH, Lee JS, Kim HY, Kwon S, Choi YS, Chung HR. Selecting items of a food behavior checklist for the development of Nutrition Quotient (NQ) for children. Korean J Nutr 2012; 45(4): 372-389.Article
- 2. Kim HY, Kwon S, Lee JS, Choi YS, Chung HR, Kwak TK. Development of a Nutrition Quotient (NQ) equation modeling for children and the evaluation of its construct validity. Korean J Nutr 2012; 45(4): 390-399.Article
- 3. Yoo JS, Choi YS. Evaluation of items for the food behavior checklist and nutrition quotient score on children in rural areas of Gyeongbuk. J Nutr Health 2013; 46(5): 427-439.Article
- 4. Boo MN, Cho SK, Park K. Evaluation of dietary behavior and nutritional status of elementary school students in Jeju using nutrition quotient. J Nutr Health 2015; 48(4): 335-343.Article
- 5. Huang YC, Kim HY. Assessment of dietary behavior of Chinese children using nutrition quotient for children. J Nutr Health 2014; 47(5): 342-350.Article
- 6. Kim JH, Jung YH. Evaluation of food behavior and nutritional status of preschool children in Nowon-gu of Seoul by using nutrition quotient. Korean J Community Nutr 2014; 19(1): 1-11.Article
- 7. Briley ME, Jastrow S, Vickers J, Roberts-Gray C. Dietary intake at child-care centers and away: Are parents and care providers working as partners or at cross-purposes? J Am Diet Assoc 1999; 99(8): 950-954.PubMed
- 8. Kang KJ. A study on food habits, nutrient intakes and nutritional quality of preschool children in Seoul. Korean J Community Nutr 2005; 10(4): 471-483.
- 9. Cho MS. Nutrition and health status of day-care center children. Korean J Diet Cult 2000; 15(4): 313-323.
- 10. Choi MJ, Yoon JS. The effect of eating habits and nutrient intake on the physical growth indices in preschool children. Korean J Community Nutr 2003; 8(1): 3-14.
- 11. Eun JH, Kim SM. The effects of taste preferences on nutrients intake and the degree of dental caries in preschool children. Korean J Community Nutr 2003; 8(5): 631-641.
- 12. Korea Centers for Disease Control and Prevention, Ministry of Health & Welfare. Korea Health Statistics 2013 - The sixth Korea National Health and Nutrition Examination Survey (KNHANES VI-I) [internet]. 2014; cited 2015 Dec 20]. Available from: https://knhanes.cdc.go.kr/knhanes/index.do.
- 13. Kang EJ. A study on nutrient intakes and eating habits of preschool children [master's thesis]. Gyeongsang National University; 2010.
- 14. Lee JH, Kang EJ, Kim CI. The difference of perception about nutritional problems and food intakes, nutrition knowledge score and realities of nutrition education between parents and preschool teachers. Korean J Community Nutr 2011; 16(6): 636-646.Article
- 15. Kim KA, Sim YH. Cognitive performance and hyperactivity in terms of eating behavior and physical growth among preschoolers-1. A survey on eating behavior of preschoolers-. Korean J Diet Cult 1995; 10(4): 255-268.
- 16. Seo SJ, Min IJ, Shin HS. Study of eating behavior and food preference in young children: Differences by age and gender. J East Asian Soc Diet Life 2009; 19(5): 659-667.
- 17. Jang YA, Han SS, Lee HS, Won HS, Kim SH, Kim HY. A study for dietary attitude and food behavior of elementary, middle and high school students of Korea. J Korean Home Econ Assoc 2000; 38(8): 85-97.
- 18. Korea Centers for Disease Control and Prevention, Ministry of Health & Welfare. Korea Health Statistics 2012 - the fixth Korea National Health and Nutrition Examination Survey [internet]. 2013; cited 2014 Dec 10]. Available from: https://knhanes.cdc.go.kr/knhanes/index.do.
- 19. Oh K, Jang MJ, Lee NY, Moon JS, Lee CG, Yoo MH. Prevalence and trends in obesity among Korean children and adolescents in 1997 and 2005. Korean J Pediatr 2008; 51(9): 950-955.Article
- 20. Hong YJ. A study on a relation of food ecology to obesity index of 5th grade children in Cheju city (II). Korean J Diet Cult 1998; 13(2): 141-151.
- 21. Kim KM. Needs assessment of nutrition education for preschoolers and their parents using focus group interview. J East Asian Soc Diet Life 2015; 25(1): 20-29.Article
- 22. Lee SJ, Kim Y. Evaluation of the diet and nutritional states of elementary and middle school students in the Daegu area by using Nutrition Quotient for children. J Nutr Health 2013; 46(5): 440-446.Article
- 23. Song HH. The Effects of mothers' eating habits and nutritional knowledge on their children's eating habits and obesity. Asian J Child Welf Dev 2013; 11(2): 67-86.
- 24. Korea Centers for Disease Control and Prevention, The Korean Pediatric Society. Standard Growth Curve for Korean Children and Adolescents. Seoul: Korea Centers for Disease Control and Prevention, The Korean Pediatric Society; 2007. p. 10-29.
- 25. Seo JY, Lee IS, Choi BS. Study of food intakes and eating patterns among preschool children in Daegu area-Nutrient intakes and dietary habits associated with body weight status-. Korean J Community Nutr 2009; 14(6): 710-721.
- 26. Kim JR, Lim HS. Relationships between children's nutrition quotient and the practice of the dietary guidelines of elementary school students and their mothers. J Nutr Health 2015; 48(1): 58-70.ArticleLink
- 27. Kim NH, Lee IS. Assessment of nutritional status of children in community child center by nutrition quotient -Gyeongju-. J East Asian Soc Diet Life 2015; 25(1): 73-86.
- 28. Kim SK, Kang KH. The factors associated with feeding on Korean infants' growth. J Nat Sci Soonchunhyang Univ 2000; 6(2): 227-231.
- 29. Kim MJ. The effect of eating habit, life behavior and body image of higher grade elementary school children and parents in child obesity degree. Korean J Growth Dev 2013; 21(3): 227-235.
REFERENCES
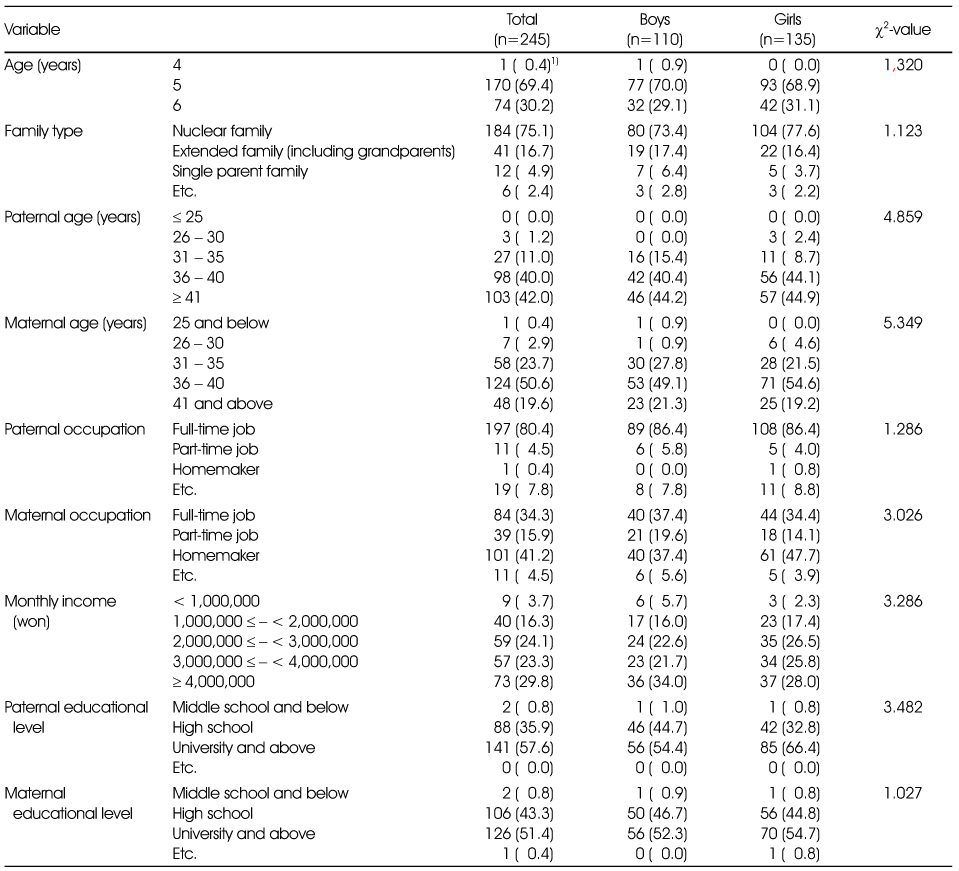
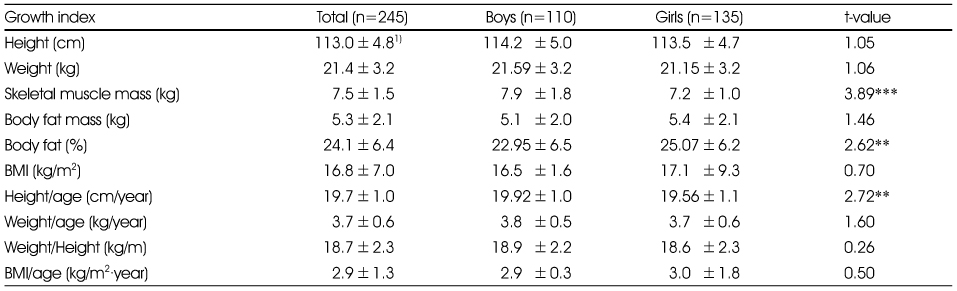
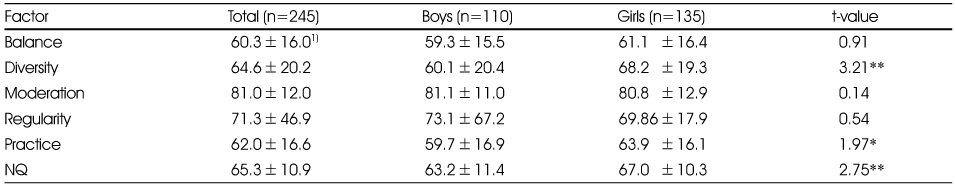
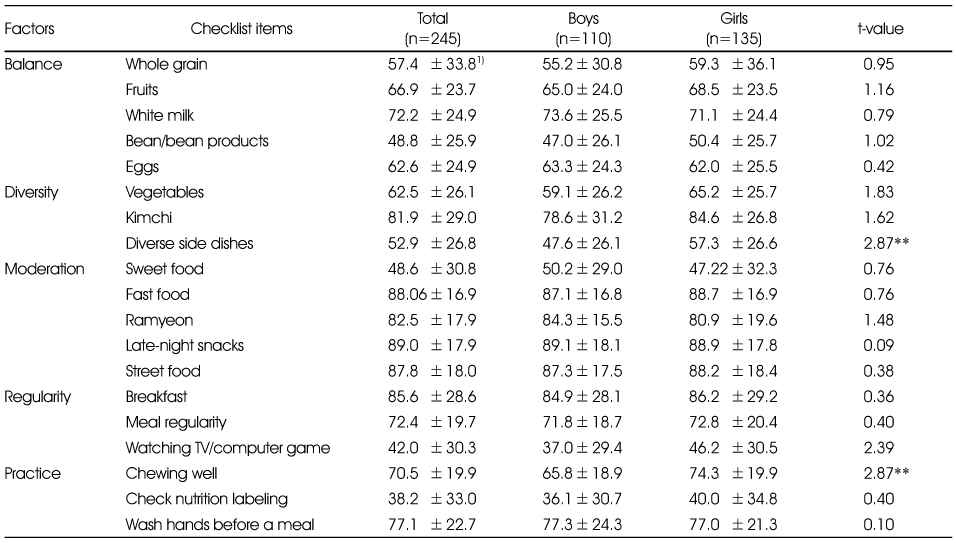
Table 5
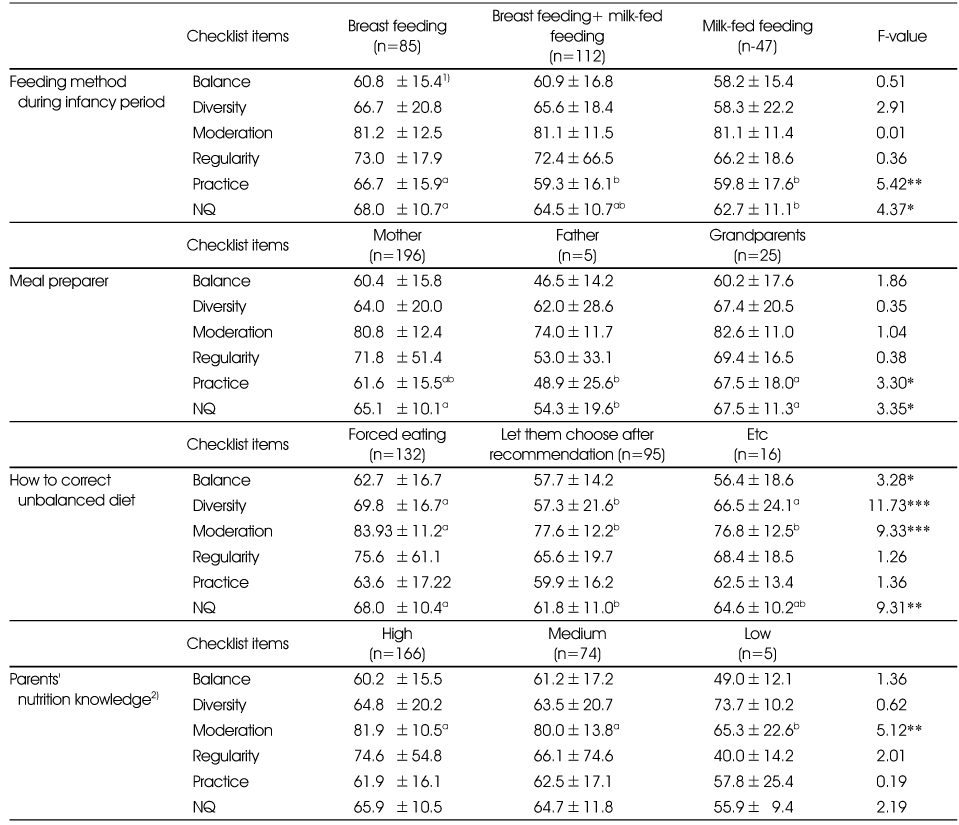
Analysis of NQ influencing factors
1) Mean±SD
2) High = 8 - 10 scores; Medium = 5 - 7 scores; Low = 0 - 4 scores
*: p < 0.05, **: p < 0.01, ***: p < 0.001 significantly different among the groups, respectively by ANOVA
ab: Means with different superscript letter were significant different among groups at p < 0.05 by Duncan's multiple range test
Table 6
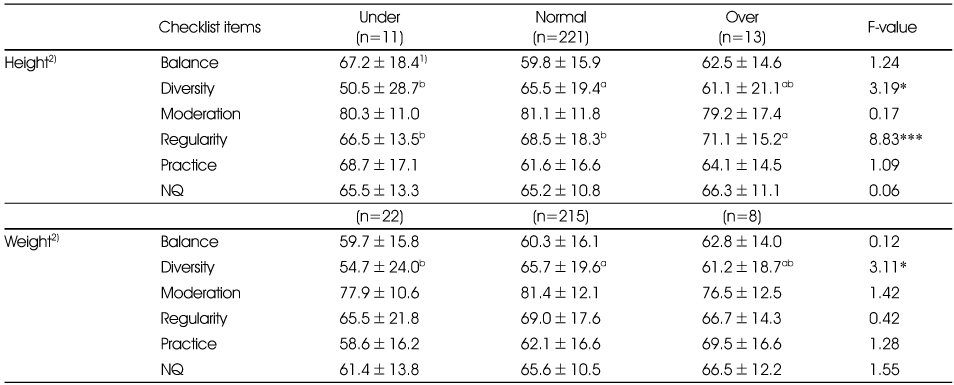
NQ and its factors by growth index
1) Mean±SD
2) Based on standard growth curve for Korean children and adolescents in 2007
Under: 1-5 percentile; Normal: 5-95 percentile; Over; 95-100 percentile
*: p < 0.05, ***: p < 0.001 significantly different among the groups, respectively by ANOVA
ab: Means with different superscript letter were significant different among groups at p < 0.05 by Duncan's multiple range test
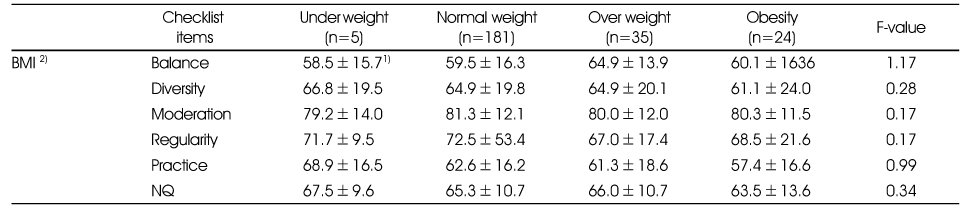
Figure & Data
REFERENCES
Citations
Citations to this article as recorded by 
- Risk assessment of four polycyclic aromatic hydrocarbons in South Korean sesame oil products
Da Eun Hong, Da-Hyun Jeong, Sungmok Kim, Hee-Seok Lee
Food Science and Biotechnology.2026; 35(1): 297. CrossRef - Analysis of the factors that influence preschool children eating behavior by applying the health belief model: Seoul and Gyeonggi Province
Sung-Mi Cha, Soo-Youn Kim
Nutrition Research and Practice.2023; 17(3): 541. CrossRef - Dietary Behavior and Related Factors of Preschool Children in Seocheon-gun, Korea
Seung-Lim Lee, Sun-Im Won
Journal of the East Asian Society of Dietary Life.2022; 32(1): 34. CrossRef - Evaluation of dietary behaviors of preschool children in Seoul and Gyeonggi-do associated with the level of parents' health consciousness: using nutrition quotient for preschoolers (NQ-P)
Soo-Youn Kim, Sung-Mi Cha
Nutrition Research and Practice.2021; 15(2): 248. CrossRef - Development of nutrition quotient for elementary school children to evaluate dietary quality and eating behaviors
Jung-Sug Lee, Ji-Yun Hwang, Sehyug Kwon, Hae-Rang Chung, Tong-Kyung Kwak, Myung-Hee Kang, Young-Sun Choi, Hye-Young Kim
Journal of Nutrition and Health.2020; 53(6): 629. CrossRef - Evaluation of dietary behavior and investigation of the affecting factors among preschoolers in Busan and Gyeongnam area using nutrition quotient for preschoolers (NQ-P)
Soo-Youn Kim, Sung-Mi Cha
Journal of Nutrition and Health.2020; 53(6): 596. CrossRef - Assessment of dietary behaviors among preschoolers in Daejeon: using Nutrition Quotient for Preschoolers (NQ-P)
Hye-Jin Lee, Jin Hee Kim, SuJin Song
Journal of Nutrition and Health.2019; 52(2): 194. CrossRef - Analysis of the types of eating behavior affecting the nutrition of preschool children: using the Dietary Behavior Test (DBT) and the Nutrition Quotient (NQ)
Hyeon Mi Sim, Youngshin Han, Kyung A Lee
Journal of Nutrition and Health.2019; 52(6): 604. CrossRef - Evaluation of Dietary Behavior among Preschooler in Jecheon Area Using Nutrition Quotient for Preschoolers
Sung Hee Min
Korean Journal of Food and Cookery Science.2018; 34(4): 413. CrossRef - Evaluation of Dietary Behavior of Infants and Toddlers in Ganghwa County by Using Nutrition Quotient (NQ)
Eun-mi Kim
Journal of the East Asian Society of Dietary Life.2017; 27(1): 17. CrossRef - Nutritional status of 3~5 year old children attending kindergarten and childcare facilities: Using data from the 2010 and 2014 Korea National Health and Nutrition Examination Surveys
Mi Yeon Park, Pil Sook Park
Journal of Nutrition and Health.2017; 50(4): 361. CrossRef - The Infant and Child Growth Assistance System Based on a Smartphone
Ki-Won Byun, Joon-Gyu Kang
Journal of the Korea Society of Computer and Information.2016; 21(8): 95. CrossRef
 Cite
CiteEvaluation of Nutrition Quotient and Related Factors in Preschool Children
Evaluation of Nutrition Quotient and Related Factors in Preschool Children
General characteristics of preschool children
1) N (%)
Anthropometric measurements of preschool children
1) Mean±SD
**: p < 0.01, ***: p < 0.001 significantly different between boys and girls by t-test
NQ score of preschool children
1) Mean±SD
*: p < 0.05, **: p < 0.01 significantly different between boys and girls by t-test
Comparison of checklist items for each factor of NQ
1) Mean±SD
**: p < 0.01 significantly different between boys and girls by t-test
Analysis of NQ influencing factors
1) Mean±SD
2) High = 8 - 10 scores; Medium = 5 - 7 scores; Low = 0 - 4 scores
*: p < 0.05, **: p < 0.01, ***: p < 0.001 significantly different among the groups, respectively by ANOVA
ab: Means with different superscript letter were significant different among groups at p < 0.05 by Duncan's multiple range test
NQ and its factors by growth index
1) Mean±SD
2) Based on standard growth curve for Korean children and adolescents in 2007
Under: 1-5 percentile; Normal: 5-95 percentile; Over; 95-100 percentile
*: p < 0.05, ***: p < 0.001 significantly different among the groups, respectively by ANOVA
ab: Means with different superscript letter were significant different among groups at p < 0.05 by Duncan's multiple range test
NQ and its factors by BMI percentile
1) Mean±SD
2) BMI (Body mass index) = Weight (kg) / Height (m2)
Underweight: 0 < BMI percentile ≤ 5; Normal weight: 5 < BMI percentile ≤ 85;
Overweight: 85 < BMI percentile ≤ 95; Obesity: BMI percentile > 95 or BMI > 25
Table 1
General characteristics of preschool children
1) N (%)
Table 2
Anthropometric measurements of preschool children
1) Mean±SD **: p < 0.01, ***: p < 0.001 significantly different between boys and girls by t-test
Table 3
NQ score of preschool children
1) Mean±SD *: p < 0.05, **: p < 0.01 significantly different between boys and girls by t-test
Table 4
Comparison of checklist items for each factor of NQ
1) Mean±SD **: p < 0.01 significantly different between boys and girls by t-test
Table 5
Analysis of NQ influencing factors
1) Mean±SD 2) High = 8 - 10 scores; Medium = 5 - 7 scores; Low = 0 - 4 scores *: p < 0.05, **: p < 0.01, ***: p < 0.001 significantly different among the groups, respectively by ANOVA ab: Means with different superscript letter were significant different among groups at p < 0.05 by Duncan's multiple range test
Table 6
NQ and its factors by growth index
1) Mean±SD 2) Based on standard growth curve for Korean children and adolescents in 2007 Under: 1-5 percentile; Normal: 5-95 percentile; Over; 95-100 percentile *: p < 0.05, ***: p < 0.001 significantly different among the groups, respectively by ANOVA ab: Means with different superscript letter were significant different among groups at p < 0.05 by Duncan's multiple range test
Table 7
NQ and its factors by BMI percentile
1) Mean±SD 2) BMI (Body mass index) = Weight (kg) / Height (m2) Underweight: 0 < BMI percentile ≤ 5; Normal weight: 5 < BMI percentile ≤ 85; Overweight: 85 < BMI percentile ≤ 95; Obesity: BMI percentile > 95 or BMI > 25


