
Articles
- Page Path
- HOME > Korean J Community Nutr > Volume 17(2); 2012 > Article
-
Original Article
- The Relationship between High Energy/Low Nutrient Food Consumption and Obesity among Korean Children and Adolescents
- Gyu Jin Heo, So-Young Nam, Soo-Kyung Lee, Sang-Jin Chung, Ji hyun Yoon
-
Korean Journal of Community Nutrition 2012;17(2):226-242.
DOI: https://doi.org/10.5720/kjcn.2012.17.2.226
Published online: April 30, 2012
Department of Food and Nutrition, Inha University. Incheon, Korea.
1Department of Food and Nutrition, Kookmin University. Seoul, Korea.
2Department of Food and Nutrition, Seoul National University. Seoul, Korea.
- Corresponding author: Soo-Kyung Lee, Department of Food and Nutrition, Inha University, 253 YongHyun-dong, Nam-gu, Incheon 402-751, Republic of Korea. Tel: (032) 860-8121, Fax: (032) 862-8120, skleenutrition@inha.ac.kr
• Received: February 29, 2012 • Revised: April 6, 2012 • Accepted: April 11, 2012
Copyright © 2012 The Korean Society of Community Nutrition
- 1,932 Views
- 3 Download
- 18 Crossref
Abstract
- Consumption of foods with high energy and low nutrient values has been linked to various health issues including obesity and chronic diseases. This study investigated the high-energy/low-nutrient food consumption status and its relationship with obesity status and intake of energy and nutrients, using the Korea National Health and Nutrition Examination Survey (KNHANES) and the Korea Youth Risk Behavior Web-based Survey (KYRBWS). The prevalence of overweight and obesity among 2-18 year-olds was 8.4% and 10.8% in 2008 and 8.5% and 9.0% in 2009, respectively, in KNHANES. The prevalence of obesity among 12-18 year-olds was 13.9% in 2008 and 11.4% in 2009 in KNHANES, while it was 8.1% in 2008 and 8.2% in 2009 in KYRBWS. Consumption patterns of high-energy/low-nutrient foods were diverse depending on the particular food type. High-energy/low-nutrient foods such as cookies were most often consumed more frequently (2~3 times per week), but fast food type foods were generally consumed less frequently (once per week or less). No significant relationships between high-energy/low-nutrient food consumption and level of energy and nutrient intakes were found in either datasets. Adolescents who were not obese more frequently consumed ramen (p < 0.001), cookies (p < 0.001) and fast food (p < 0.001) than those who were obese in KYRBWS, however, such relationships were not found in KNHANES. This direction of the relationship could be probably attributed to the cross-sectional nature of the datasets. This study was limited by the cross-sectional nature of the data, therefore, further longitudinal research using various study techniques would be necessary to understand the effects of high-energy/low-nutrient foods on child obesity.
- 1. Bray GA, Nielsen SJ, Popkin BM. Consumption of high-fructose corn syrup in beverages may play a role in the epidemic of obesity. Am J Clin Nutr. 2004; 79(4): 537-543.ArticlePubMed
- 2. Burniat W, Cole TJ, Lissau I, Poskitt EME. Child and adolescent obesity. 2006; Cambridge: Cambridge University press.
- 3. Chae MJ, Choi SK, Seo JS. The differences of biochemical status and dietary habits according to the obesity degree among obese elementary school students in the Gyungbuk area. Korean J Community Nutr. 2009; 14(4): 441-450.
- 4. Ebbeling CB, Dorota BP, David SL. Childhood obesity:public-health crisis, common sense cure. Lancet. 2002; 360(9331): 473-482.ArticlePubMed
- 5. Gropper SS, Smith JL, Groff JL. Advanced nutrition and human metabolism. 2009; Wadsworth.
- 6. Isganaitis E, Lustig RH. Fast food, central nervous system insulin resistance, and obesity. Arterioscler Thromb Vasc Biol. 2005; 25(12): 2451-2462.ArticlePubMed
- 7. Kang MH, Yoon KS. Elementary school students amounts of sugar, sodium, and fats exposure through intake of processed food. J Korean Soc Food Sci Nutr. 2009; 38(1): 52-61.Article
- 8. KCDC (Korea Centers for Disease Control and Prevention). The fourth Korea national health and nutrition examination survey (KNHANES IV-3). 2008a.
- 9. KCDC (Korea Centers for Disease Control and Prevention). The fourth Korea youth risk behavior survey. 2008b.
- 10. KCDC (Korea Centers for Disease Control and Prevention). The fourth Korea national health and nutrition examination survey (KNHANES IV-2). 2009a.
- 11. KCDC (Korea Centers for Disease Control and Prevention). The fifth Korea youth risk behavior survey. 2009b.
- 12. 2007 Korean National Growth Charts. KCDC & KPS (Korea Center for Disease Control and Prevention & The Korean Pediatric Society). 2007; cited 2012 February 10. Available from www.cdc.go.kr.
- 13. Kleiser C, Schaffrath Rosario A, Mensink GB, Prinz-Langenohl R, Kurth BM. Potential determinants of obesity among children and adolescents in Germany: Results from the cross-sectional KiGGS study. BMC Public Health. 2009; 9: 46.ArticlePubMedPMCPDF
- 14. Kim EK, Lee AR, Kim JJ, Kim MH, Kim JS, Moon HK. The difference of biochemical status, dietary habits and dietary behaviors according to the obesity degree among obese children. J Korean Diet Assoc. 2000; 6(2): 161-170.
- 15. Kim HR, Hwang NM, Shim JE, KIM EJN. Analysis on breastfeeding and nutritional health among children and adolescents and counter policies in Korea. 2008; 4: 84-134.
- 16. Kim JD, Kim WK, Rhim YT, Kim MJ. The difference for eating, activity, life pattern between obese and normal child who 5-6 grade in elementary school. J Sport Leis Stud. 2009; 38(2): 855-865.Article
- 17. Kim YS, Park MJ. Time trend in height, weight, BMI and waist circumference of Korean adolescents; from the Korean national health and nutrition examination survey (KNHNES), 1998, 2001 and 2005. J Korean Soc Pediatr Endocrinol. 2007; 12(2): 142-149.
- 18. High energy/low nutrient food list. Korea Food & Drug Administration. 2010; cited 2012 February 10. Available from www.kfda.go.kr.
- 19. Lim HJ, Park HR, Koo HK. Research for child/adolescent obesity status and policy. 2009 10; 87-174.
- 20. Malik VS, Schulze MB, Hu FB. Intake of sugar-sweetened beverages and weight gain: A systematic review. Am J Clin Nutr. 2006; 84(2): 274-288.ArticlePubMedPMC
- 21. MHWFA & KCDC (Ministry for Health, Welfare and Family Affairs & Korea Centers for Disease Control and Prevention). 2008 National health statistics - the 4th Korea national health and nutrition examination survey, the second year (2008). 2009; 204. 255-259.
- 22. MHWFA & KCDC (Ministry of Health and Welfare and family Affairs & Korea Centers for Disease Control and Prevention). 2007 National health statistics - the 4th Korea national health and nutrition examination survey, the first year(2007). 2008.
- 23. MHWFA, KCDC, & MEDST (Ministry of Health and Welfare and Family Affairs, Korea Centers for Disease Control and Prevention & Ministry of Education, Science and Technology). 2007 Korea youth risk behavior web-based survey. 2008.
- 24. MHWAFA & KDFA (Ministry of Health and Welfare and family Affairs, Korea Food & Drug Administration). Special Law for Child Food Safety Management. Law-9932. 2009.
- 25. MHWFA (Ministry of Health, Welfare and Family Affairs). 2005 Korea national health and nutrition examination survey. 2006; cited 2012 February 10. Available from www.knhance.cdc.go.kr.
- 26. Moreno LA, Rodriguez G. Dietary risk factors for development of childhood obesity. Curr Opin Clin Nutr Metab Care. 2007; 10(3): 336-341.ArticlePubMed
- 27. Oh KW, Jang MJ, Lee NY, Moon JS, Lee CG, Yoo MH, Kim YT. Prevalence and trends in obesity among Korean children and adolescents in 1997 and 2005. Korean J Pediatr. 2008; 51(9): 950-955.Article
- 28. Parsons TJ, Power C, Logan S, Summerbell CD. Childhood predictors of adult obesity: A systematic review. Int J Obes Relat Metab Disord. 1999; 23: Suppl 8. S1-S107.Article
- 29. The Korean Nutrition Society. Dietary Reference Intakes for Koreans. 2010.
- 30. Yi BS. Comparative analysis on meal and food preference between non-obese and obese elementary school children. Korean J Food Cult. 2007; 22(4): 482-491.
REFERENCES
Table 1Prevalence of overweight and obesity by gender and age (2 to 18 year old) in 2008
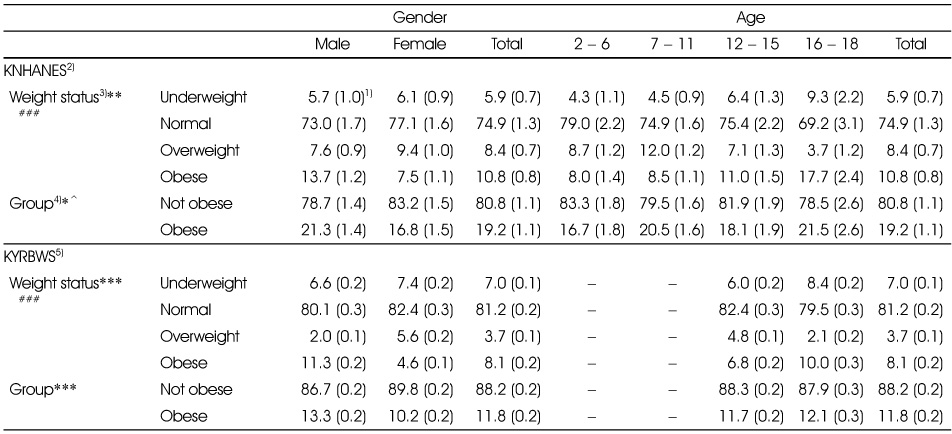
1) The estimated percent of population (standard error)
2) Korea National Health and Nutrition Examination Survey
3) 2007 Korean National Growth Charts. Underweight: < 5 percentile, Normal: 5 - 85 percentile, Overweight: 85 - 95 percentile, Obesity: ≥ 95 percentile or ≥ BMI 25
4) Criteria of weight status; underweight and normal → not obese; overweight and obese → obese
5) Korea Youth Risk Behavior Web-based Survey
*: p < 0.05, **: p < 0.01, ***: p < 0.001 (gender difference)
#: p < 0.05, ##: p < 0.01, ###: p < 0.001 (age difference)
^: p < 0.05 (year difference in 16 - 18y)
Table 2Prevalence of overweight and obesity by gender and age (2 to 18 year old) in 2009
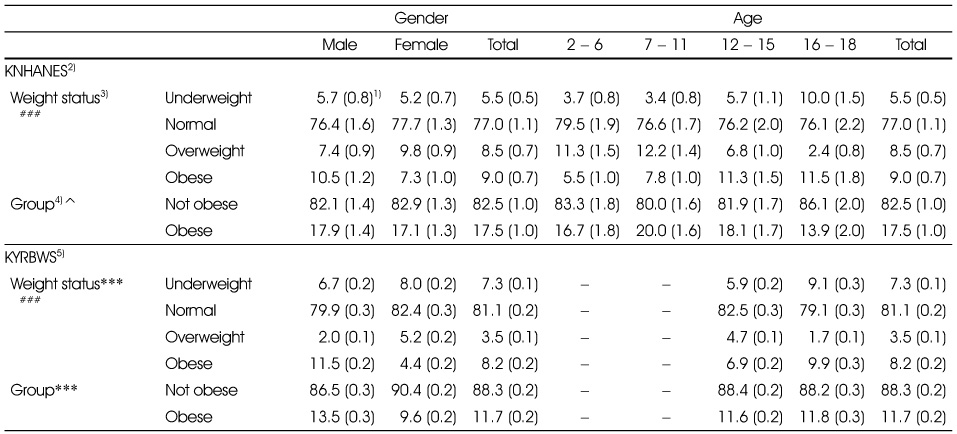
1) The estimated percent of population (standard error)
2) Korea National Health and Nutrition Examination Survey
3) 2007 Korean National Growth Charts. Underweight: < 5 percentile, Normal: 5 - 85 percentile, Overweight: 85 - 95 percentile, Obesity: ≥ 95 percentile or ≥ BMI 25
4) Criteria of weight status; underweight and normal → not obese; overweight and obese → obese
5) Korea Youth Risk Behavior Web-based Survey
#: p < 0.05, ##: p < 0.01, ###: p < 0.001 (age difference)
^: p < 0.05 (Year difference)
Table 3Prevalence of overweight and obesity by gender and age (12 to 18 year old) in 2008

1) The estimated percent of population (standard error)
2) 2007 Korean National Growth Charts. Underweight: < 5 percentile, Normal: 5 - 85 percentile, Overweight: 85 - 95 percentile, Obesity: ≥ 95 percentile or ≥ BMI 25
3) Korea National Health and Nutrition Examination Survey
4) Korea Youth Risk Behavior Web-based Survey
5) Gender or age difference of KNHANES
6) Gender or age difference of KYRBWS
7) Year difference of KNHANES 16 - 18y
8) Criteria of weight status; underweight and normal → not obese; overweight and obese → obese
Table 4Prevalence of overweight and obesity by gender and age (12 to 18 year old) in 2009

1) The estimated percent of population (standard error)
2) 2007 Korean National Growth Charts. Underweight: < 5 percentile, Normal: 5 - 85 percentile, Overweight: 85 - 95 percentile, Obesity: ≥ 95 percentile or ≥ BMI 25
3) Korea National Health and Nutrition Examination Survey
4) Korea Youth Risk Behavior Web-based Survey
5) Gender or age difference of KNHANES
6) Gender or age difference of KYRBWS
7) Year difference of KNHANES 16-18y
8) Criteria of weight status; underweight and normal → not obese; overweight, and obese → obese

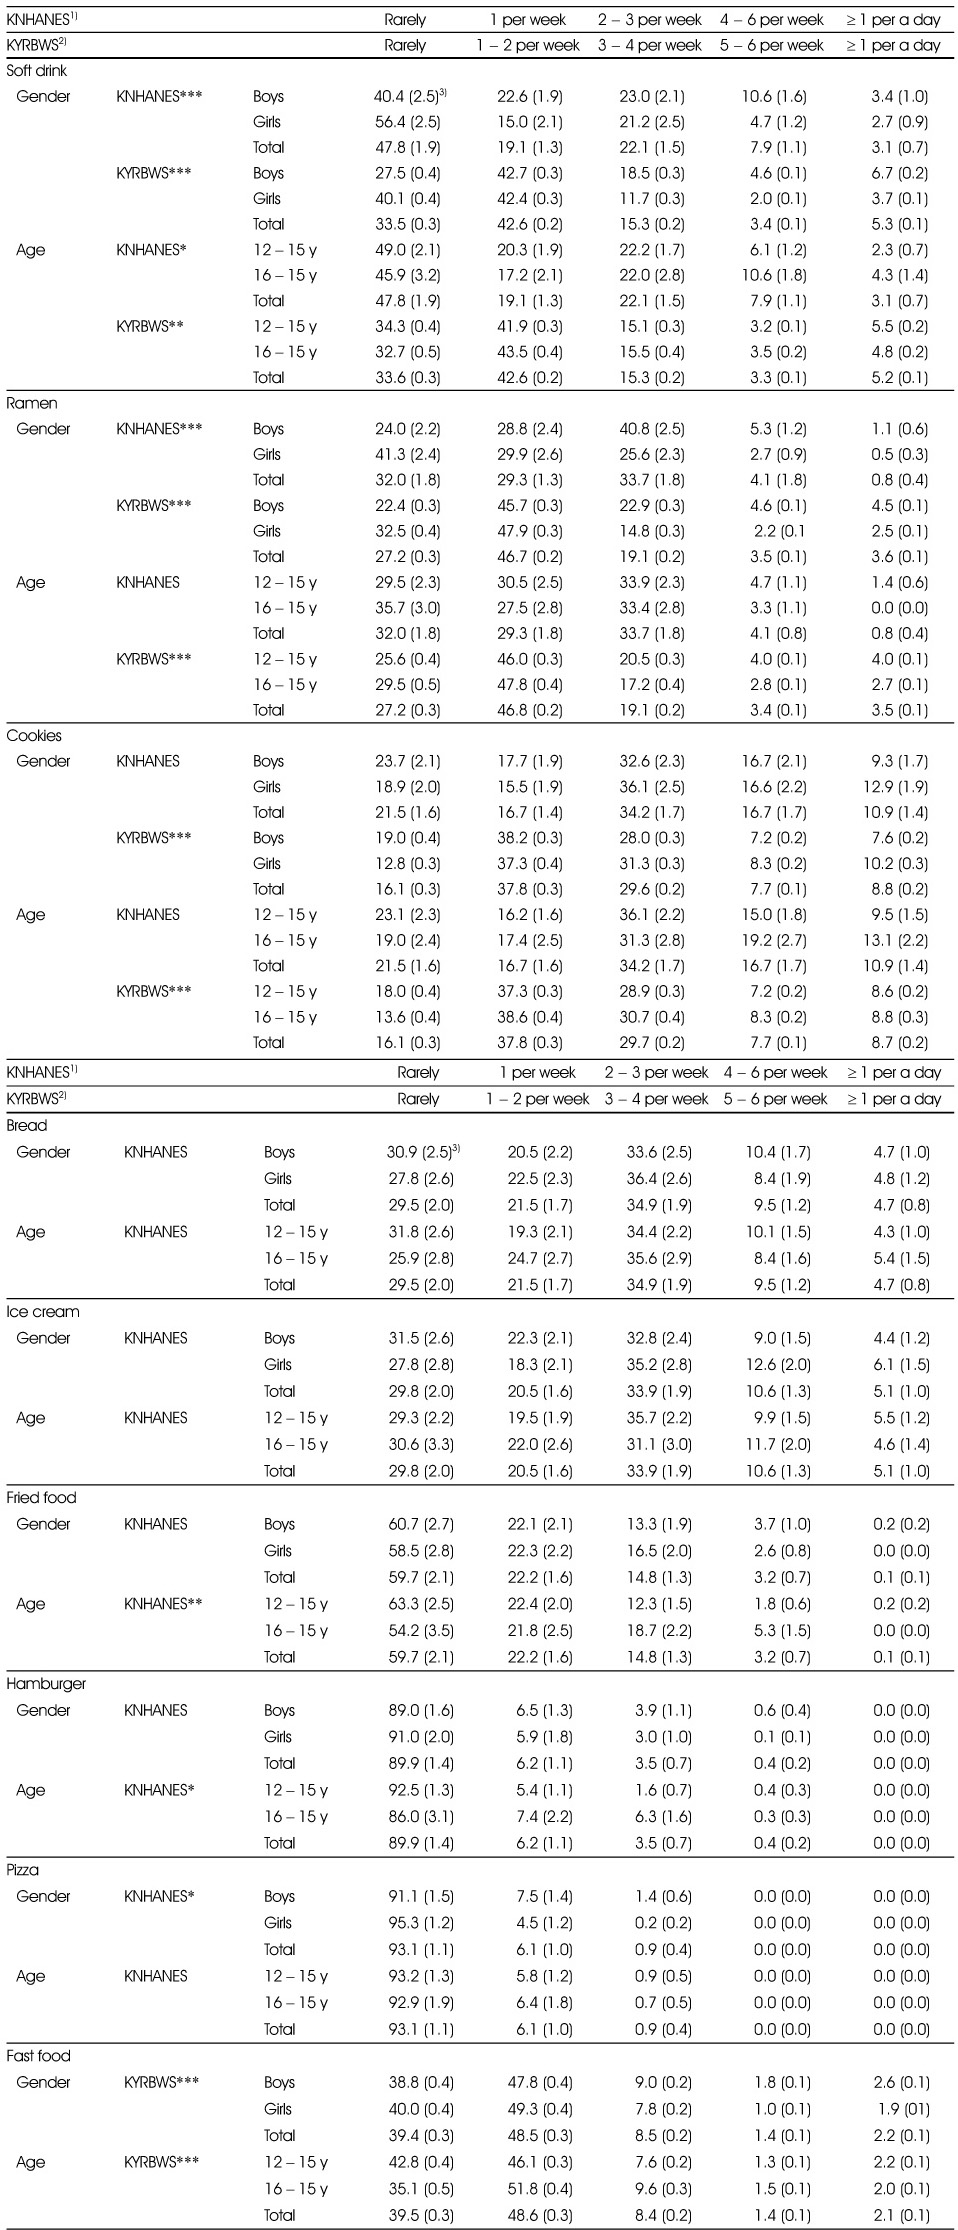
Table 7Consumption frequency of high energy/low nutrient food types between not obese and obese group (12 - 18 ages) in 2008)
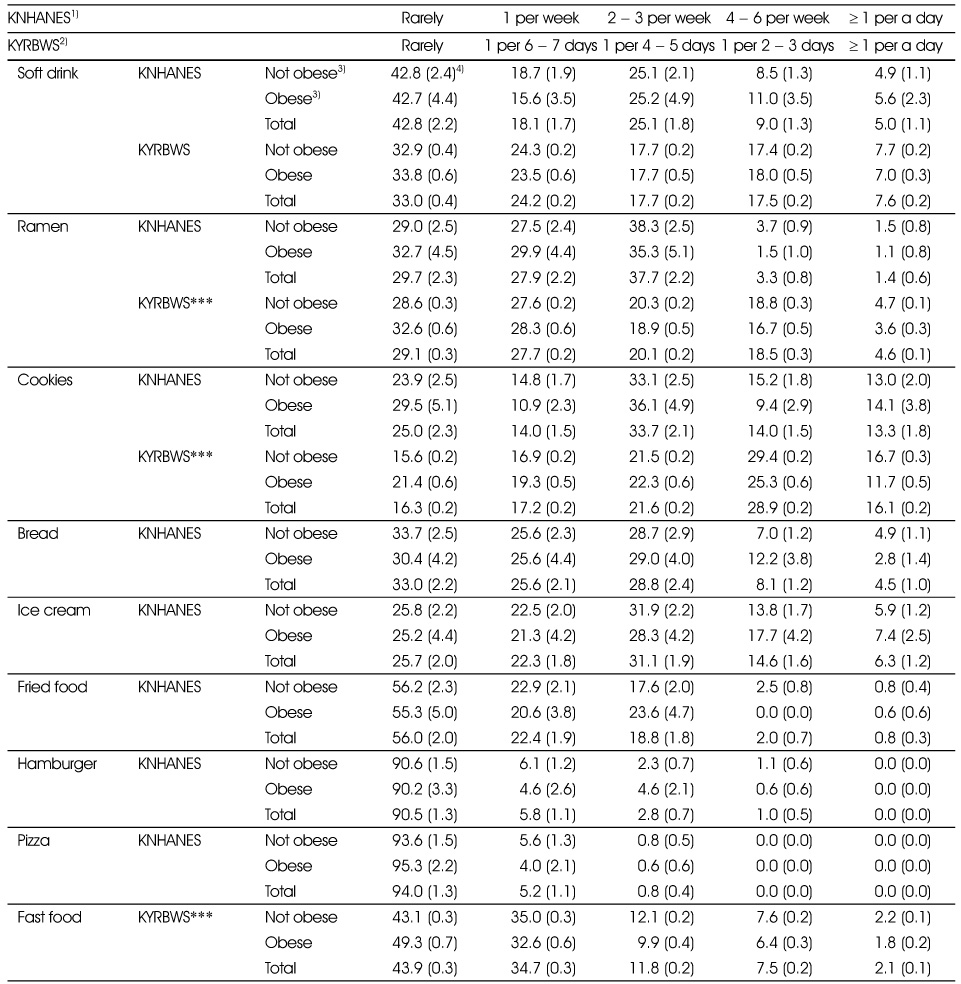
Table 8Consumption frequency of high energy/low nutrient food types between obese and non-obese group (12 - 18 ages) in 2009

1) Korea National Health and Nutrition Examination Survey
2) Korea Youth Risk Behavior Web-based Survey
3) 2007 Korean National Growth Charts. Not obese: < 85 percentile, Obese: ≥ 85 percentile or ≥ BMI 25
4) The estimated percent of population (standard error)
*: p < 0.05, **: p < 0.01, ***: p < 0.001
Table 9Energy and nutrients intake by high energy/low nutrient food consumption1) (KNHANES)

Values are Mean ± SE
1) High energy/low nutrient foods were determined by the High energy/low nutrient food list from Korea Food & Drug Administration.
2) Percentage energy from carbohydrate compared to total energy intake per day
3) Percentage energy from protein compared to the total energy intake per day
4) Percentage energy from fat compared to the total energy intake per day
**: p < 0.01, ***: p < 0.001 intake group difference 2008
^^: p < 0.01, ^^^: p < 0.001 intake group difference 2009
#: p < 0.05 year difference in total
Table 10Relationship between high energy/low nutrient food consumption and energy and nutrient intake adequacy1)

1) Covariates: Gender, age, weight, quartile of income
2) OR: Odd Ratio Reference: Sufficiency Criteria of energy, carbohydrate, protein, fat and sodium
3) Meeting 75% - 125% of the Estimated Energy Requirement (EER) reference for gender and age in the Dietary Reference Intake for Koreans
4) High energy/low nutrient foods were determined by the High energy/low nutrient food list from Korea Food & Drug Administration
5) Meeting 75% - 125% of the individually calculated Estimated Energy Requirement (EER) using the formulas in the Dietary Reference Intake for Koreans
6) Intake adequacy was determined by meeting the Acceptable Macronutrient Distribution Ranges (AMDR) for age. Carbohydrate 55 - 70%, Protein 7 - 20%, Fat 2y: 20 - 35%, 3 - 18 y: 15 - 30%
7) Intake adequacy was determined by consuming less than the Standard of Target nutrient intake
Table 11Energy and nutrient intake from high energy/low nutrient food1) between obese and non-obese group (KNHANES)
Values are Mean ± SE
1) High energy/low nutrient foods were determined by the High energy/low nutrient food list from Korea Food & Drug Administration
2) 2007 Korean National Growth Charts. Not obese: < 85 percentile, Obese: ≥ 85 percentile or ≥ BMI 25
3) Energy intake from high energy/low nutrient food as percentage of the total energy consumed per day
4) Protein intake from high energy/low nutrient food as percentage of the total protein consumed per day
5) Fat intake from high energy/low nutrient food as percentage of the total fat consumed per day
6) Carbohydrate intake from high energy/low nutrient food as a percentage of the total carbohydrate consumed per day
7) Sodium intake from high energy/low nutrient food as a percentage of the total carbohydrate consumed per day
8) Amount of intake from high energy/low nutrient food as a percentage of the total amount of food consumed per day
*: p < 0.05 (year difference in the obese group)
Figure & Data
REFERENCES
Citations
Citations to this article as recorded by 
- Changes in Ultra-Processed Food Consumption among Adolescents before and after the COVID-19 Pandemic : Using Data from the 7th (2018~2019) and 8th (2020~2021) Korea National Health and Nutrition Examination Survey
Hyun-Jin Hwang, Yoo Kyeong Kim
Korean Journal of Human Ecology.2024; 33(6): 981. CrossRef - Do types of snacks, sleep hours, and eating places affect nutritional intakes and its adequacy in adolescents?
Sora Kim, Jeonglee Kim, Hyeja Chang
Nutrition Research and Practice.2021; 15(3): 396. CrossRef - Analysis on the Relationship between Eating Behavior, Physical Activities and Youth Obesity: Based on the Korea Youth Risk Behavior Survey for High School Students in 2016~2018
Seung-Hoo Lee, Jong-Ho Lee
Information.2020; 11(3): 169. CrossRef - Relationship between the Intake of Children's Favorite Foods and Policy based on Special Act on Safety Control of Children's Dietary Life
Taejung Woo, Jihye Yoo, Kyung-Hea Lee
Korean Journal of Community Nutrition.2019; 24(2): 106. CrossRef - Diet and Physical Activity of Korean Female Adolescents in Their Peer Networks
Sophia Jihey Chung, Anne L. Ersig, Ann Marie McCarthy
Journal of Nursing Scholarship.2019; 51(2): 147. CrossRef - Systematic Review on the Study of the Childhood and Adolescent Obesity in Korea: Dietary Risk Factors
Eun Jeong Heo, Jae Eun Shim, Eun Young Yoon
Korean Journal of Community Nutrition.2017; 22(3): 191. CrossRef - Development of NQ-A, Nutrition Quotient for Korean Adolescents, to assess dietary quality and food behavior
Hye-Young Kim, Jung-Sug Lee, Ji-Yun Hwang, Sehyug Kwon, Hae Rang Chung, Tong-Kyung Kwak, Myung-Hee Kang, Young-Sun Choi
Journal of Nutrition and Health.2017; 50(2): 142. CrossRef - Food deserts in Korea? A GIS analysis of food consumption patterns at sub-district level in Seoul using the KNHANES 2008-2012 data
Dohyeong Kim, Chang Kil Lee, Dong Yeon Seo
Nutrition Research and Practice.2016; 10(5): 530. CrossRef - Dietary assessment according to frequency of food consumed away from home among children and adolescents: Based on the 2010~2012 Korea National Health and Nutrition Examination Survey
Yong-Suk Kwon, Wan-Soo Hong, Seyoung Ju
Journal of Nutrition and Health.2016; 49(6): 471. CrossRef - Associations between Exposure to Unhealthy Food Outlets Within Residential District and Obesity: Using Data from 2013 Census on Establishments and 2013-2014 Korea National Health and Nutrition Examination Survey
Yoonjung Kim, Sung Nim Han
Korean Journal of Community Nutrition.2016; 21(5): 463. CrossRef - The awareness level and needs for education on reducing sugar consumption among mothers with preschool children
Younhee Lee, Nami Joo
Nutrition Research and Practice.2016; 10(2): 229. CrossRef - Analysis of consumption frequencies of vegetables and fruits in Korean adolescents based on Korea youth risk behavior web-based survey (2006, 2011)
Yangsuk Kim, Yong-Suk Kwon, Young-Hee Park, Jeong-Sook Choe, Jin-Young Lee
Nutrition Research and Practice.2015; 9(4): 411. CrossRef - Evaluation of nutrient intake and food variety by age in Korean adolescents: Based on 2010~2012 Korean National Health and Nutrition Examination Survey
Yun-Jung Bae
Journal of Nutrition and Health.2015; 48(3): 236. CrossRef - Influences of Korean Haw (Crataegus pinnatifida BUNGE) on Lipid Concentration in Hypercholesterolemia
Han-Soo Kim, Min-A Kim, Seong-Ho Jang
Journal of Environmental Science International.2014; 23(5): 793. CrossRef - Influences of Wild Haw (Crataegus pinnatifida BUNGE) on Lowering BUN and Creatinine Concentrations in Dyslipidemia
Han-Soo Kim, Min-A Kim, Yishan Duan, Seong-Ho Jang, Han-Jin Cho, Jae-Young Ryu, Sang-Woo Kim
Journal of Environmental Science International.2014; 23(6): 1029. CrossRef - Effects of Haw (Crataegus pinnatifida BUNGE) on Relaxation in the Lipid Components and Blood Glucose of Lipid Metabolism Syndrome
Han-Soo Kim, Min-A Kim, Yishan Duan, Seong-Ho Jang, Won-Ki Lee, Jae-Young Ryu
Journal of Environmental Science International.2014; 23(6): 1021. CrossRef - A Survey on the Calorie and Nutrient in Children-favored Food within Green Food Zone in Gwangju
Yongshik Yang, Jungmi Seo, Sujin Mun, Taesun Kim, Bokyung Kim, Sooyeon Choi, Baesik Cho, Dongryong Ha, Eunsun Kim
Journal of Food Hygiene and Safety.2013; 28(4): 299. CrossRef - Characteristics of School Menus from the Daegu and Gyeongbuk Area
Seon Woo Ahn, Mi-Kyung Choi
Journal of the Korean Society of Food Science and Nutrition.2013; 42(6): 983. CrossRef
 Cite
CiteThe Relationship between High Energy/Low Nutrient Food Consumption and Obesity among Korean Children and Adolescents
The Relationship between High Energy/Low Nutrient Food Consumption and Obesity among Korean Children and Adolescents
Prevalence of overweight and obesity by gender and age (2 to 18 year old) in 2008
1) The estimated percent of population (standard error)
2) Korea National Health and Nutrition Examination Survey
3) 2007 Korean National Growth Charts. Underweight: < 5 percentile, Normal: 5 - 85 percentile, Overweight: 85 - 95 percentile, Obesity: ≥ 95 percentile or ≥ BMI 25
4) Criteria of weight status; underweight and normal → not obese; overweight and obese → obese
5) Korea Youth Risk Behavior Web-based Survey
*: p < 0.05, **: p < 0.01, ***: p < 0.001 (gender difference)
#: p < 0.05, ##: p < 0.01, ###: p < 0.001 (age difference)
^: p < 0.05 (year difference in 16 - 18y)
Prevalence of overweight and obesity by gender and age (2 to 18 year old) in 2009
1) The estimated percent of population (standard error)
2) Korea National Health and Nutrition Examination Survey
3) 2007 Korean National Growth Charts. Underweight: < 5 percentile, Normal: 5 - 85 percentile, Overweight: 85 - 95 percentile, Obesity: ≥ 95 percentile or ≥ BMI 25
4) Criteria of weight status; underweight and normal → not obese; overweight and obese → obese
5) Korea Youth Risk Behavior Web-based Survey
#: p < 0.05, ##: p < 0.01, ###: p < 0.001 (age difference)
^: p < 0.05 (Year difference)
Prevalence of overweight and obesity by gender and age (12 to 18 year old) in 2008
1) The estimated percent of population (standard error)
2) 2007 Korean National Growth Charts. Underweight: < 5 percentile, Normal: 5 - 85 percentile, Overweight: 85 - 95 percentile, Obesity: ≥ 95 percentile or ≥ BMI 25
3) Korea National Health and Nutrition Examination Survey
4) Korea Youth Risk Behavior Web-based Survey
5) Gender or age difference of KNHANES
6) Gender or age difference of KYRBWS
7) Year difference of KNHANES 16 - 18y
8) Criteria of weight status; underweight and normal → not obese; overweight and obese → obese
Prevalence of overweight and obesity by gender and age (12 to 18 year old) in 2009
1) The estimated percent of population (standard error)
2) 2007 Korean National Growth Charts. Underweight: < 5 percentile, Normal: 5 - 85 percentile, Overweight: 85 - 95 percentile, Obesity: ≥ 95 percentile or ≥ BMI 25
3) Korea National Health and Nutrition Examination Survey
4) Korea Youth Risk Behavior Web-based Survey
5) Gender or age difference of KNHANES
6) Gender or age difference of KYRBWS
7) Year difference of KNHANES 16-18y
8) Criteria of weight status; underweight and normal → not obese; overweight, and obese → obese
Consumption frequency of High energy/Low nutrient food types ( 12 - 18 ages) in 2008
1) Korea National Health and Nutrition Examination Survey
2) Korea Youth Risk Behavior Web-based Survey
3) The estimated percent of population (standard error)
*: p < 0.05, ***: p < 0.001
Consumption frequency of High energy/Low nutrient food types (12 - 18 ages) in 2009
1) Korea National Health and Nutrition Examination Survey
2) Korea Youth Risk Behavior Web-based Survey
3) The estimated percent of population (standard error)
*: p < 0.05, **: p < 0.01, ***: p < 0.001
Consumption frequency of high energy/low nutrient food types between not obese and obese group (12 - 18 ages) in 2008)
1) Korea National Health and Nutrition Examination Survey
2) Korea Youth Risk Behavior Web-based Survey
3) 2007 Korean National Growth Charts. Not obese: < 85 percentile, Obese: ≥ 85 percentile or ≥ BMI 25
4) The estimated percent of population (standard error)
***: p < 0.001
Consumption frequency of high energy/low nutrient food types between obese and non-obese group (12 - 18 ages) in 2009
1) Korea National Health and Nutrition Examination Survey
2) Korea Youth Risk Behavior Web-based Survey
3) 2007 Korean National Growth Charts. Not obese: < 85 percentile, Obese: ≥ 85 percentile or ≥ BMI 25
4) The estimated percent of population (standard error)
*: p < 0.05, **: p < 0.01, ***: p < 0.001
Energy and nutrients intake by high energy/low nutrient food consumption1) (KNHANES)
Values are Mean ± SE
1) High energy/low nutrient foods were determined by the High energy/low nutrient food list from Korea Food & Drug Administration.
2) Percentage energy from carbohydrate compared to total energy intake per day
3) Percentage energy from protein compared to the total energy intake per day
4) Percentage energy from fat compared to the total energy intake per day
**: p < 0.01, ***: p < 0.001 intake group difference 2008
^^: p < 0.01, ^^^: p < 0.001 intake group difference 2009
#: p < 0.05 year difference in total
Relationship between high energy/low nutrient food consumption and energy and nutrient intake adequacy1)
1) Covariates: Gender, age, weight, quartile of income
2) OR: Odd Ratio Reference: Sufficiency Criteria of energy, carbohydrate, protein, fat and sodium
3) Meeting 75% - 125% of the Estimated Energy Requirement (EER) reference for gender and age in the Dietary Reference Intake for Koreans
4) High energy/low nutrient foods were determined by the High energy/low nutrient food list from Korea Food & Drug Administration
5) Meeting 75% - 125% of the individually calculated Estimated Energy Requirement (EER) using the formulas in the Dietary Reference Intake for Koreans
6) Intake adequacy was determined by meeting the Acceptable Macronutrient Distribution Ranges (AMDR) for age. Carbohydrate 55 - 70%, Protein 7 - 20%, Fat 2y: 20 - 35%, 3 - 18 y: 15 - 30%
7) Intake adequacy was determined by consuming less than the Standard of Target nutrient intake
Energy and nutrient intake from high energy/low nutrient food1) between obese and non-obese group (KNHANES)
Values are Mean ± SE
1) High energy/low nutrient foods were determined by the High energy/low nutrient food list from Korea Food & Drug Administration
2) 2007 Korean National Growth Charts. Not obese: < 85 percentile, Obese: ≥ 85 percentile or ≥ BMI 25
3) Energy intake from high energy/low nutrient food as percentage of the total energy consumed per day
4) Protein intake from high energy/low nutrient food as percentage of the total protein consumed per day
5) Fat intake from high energy/low nutrient food as percentage of the total fat consumed per day
6) Carbohydrate intake from high energy/low nutrient food as a percentage of the total carbohydrate consumed per day
7) Sodium intake from high energy/low nutrient food as a percentage of the total carbohydrate consumed per day
8) Amount of intake from high energy/low nutrient food as a percentage of the total amount of food consumed per day
*: p < 0.05 (year difference in the obese group)
Table 1
Prevalence of overweight and obesity by gender and age (2 to 18 year old) in 2008
1) The estimated percent of population (standard error) 2) Korea National Health and Nutrition Examination Survey 3) 2007 Korean National Growth Charts. Underweight: < 5 percentile, Normal: 5 - 85 percentile, Overweight: 85 - 95 percentile, Obesity: ≥ 95 percentile or ≥ BMI 25 4) Criteria of weight status; underweight and normal → not obese; overweight and obese → obese 5) Korea Youth Risk Behavior Web-based Survey *: p < 0.05, **: p < 0.01, ***: p < 0.001 (gender difference) #: p < 0.05, ##: p < 0.01, ###: p < 0.001 (age difference) ^: p < 0.05 (year difference in 16 - 18y)
Table 2
Prevalence of overweight and obesity by gender and age (2 to 18 year old) in 2009
1) The estimated percent of population (standard error) 2) Korea National Health and Nutrition Examination Survey 3) 2007 Korean National Growth Charts. Underweight: < 5 percentile, Normal: 5 - 85 percentile, Overweight: 85 - 95 percentile, Obesity: ≥ 95 percentile or ≥ BMI 25 4) Criteria of weight status; underweight and normal → not obese; overweight and obese → obese 5) Korea Youth Risk Behavior Web-based Survey #: p < 0.05, ##: p < 0.01, ###: p < 0.001 (age difference) ^: p < 0.05 (Year difference)
Table 3
Prevalence of overweight and obesity by gender and age (12 to 18 year old) in 2008
1) The estimated percent of population (standard error) 2) 2007 Korean National Growth Charts. Underweight: < 5 percentile, Normal: 5 - 85 percentile, Overweight: 85 - 95 percentile, Obesity: ≥ 95 percentile or ≥ BMI 25 3) Korea National Health and Nutrition Examination Survey 4) Korea Youth Risk Behavior Web-based Survey 5) Gender or age difference of KNHANES 6) Gender or age difference of KYRBWS 7) Year difference of KNHANES 16 - 18y 8) Criteria of weight status; underweight and normal → not obese; overweight and obese → obese
Table 4
Prevalence of overweight and obesity by gender and age (12 to 18 year old) in 2009
1) The estimated percent of population (standard error) 2) 2007 Korean National Growth Charts. Underweight: < 5 percentile, Normal: 5 - 85 percentile, Overweight: 85 - 95 percentile, Obesity: ≥ 95 percentile or ≥ BMI 25 3) Korea National Health and Nutrition Examination Survey 4) Korea Youth Risk Behavior Web-based Survey 5) Gender or age difference of KNHANES 6) Gender or age difference of KYRBWS 7) Year difference of KNHANES 16-18y 8) Criteria of weight status; underweight and normal → not obese; overweight, and obese → obese
Table 5
Consumption frequency of High energy/Low nutrient food types ( 12 - 18 ages) in 2008
1) Korea National Health and Nutrition Examination Survey 2) Korea Youth Risk Behavior Web-based Survey 3) The estimated percent of population (standard error) *: p < 0.05, ***: p < 0.001
Table 6
Consumption frequency of High energy/Low nutrient food types (12 - 18 ages) in 2009
1) Korea National Health and Nutrition Examination Survey 2) Korea Youth Risk Behavior Web-based Survey 3) The estimated percent of population (standard error) *: p < 0.05, **: p < 0.01, ***: p < 0.001
Table 7
Consumption frequency of high energy/low nutrient food types between not obese and obese group (12 - 18 ages) in 2008)
1) Korea National Health and Nutrition Examination Survey 2) Korea Youth Risk Behavior Web-based Survey 3) 2007 Korean National Growth Charts. Not obese: < 85 percentile, Obese: ≥ 85 percentile or ≥ BMI 25 4) The estimated percent of population (standard error) ***: p < 0.001
Table 8
Consumption frequency of high energy/low nutrient food types between obese and non-obese group (12 - 18 ages) in 2009
1) Korea National Health and Nutrition Examination Survey 2) Korea Youth Risk Behavior Web-based Survey 3) 2007 Korean National Growth Charts. Not obese: < 85 percentile, Obese: ≥ 85 percentile or ≥ BMI 25 4) The estimated percent of population (standard error) *: p < 0.05, **: p < 0.01, ***: p < 0.001
Table 9
Energy and nutrients intake by high energy/low nutrient food consumption1) (KNHANES)
Values are Mean ± SE 1) High energy/low nutrient foods were determined by the High energy/low nutrient food list from Korea Food & Drug Administration. 2) Percentage energy from carbohydrate compared to total energy intake per day 3) Percentage energy from protein compared to the total energy intake per day 4) Percentage energy from fat compared to the total energy intake per day **: p < 0.01, ***: p < 0.001 intake group difference 2008 ^^: p < 0.01, ^^^: p < 0.001 intake group difference 2009 #: p < 0.05 year difference in total
Table 10
Relationship between high energy/low nutrient food consumption and energy and nutrient intake adequacy1)
1) Covariates: Gender, age, weight, quartile of income 2) OR: Odd Ratio Reference: Sufficiency Criteria of energy, carbohydrate, protein, fat and sodium 3) Meeting 75% - 125% of the Estimated Energy Requirement (EER) reference for gender and age in the Dietary Reference Intake for Koreans 4) High energy/low nutrient foods were determined by the High energy/low nutrient food list from Korea Food & Drug Administration 5) Meeting 75% - 125% of the individually calculated Estimated Energy Requirement (EER) using the formulas in the Dietary Reference Intake for Koreans 6) Intake adequacy was determined by meeting the Acceptable Macronutrient Distribution Ranges (AMDR) for age. Carbohydrate 55 - 70%, Protein 7 - 20%, Fat 2y: 20 - 35%, 3 - 18 y: 15 - 30% 7) Intake adequacy was determined by consuming less than the Standard of Target nutrient intake
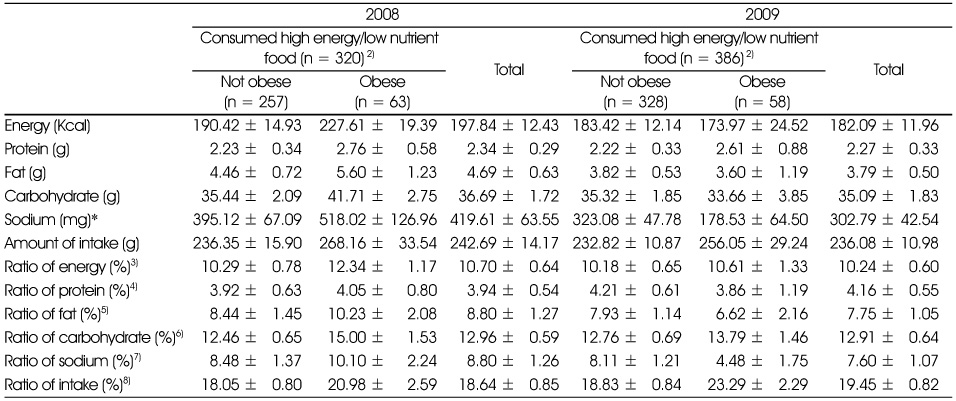
Table 11
Energy and nutrient intake from high energy/low nutrient food1) between obese and non-obese group (KNHANES)
Values are Mean ± SE 1) High energy/low nutrient foods were determined by the High energy/low nutrient food list from Korea Food & Drug Administration 2) 2007 Korean National Growth Charts. Not obese: < 85 percentile, Obese: ≥ 85 percentile or ≥ BMI 25 3) Energy intake from high energy/low nutrient food as percentage of the total energy consumed per day 4) Protein intake from high energy/low nutrient food as percentage of the total protein consumed per day 5) Fat intake from high energy/low nutrient food as percentage of the total fat consumed per day 6) Carbohydrate intake from high energy/low nutrient food as a percentage of the total carbohydrate consumed per day 7) Sodium intake from high energy/low nutrient food as a percentage of the total carbohydrate consumed per day 8) Amount of intake from high energy/low nutrient food as a percentage of the total amount of food consumed per day *: p < 0.05 (year difference in the obese group)


