
Articles
- Page Path
- HOME > Korean J Community Nutr > Volume 16(4); 2011 > Article
-
Original Article
- Comparison of the Nutrient Intakes by the Score of Dietary Action Guides for Korean Children among the Elementary School Students in Gwangju City
- Bok Hee Kim, Mi-young Sung, Yoonna Lee
-
Korean Journal of Community Nutrition 2011;16(4):411-425.
DOI: https://doi.org/10.5720/kjcn.2011.16.4.411
Published online: August 31, 2011
Department of Food and Nutrition, Chosun University, Gwangju, Korea.
1Graduate School of Education, Chosun University, Gwangju, Korea.
2Nutrition Policy & Promotion Team, Korea Health Industry Development Institute, Cheongwon-gun, Korea.
- Corresponding author: Yoonna Lee, Osong Health Technology Administration Complex, 187 Osongsaengmyeong2-ro, Gangoe-myeon, Cheongwon-gun, Chungcheongbuk-do 363-951, Korea. Tel: (043) 713-8616, Fax: (043) 713-8907, ynlee@khidi.or.kr
• Received: August 4, 2011 • Revised: August 24, 2011 • Accepted: August 25, 2011
Copyright © 2011 The Korean Society of Community Nutrition
- 1,908 Views
- 3 Download
- 16 Crossref
Abstract
- This study was conducted to examine differences in nutrient intakes by the compliance with the Dietary Action Guide for Korean Children. The subjects included 343 elementary school students in Gwangju city. Compliance with the Dietary Action Guide for Children showed that 62.4% of subjects had breakfast everyday; 44.3% of subjects ate vegetables/fruits/milk and dairy products daily; 26.8% of subjects ate a variety of lean meats/fish/eggs/bean products daily; 32.9% of subjects enjoyed outdoor activity everyday and ate according to their energy needs; 40.2% of subjects chose healthy and nutritious foods for snack; and 15.5% of subjects avoided food waste. Intakes of most of nutrients including energy were significantly higher (p < 0.05) in those who complied with the Dietary Action Guide well. Also nutrient intakes had the positive correlation with the scores of Dietary Action Guide (p < 0.05). From these results, nutrient intakes of children were significantly influenced by dietary factors suggested in the Dietary Action Guide for Children. In addition, the results also confirmed that good food behaviors were indispensible to maintaining a proper nutritional status. Based on these results, good food behaviors and practice were critical to secure good health and proper nutritional status for children, and that nutrition education should be strengthened in school as well as at home.
- 1. Chang HS. The assessment of diet quality according to exercise practices of middle school students. Korean J Exerc Nutr. 2004; 8(3): 295-301.
- 2. Chung SJ, Lee Y, Kwon SJ. Factors associated with breakfast skipping in elementary school children in Korea. Korean J Community Nutr. 2004; 9(1): 3-11.
- 3. Ha JS, Lee HG. Effects of middle-school student's food behavior on health condition and degree of school accomplishment. J Korean Home Econ Assoc. 1995; 33(3): 225-242.
- 4. Kim BH, Park BC, Lee SJ. Relationship among consumption frequency of snacks containing trans fatty acid, food behaviors, body composition, and nutrient intakes of adolescents living in Kwang-ju area. Korean J Food Cult. 2008; 23(3): 410-419.
- 5. Kim BR, Cho YE. A study on the evaluation of food intake of middle school students in Kangneung. J Korean Soc Food Sci Nutr. 2001; 30(5): 986-992.
- 6. Kim GM, Lee SY. The study on nutritional knowledge and eating behavior of elementary school senior students in Incheon area. J Korean Diet Assoc. 2000; 6(2): 97-107.
- 7. Kim SY, Lee HJ. The influence of food habits on nutrient intake and body mass index in elementary school students in the Gyeongnam area. Korean J Community Nutr. 2007; 12(6): 705-713.
- 8. Kim YH, Jang MR. A research on analysis of eating habits and textbook contents for efficient nutrition of elementary school students in Gangneung city. J Korean Diet Assoc. 2007; 13(4): 379-388.
- 9. Kim YO. Identification of the dietary intake patterns of Korean adults according to their exercise levels. Korean J Community Nutr. 2002; 7(6): 769-778.
- 10. Korean Nutrition Society. Dietary reference intakes for Koreans. 2005.
- 11. Ko YJ, Kim YN, Mo SM. A study on eating behavior of middle school third grade students. Korean J Nutr. 1991; 24(5): 458-468.
- 12. Ku PJ, Lee KY. A survey on dietary habit and nutritional knowledge for elementary school children's nutritional education. Korean J Food Cult. 2000; 15(3): 201-213.
- 13. Lee JE, Jung IK. The perception of parents on the eating habits and nutritional education of their elementary school children. J Korean Home Econ Assoc. 2005; 43(7): 67-77.
- 14. Lee JS, Chang KJ. The relationship between the diversity of food Intake and nutrient intake among Korean college students participating in a nutrition education class via internet. Korean J Community Nutr. 2003; 8(5): 689-698.
- 15. Lee SS, Choi IS, Oh SH. The eating behavior and nutrient intakes of third grade primary school children in Kwangju. J Korean Soc Food Sci Nutr. 1999; 28(5): 1172-1179.
- 16. Lim HJ. Assessment of dietary intake of preschool children in Busan; Assessment based on food group intake. Korean J Community Nutr. 2001; 6(1): 3-15.
- 17. Ministry of Health and Welfare. Revision of Dietary Guidelines for Koreans (2003: dietary action guides for infants & toddlers, pregnant & lactating women, children, and adolescents). 2003; 22-28.
- 18. Ministry of Health and Welfare. Revision of Dietary Guidelines for Koreans-. Infants, Children, and Adolescents. 2010.
- 19. Ministry of Health and Welfare. National Health and Nutrition Survey-Nutrition Survey. 2006; 32-33.
- 20. Moon SJ, Lee MH. An effect of children's food attitude on nutritional status and personality. Korean J Nutr. 1987; 20(4): 258-271.
- 21. Park HO, Kim EK, Chi KY, Kwak TK. Comparison of the nutrition knowledge, food habits and life style of obese children and normal children in elementary school in Kyeong-gi province. Korean J Community Nutr. 2000; 5(4): 586-597.
- 22. Sung CJ, Sung MK, Choi MK, Kang YL, Kwon SJ, Kim MH, Seo YL, Adachi M, Mo SM. An ecological study of food and nutrition in elementary school children in Korea. Korean J Community Nutr. 2001; 6(2): 150-161.
- 23. Sung SJ, Kwon S. Effect of eating with family or alone on the self-rated mental or physical health -The elementary school children in Daejeon area. Korean J Community Nutr. 2010; 15(2): 206-226.
- 24. Wang SG. Prevalence of obesity, food habits, and daily nutrient intakes of 4th grade elementary school students in Daejeon. Korean J Hum Ecol. 2007; 16(3): 631-642.Article
- 25. Yoon HS, Yang HL, Her ES. Effect of nutrition education program on nutrition knowledge, dietary diversity of elementary school children. Korean J Community Nutr. 2000; 5(3): 513-521.
- 26. You JS, Choi YJ, Kim IS, Chang KJ, Chyun JH. A study on prevalence of obesity, eating habits and life style of 5th grade students in Incheon. Korean J Community Nutr. 1997; 2(1): 13-22.
- 27. Yu OK, Park SH, Cha YS. Eating habits, eating behaviors and nutritional knowledge of higher grade elementary school students in Jeonju area. Korean J Food Cult. 2007; 22(6): 665-672.
REFERENCES
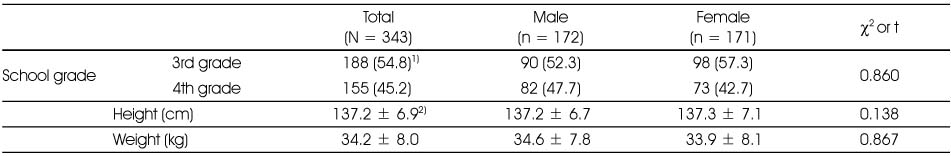
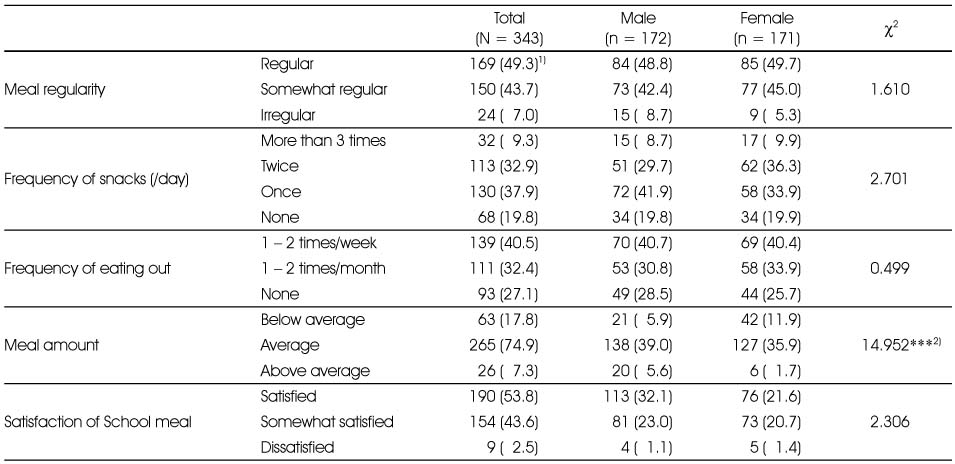
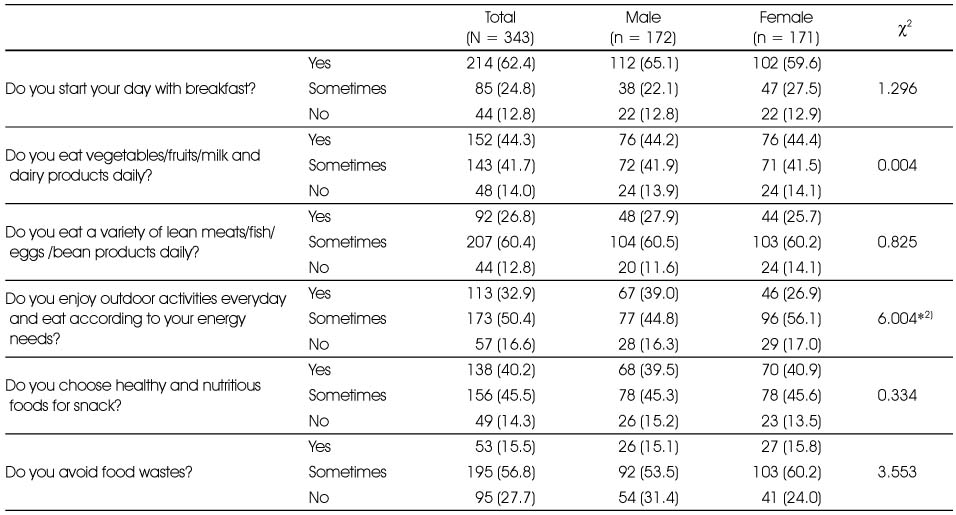
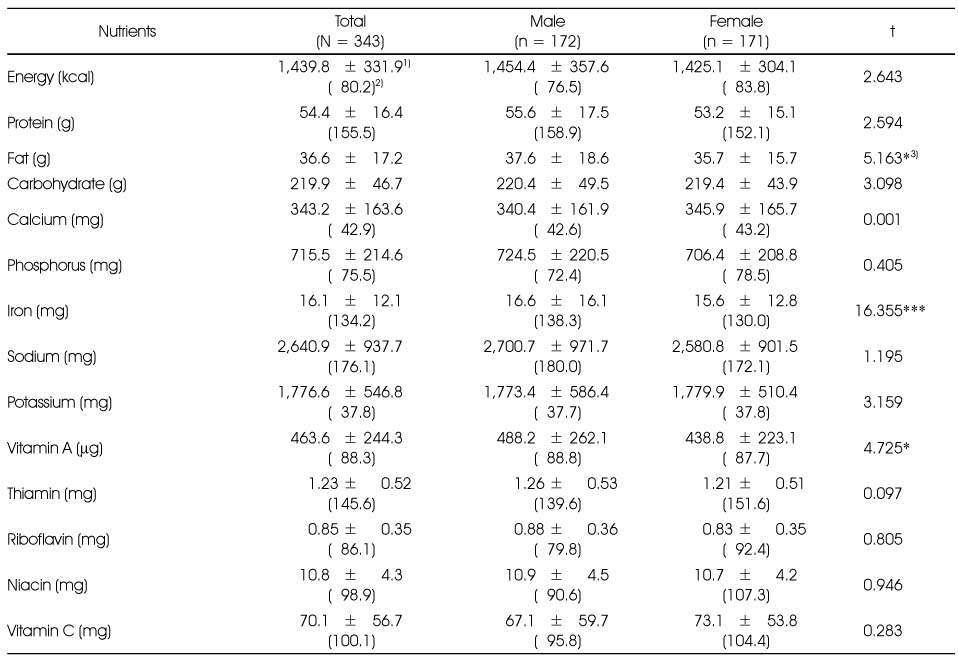
Table 5Nutrient intake levels by the compliance with Dietary Action Guide 1: starting a day with breakfast
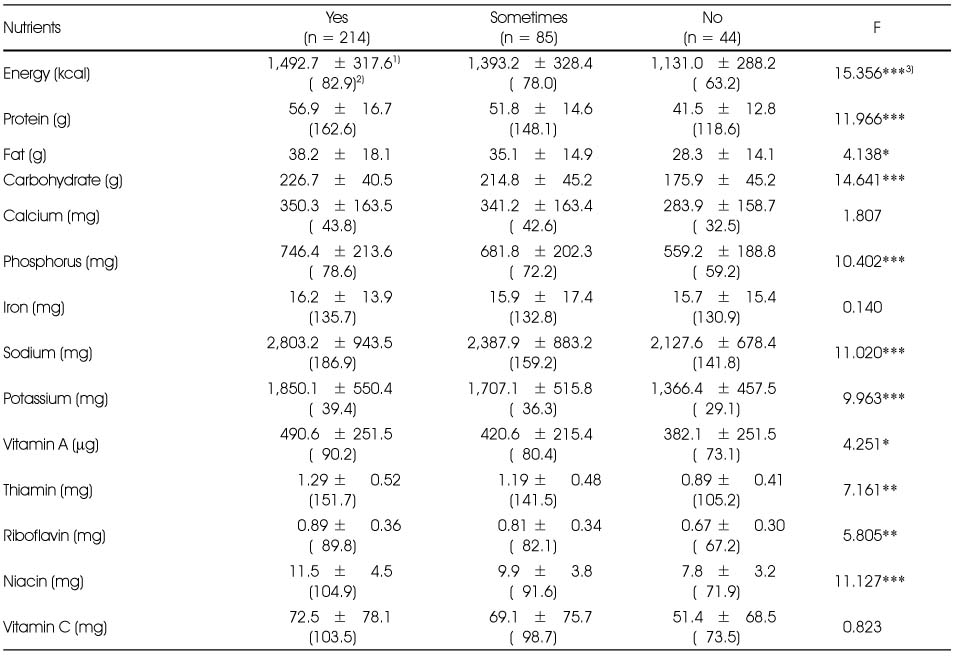
Table 6Nutrient intake levels by the compliance with Dietary Action Guide 2: eating vegetables/fruits/milk and dairy products daily
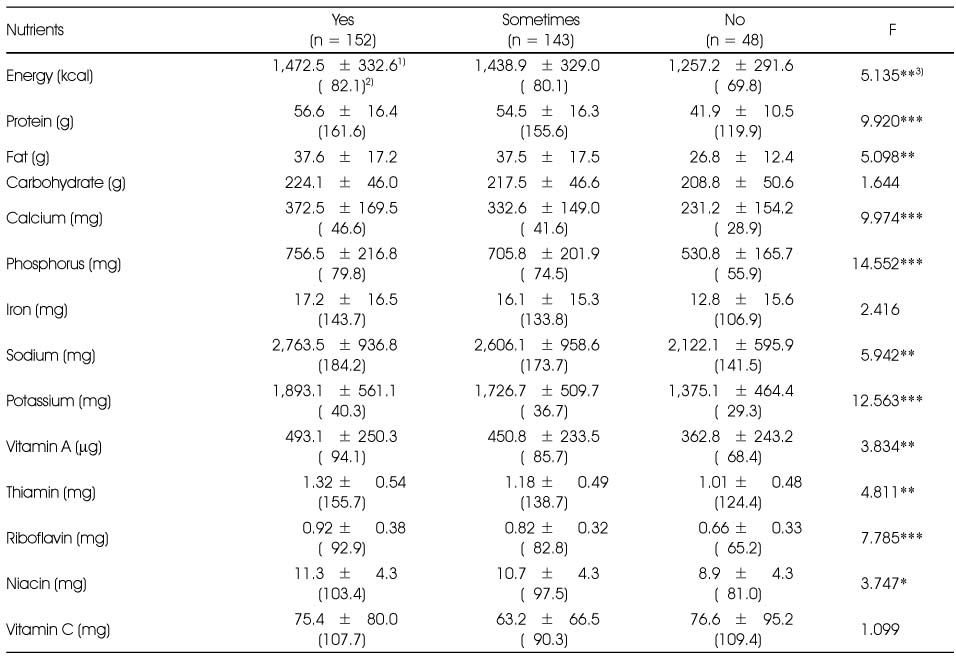
Table 7Nutrient intake levels by the compliance with Dietary Action Guide 3: eating a variety of lean meats/fish/eggs/bean products daily
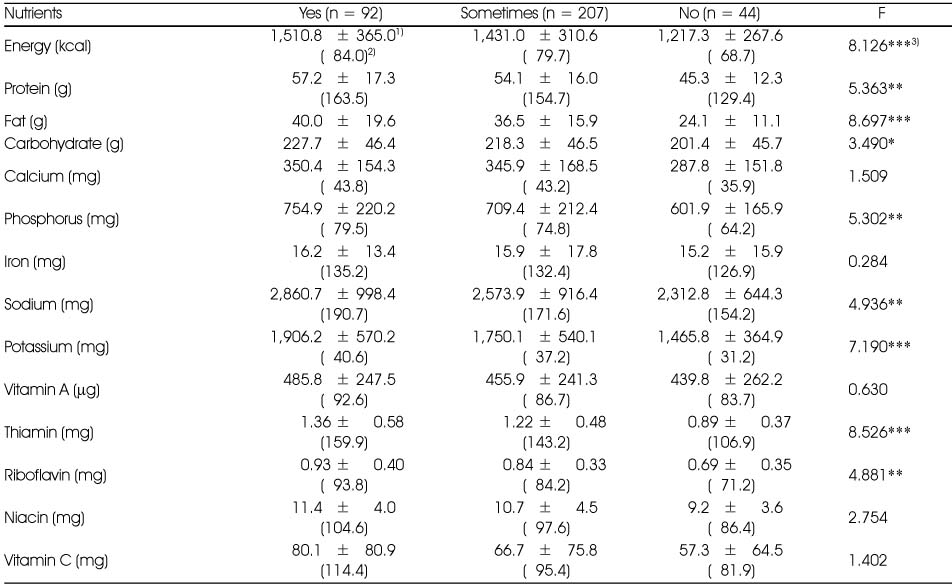
Table 8Nutrient intake levels by the compliance with Dietary Action Guide 4: enjoying outdoor activities everyday and eat according to your energy needs
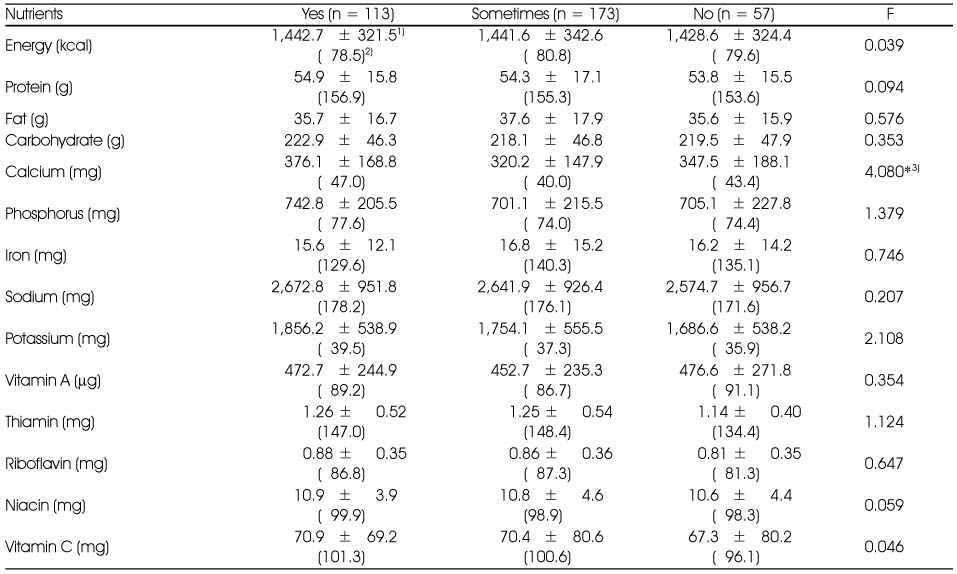
Table 9Nutrient intake levels by by the compliance with Dietary Action Guide 5: choosing healthy and nutritious foods for snack
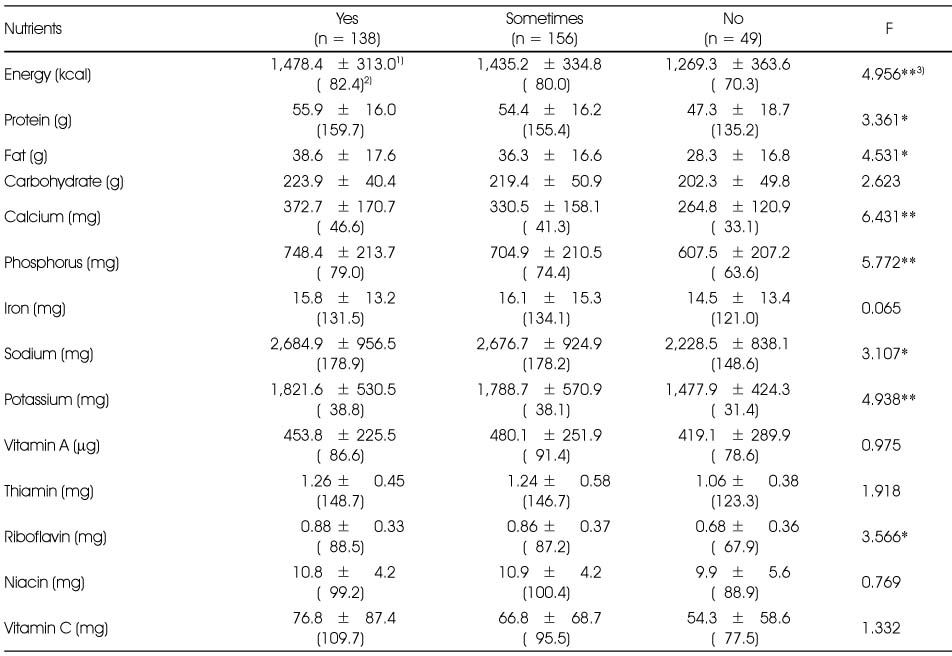
Table 10Nutrient intake levels by by the compliance with Dietary Action Guide 6: avoiding food wastes
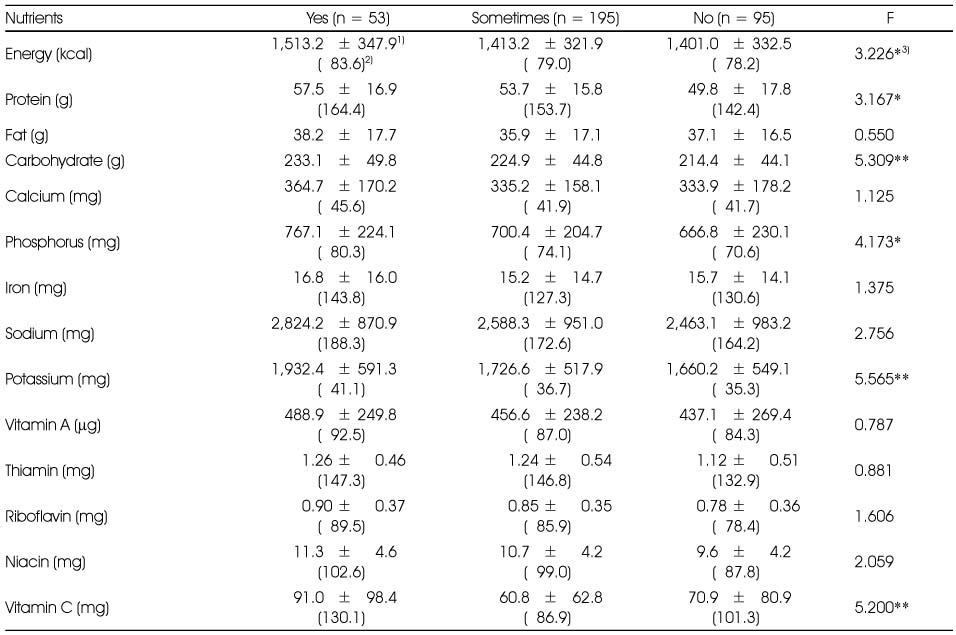
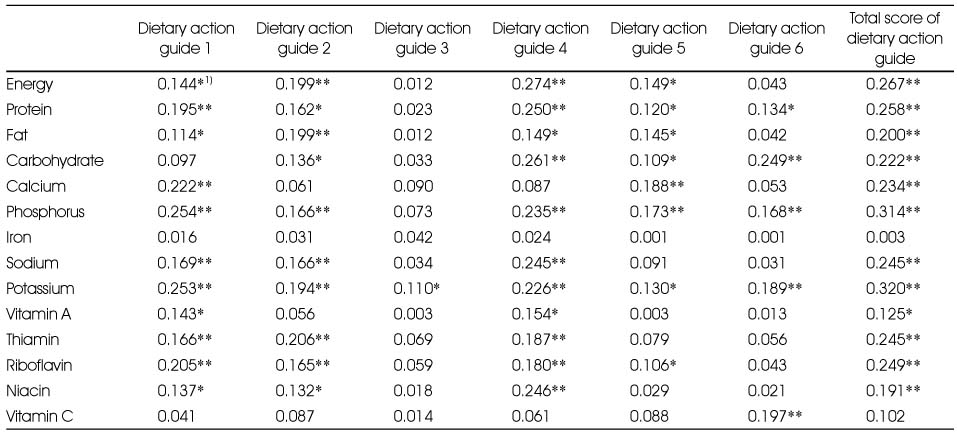
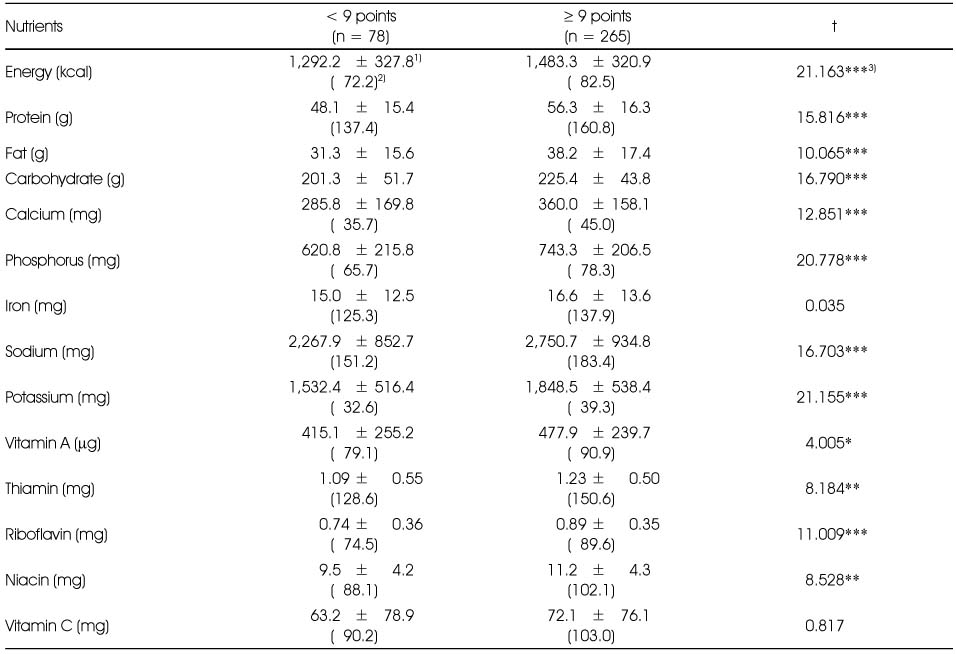
Figure & Data
REFERENCES
Citations
Citations to this article as recorded by 
- Dietary guidelines adherence and changes in eating habits among college students in the post-COVID-19 period: a cross-sectional study
Eunyoung Yoon
Korean Journal of Community Nutrition.2023; 28(3): 220. CrossRef - Evaluation of Dietary Behavior among Elementary School Students in Seoul Area Using Nutrition Quotient for Children
Ji Ye Lim, Jung Hyun Kim, Sung Hee Min, Myung Hee Lee, Min June Lee
Korean Journal of Food & Cookery Science.2016; 32(1): 84. CrossRef - Gender Differences in Adolescents' Dietary Perceptions and Practices
Taejung Woo, Hye-Jin Lee, Kyoung Ae Lee, Seung Min Lee, Kyung-Hea Lee
Korean Journal of Community Nutrition.2016; 21(2): 165. CrossRef - Evaluation of Obesity and Nutritional Status by Age among Low-income Women aged over 20 -Using Data from the Fourth Korea National Health and Nutrition Examination Survey-
Hee-Kyung Jang
Journal of the East Asian Society of Dietary Life.2015; 25(2): 246. CrossRef - Relationships between children's Nutrition Quotient and the practice of the Dietary Guidelines of elementary school students and their mothers
Jae Ran Kim, Hyeon-Sook Lim
Journal of Nutrition and Health.2015; 48(1): 58. CrossRef - Relationships between children's Nutrition Quotient and the practice of the Dietary Guidelines of elementary school students and their mothers
Jae Ran Kim, Hyeon-Sook Lim
Journal of Nutrition and Health.2015; 48(1): 58. CrossRef - Relationships of Dietary Behavioral Factors and Stress Perception Levels in College Students in Gwang-ju City
Bok Hee Kim, Bang Geul Shim, Eun Jeong
The Korean Journal of Food And Nutrition.2014; 27(5): 771. CrossRef - A Survey of Satisfaction with Quality attributes of Meal Services for Low-income Children in Wonju
Hae Sook Oh
The Korean Journal of Community Living Science.2014; 25(2): 233. CrossRef - An Evaluation of Dietary Habit and Nutritional Status by Household Income in Female Adults over the Age of 20 - Using Data from the Fourth Korea National Health and Nutrition Examination Survey -
Hee-Kyung Jang
The Korean Journal of Food And Nutrition.2014; 27(4): 660. CrossRef - Relationship between adhering to dietary guidelines and the risk of obesity in Korean children
Soo Hyun Yu, YoonJu Song, Mijung Park, Shin Hye Kim, Sangah Shin, Hyojee Joung
Nutrition Research and Practice.2014; 8(6): 705. CrossRef - Association between the Number of Unfamiliar Vegetables and Dietary Factors of Elementary School Children
Kyunghee Song, Hongmie Lee
Preventive Nutrition and Food Science.2013; 18(4): 280. CrossRef - The prevalence of obesity and the level of adherence to the Korean Dietary Action Guides in Korean preschool children
Yuni Choi, Yeji You, Kyeong Ah Go, Zuunnast Tserendejid, Hyun Joo You, Jung Eun Lee, Seungmin Lee, Hae-Ryun Park
Nutrition Research and Practice.2013; 7(3): 207. CrossRef - Awareness and Practice of Dietary Action Guide for Adolescence among Middle and High School Students in Korea
So-Hyun Park, Hae-Ryun Park, Soo-Bin Jeon, So-Yeon Jeong, Zuunnast Tserendejid, Jung-Sook Seo, Kyung-Hae Lee, Yeon-Kyung Lee
Korean Journal of Community Nutrition.2012; 17(2): 133. CrossRef - Correlation between Intake of Dietary Fiber and Adherence to the Korean National Dietary Guidelines in Adolescents from Jeonju
Sunmi Park, Woori Na, Misung Kim, Eunsoo Kim, Cheongmin Sohn
Preventive Nutrition and Food Science.2012; 17(4): 254. CrossRef - Association between dental caries experience and performance of the dietary action guides among the special school for students of disability
Hee-Jung Moon, Seol-Ak Kim, Hee-Jung Park
Journal of Korean society of Dental Hygiene.2012; 12(6): 1193. CrossRef - Development and Effects' Analysis of Nutrition Education Pamphlet for the Lower Grades Elementary Students -Focused on Individual Daily Needed Food Exchange Units-
Min-Jung Son, Young-Sook Cho, Se-Na Kim, Hye-Ji Seo, Sook-Bae Kim
Korean Journal of Community Nutrition.2011; 16(6): 647. CrossRef
 Cite
CiteComparison of the Nutrient Intakes by the Score of Dietary Action Guides for Korean Children among the Elementary School Students in Gwangju City
Comparison of the Nutrient Intakes by the Score of Dietary Action Guides for Korean Children among the Elementary School Students in Gwangju City
General charcteristics of subjects
1) N (%)
2) Mean ± SD
Food behaviors of subjects
1) N (%)
2) ***: p < 0.001
Performance of the Dietary Action Guides for children in subjects
1) N (%)
2) *: p < 0.05
Nutrient intakes of subjects
1) Mean ± SD
2) %DRI (energy for EER, sodium for AI, and other nutrients for RI of KDRIs)
3) *: p < 0.05, ***: p < 0.001
Nutrient intake levels by the compliance with Dietary Action Guide 1: starting a day with breakfast
1) Mean ± SD
2) % KDRIs (%EER for energy, %AI for sodium, and %RI for other nutrients)
3) *: p < 0.05, **: p < 0.01, ***: p < 0.001
Nutrient intake levels by the compliance with Dietary Action Guide 2: eating vegetables/fruits/milk and dairy products daily
1) Mean ± SD
2) % KDRIs (%EER for energy, %AI for sodium, and %RI for other nutrients)
3) *: p < 0.05, **: p < 0.01, ***: p < 0.001
Nutrient intake levels by the compliance with Dietary Action Guide 3: eating a variety of lean meats/fish/eggs/bean products daily
1) Mean ± SD, 2) % KDRIs (%EER for energy, %AI for sodium, and %RI for other nutrients)
3) *: p < 0.05, **: p < 0.01, ***: p < 0.001
Nutrient intake levels by the compliance with Dietary Action Guide 4: enjoying outdoor activities everyday and eat according to your energy needs
1) Mean ± SD, 2) % KDRIs (%EER for energy, %AI for sodium, and %RI for other nutrients), 3) *: p < 0.05
Nutrient intake levels by by the compliance with Dietary Action Guide 5: choosing healthy and nutritious foods for snack
1) Mean ± SD
2) % KDRIs (%EER for energy, %AI for sodium, and %RI for other nutrients)
3) *: p < 0.05, **: p < 0.01
Nutrient intake levels by by the compliance with Dietary Action Guide 6: avoiding food wastes
1) Mean ± SD, 2) % KDRIs (%EER for energy, %AI for sodium, and %RI for other nutrients)
3) *: p < 0.05, **: p < 0.01
Correlation coefficients between nutrient intakes and Dietary Action Guides for children
1) *: p < 0.05, **: p < 0.01, ***: p < 0.001
Comparison of the Nutrient intakes by the total score of Dietary Action Guides for children
1) Mean ± SD
2) % KDRIs (%EER for energy, %AI for sodium, and %RI for other nutrients)
3) *: p < 0.05, **: p < 0.01, ***: p < 0.001
Table 1
General charcteristics of subjects
1) N (%) 2) Mean ± SD
Table 2
Food behaviors of subjects
1) N (%) 2) ***: p < 0.001
Table 3
Performance of the Dietary Action Guides for children in subjects
1) N (%) 2) *: p < 0.05
Table 4
Nutrient intakes of subjects
1) Mean ± SD 2) %DRI (energy for EER, sodium for AI, and other nutrients for RI of KDRIs) 3) *: p < 0.05, ***: p < 0.001
Table 5
Nutrient intake levels by the compliance with Dietary Action Guide 1: starting a day with breakfast
1) Mean ± SD 2) % KDRIs (%EER for energy, %AI for sodium, and %RI for other nutrients) 3) *: p < 0.05, **: p < 0.01, ***: p < 0.001
Table 6
Nutrient intake levels by the compliance with Dietary Action Guide 2: eating vegetables/fruits/milk and dairy products daily
1) Mean ± SD 2) % KDRIs (%EER for energy, %AI for sodium, and %RI for other nutrients) 3) *: p < 0.05, **: p < 0.01, ***: p < 0.001
Table 7
Nutrient intake levels by the compliance with Dietary Action Guide 3: eating a variety of lean meats/fish/eggs/bean products daily
1) Mean ± SD, 2) % KDRIs (%EER for energy, %AI for sodium, and %RI for other nutrients) 3) *: p < 0.05, **: p < 0.01, ***: p < 0.001
Table 8
Nutrient intake levels by the compliance with Dietary Action Guide 4: enjoying outdoor activities everyday and eat according to your energy needs
1) Mean ± SD, 2) % KDRIs (%EER for energy, %AI for sodium, and %RI for other nutrients), 3) *: p < 0.05
Table 9
Nutrient intake levels by by the compliance with Dietary Action Guide 5: choosing healthy and nutritious foods for snack
1) Mean ± SD 2) % KDRIs (%EER for energy, %AI for sodium, and %RI for other nutrients) 3) *: p < 0.05, **: p < 0.01
Table 10
Nutrient intake levels by by the compliance with Dietary Action Guide 6: avoiding food wastes
1) Mean ± SD, 2) % KDRIs (%EER for energy, %AI for sodium, and %RI for other nutrients) 3) *: p < 0.05, **: p < 0.01
Table 11
Correlation coefficients between nutrient intakes and Dietary Action Guides for children
1) *: p < 0.05, **: p < 0.01, ***: p < 0.001
Table 12
Comparison of the Nutrient intakes by the total score of Dietary Action Guides for children
1) Mean ± SD 2) % KDRIs (%EER for energy, %AI for sodium, and %RI for other nutrients) 3) *: p < 0.05, **: p < 0.01, ***: p < 0.001


