Articles
- Page Path
- HOME > Korean J Community Nutr > Volume 25(2); 2020 > Article
- Research Article
- Evaluation of Nutritional Status among Primary School Children in Uganda: Comparison of Urban and Rural Areas
- Ji-Yeon Lee, Hye-Jung Park, Min Yu, Ha-Yeong Hwang, Jung-Rim Sung, Hee-Seon Kim
-
Korean Journal of Community Nutrition 2020;25(2):91-101.
DOI: https://doi.org/10.5720/kjcn.2020.25.2.91
Published online: April 30, 2020

2Department of Food Science and Nutrition, Soonchunhyang University, Asan, Korea, Student

3Seoul Gangil Elementary, Seoul, Korea, Nutrition teacher

4Department of Food Science and Nutrition, Soonchunhyang University, Asan, Korea, Professor

-
Corresponding author:
Hee-Seon Kim,
Email: hskim1@sch.ac.kr
- 885 Views
- 17 Download
- 0 Crossref
- 0 Scopus
Abstract
Objectives
The aim of this study was to investigate dietary intakes and nutritional status among Uganda primary school children from two selected schools in urban and rural areas.
Methods
Data were collected from 350 pupils (6-14 years) in Mpigi district, Uganda. All participants were offered a school lunch meal (usually maize porridge and boiled beans). Dietary survey was conducted in October 2016. Data for dietary intake levels were collected by the 24-hour recall method with trained school staffs. The data were converted into nutrient intakes using the CAN-Pro 5.0 Program and compared with KDRIs to evaluate the nutritional status of the subjects. Diet quality indexes such as nutrient density, nutrient adequacy ratio (NAR), mean adequacy ratio (MAR), and index of nutritional quality (INQ) and a diet diversity index such as diet diversity score (DDS) were calculated to evaluate nutritional status among subjects. Data were analyzed using SPSS statistical programs.
Results
Results show that the intakes of most nutrients were significantly different by schools. The nutritional status of micro-nutrients was very low in both schools according to analysis of nutritional indexes such as NARs and INQs. Students from both schools should improve intakes of micro-nutrients related to child growth such as calcium, Vitamin B6, zinc and folate. According to the analysis of dietary diversity, there was difference in dietary patterns by schools presumably due to their locations.
Conclusions
This suggests that current meals could not provide adequate nutrients for the subjects and urgent nutrition interventions for school food services are needed to improve their nutritional well-being. New foods supplements based on local cuisine are also needed to ensure dietary diversity and sustainable development plans.
Published online Apr 30, 2020.
https://doi.org/10.5720/kjcn.2020.25.2.91
Evaluation of Nutritional Status among Primary School Children in Uganda: Comparison of Urban and Rural Areas
Abstract
Objectives
The aim of this study was to investigate dietary intakes and nutritional status among Uganda primary school children from two selected schools in urban and rural areas.
Methods
Data were collected from 350 pupils (6–14 years) in Mpigi district, Uganda. All participants were offered a school lunch meal (usually maize porridge and boiled beans). Dietary survey was conducted in October 2016. Data for dietary intake levels were collected by the 24-hour recall method with trained school staffs. The data were converted into nutrient intakes using the CAN-Pro 5.0 Program and compared with KDRIs to evaluate the nutritional status of the subjects. Diet quality indexes such as nutrient density, nutrient adequacy ratio (NAR), mean adequacy ratio (MAR), and index of nutritional quality (INQ) and a diet diversity index such as diet diversity score (DDS) were calculated to evaluate nutritional status among subjects. Data were analyzed using SPSS statistical programs.
Results
Results show that the intakes of most nutrients were significantly different by schools. The nutritional status of micro-nutrients was very low in both schools according to analysis of nutritional indexes such as NARs and INQs. Students from both schools should improve intakes of micro-nutrients related to child growth such as calcium, Vitamin B6, zinc and folate. According to the analysis of dietary diversity, there was difference in dietary patterns by schools presumably due to their locations.
Conclusions
This suggests that current meals could not provide adequate nutrients for the subjects and urgent nutrition interventions for school food services are needed to improve their nutritional well-being. New foods supplements based on local cuisine are also needed to ensure dietary diversity and sustainable development plans.
Fig. 1
Index of Nutritional Quality by schools
ANCOVA adjusted for age, sex, BMI and energy intakes (*P < 0.05, **P < 0.01, ***P < 0.001)
Fig. 2
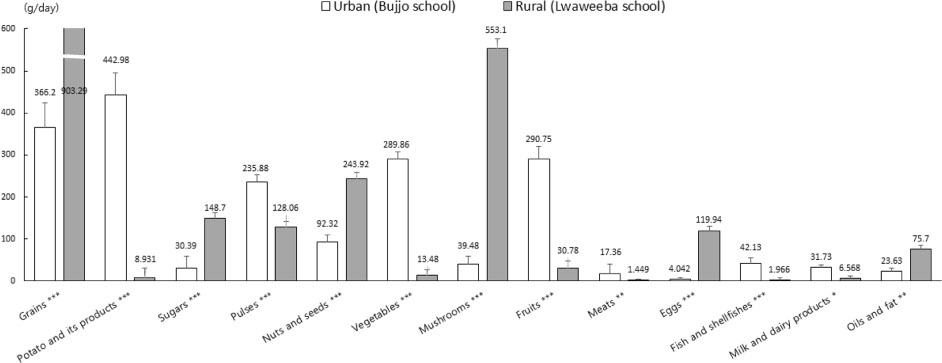
Total Food intake (Mean ± SE): 2,075.12 ± 58.08 g for Bujjo school and 2,274.34 ± 44.50 g for Lwaweeba school
Food intakes from each food group by schools
ANCOVA adjusted for age, sex, BMI and energy intakes (*P < 0.05, **P < 0.01, ***P < 0.001)
Table 1
Frequency distributions of socio-demographic variables among the subjects
Table 2
Clinical measurements of the subjects by schools
Table 3
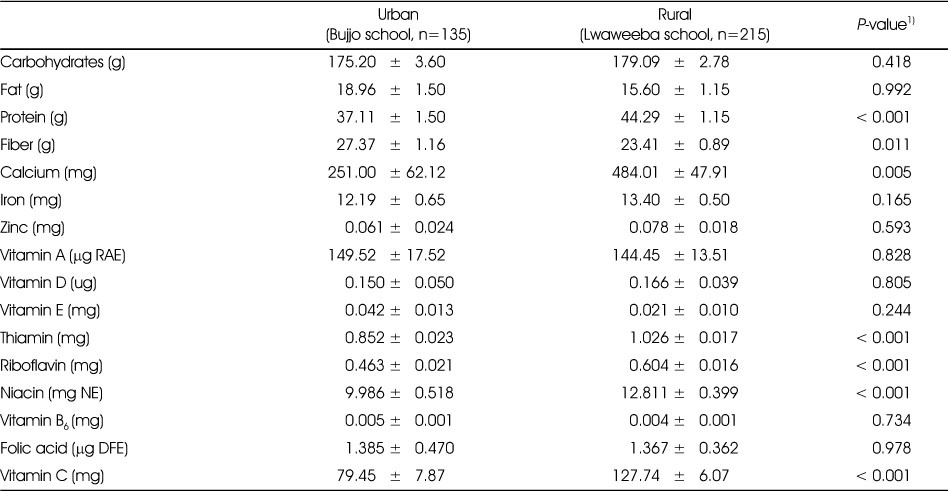
Daily intakes of energy and nutrients by schools
Table 4
Nutrient adequacy ratio (NAR) and mean adequacy ratio (MAR) of the subjects by schools
Table 5
Nutrition density per 1,000 kcal of the subjects by schools
Table 6
Dietary diversity score (DDS) of the subjects by schools
Acknowledgement
This research was supported by the Soonchunhyang University Research Fund.
References
-
The World Bank In Uganda. Uganda's economy has grown at a slower pace, reducing its impact on poverty. In the five years to 2016, average annual growth was 4.5%, compared to 7% in years before [Internet]. The World Bank; 2019 [Updated 2020 Mar 5]. [cited 2020 Mar 27].Available form: https://www.worldbank.org/en/country/uganda/overview.
-
-
Bughin J, Chiopnga M, Desvaux G, Ermias T, Jacobson P, Kassiri O, et al. Lions on the Move II: Realizing the Potential of Africa's Economies [Internet]. Mc Kinsey Global Institute; 2016 [cited 2020 Feb 28].Available from http://www.mckinsey.com/global-
themes/middle- east- and- africa/lions- on- the- move- realizing- the- potential- of- africas- economies.
-
-
Ahunna EO. In: Poverty status report 2014: Structural change and poverty reduction in Uganda. United Nations Development Programme; 2014 Nov.Report No. 229.
-
-
Museveni YK. In: Uganda Nutrition Action Plan 2011–2016: Scaling up multi-sectoral efforts to establish a strong nutrition foundation for Uganda's development. Kampala, Uganda: Government of Uganda; 2011.
-
-
USAID. Uganda: Nutrition profile [Internet]. United States Agency for International Development; 2014 [Updated 2019 Sep 11]. [cited 2020 Feb 28].Available from: https://www.usaid.gov/global-
health/health- areas/nutrition/countries/uganda- nutrition- profile.
-
-
World Bank. SABER school feeding country report: Uganda 2014. World Bank Group; 2014 Jan.Report No. 100075.
-
-
Kibenge AD. School-based feeding and child nutrition/performance; Proceedings of the First Eastern and Southern Africa School Milk Conference; 2005 Sep 29; Kampala.
-
-
The Ministry of Finance, Planning and Economic Development, Uganda. Parent-led school feeding: A tested approach to improve learning in schools [Internet]. The Ministry of Finance, Planning and Economic Development, Uganda; 2019 [cited 2019 May 7].Available from: http://www.finance.go.ug/publication/policy-
briefing- papers- 2019.
-
-
Rachel Q. In: The cost of HUNGER in UGANDA: Implications on national development and prosperity. World Food Programme, United Nations Economic Commission for Africa. African Union Commission; 2012 Mar.Report No. 263404.
-
-
Official Development Assistance Korea. Country partnership strategy [Internet]. Official Development Assistance Korea; 2017 [cited 2017 Jan 4].Available from: http://odakorea.go.kr/ODAPage_
2012/T02/cps/africa/Uganda.jsp.
-
-
Ministry of Health and Welfare (KR). The Korean Nutrition Society. Dietary reference intakes for Koreans 2015. Sejong: Ministry of Health and Welfare; 2016.
-
-
Lee MS, Kim JH, Lee BS, Lee YN, Son SM, Lee JW. In: Nutritional assessment. 4th ed. Paju: Kyomunsa; 2016. pp. 100-129.
-
-
Gibson RS. In: Principles of nutritional assessment. 2nd ed. New York: Oxford University Press; 2005. pp. 137-154.
-
-
Chebet M, Goon DT, Nsibambi C, Otala J. Prevalence of overweight and obesity among primary school children in Kampala central, Uganda. Afr J Phys Health Educ Recreat Danc 2014;20(4):1365–1378.
-
-
Uganda Bureau of Statistics(UBOS) and ICF. 2018. Uganda Demographic and Health Survey 2016. Kampala, Uganda and Rockville, Maryland, USA: Uganda Bureau of Statistics(UBOS); 2018.
-
-
Tidemann-Andersen I, Acham H, Maage A, Malde MK. Iron and zinc content of selected foods in the diet of schoolchildren in Kumi district, east of Uganda: a cross-sectional study. Nutr J 2011;10(1):81
-
-
World Bank. Uganda poverty assessment 2016: Fact sheet [Internet]. World Bank; 2016 [cited 2016 Sep 20].Available form: https://www.worldbank.org/en/country/uganda/brief/uganda-
poverty- assessment- 2016- fact- sheet.
-
-
World Health Organization. Diet, nutrition and the prevention of chronic diseases. World Health Organization; 2002 Feb.Report No. 916.
-
-
Lim HJ. A study on the calcium and sodium intakes and urinary calcium excretion of preschool children in Busan. Korean J Nutr 2001;34(7):786–796.
-
-
Food and Nutrition Technical Assistance. The analysis of the nutrition situation in Uganda. Washington, DC, USA: Food and Nutrition Technical Assistance II Project (FANTA-2); 2010. pp. 16-25.
-
-
Spinneker A, Sola R, Lemmen V, Castillo MJ, Pietrzik K, González-Gross M. Vitamin B6 status, deficiency and its consequences-an overview. Nutr Hosp 2007;22(1):7–24.
-
-
Ecker O, Weinberger K, Qaim M. Patterns and determinants of dietary micronutrient deficiencies in rural areas of East Africa. Afr J Agric Resour Econ 2010;4(1):175–194.
-
-
Kyeon YK, Jang YA, Kim JW. Application of a practical nutrition education program, KHIDIKIDS, for the improvement of dietary attitudes and habits of elementary students. Korean J Nutr 2006;39(8):808–816.
-

 KSCN
KSCN


 Cite
Cite


