
Articles
- Page Path
- HOME > Korean J Community Nutr > Volume 23(4); 2018 > Article
-
Research Article
- Development of 9(th) Revision Korean Food Composition Table and Its Major Changes
-
Su-Hui Park, Se-Na Kim, Sang Hoon Lee, Jeong-Sook Choe, Youngmin Choi

-
Korean Journal of Community Nutrition 2018;23(4):352-365.
DOI: https://doi.org/10.5720/kjcn.2018.23.4.352
Published online: August 31, 2018
Department Agrofood Resources, National Institute of Agricultural Sciences, Rural Development Administration, Wanju, Korea.
- Corresponding author: Youngmin Choi. Department Agrofood Resources, National Institute of Agricultural Sciences, Rural Development Administration, Wanju 55365, Korea. Tel: (063) 238-3561, Fax: (063) 238-3842, ychoi2@korea.kr
• Received: July 20, 2018 • Revised: August 31, 2018 • Accepted: September 4, 2018
Copyright © 2018 The Korean Society of Community Nutrition
This is an Open-Access article distributed under the terms of the Creative Commons Attribution Non-Commercial License (http://creativecommons.org/licenses/by-nc/3.0/) which permits unrestricted non-commercial use, distribution, and reproduction in any medium, provided the original work is properly cited.
- 5,779 Views
- 66 Download
- 31 Crossref
Abstract
-
Objectives
- The Korean Food Composition Table (KFCT) was first published in 1970, and has since been updated every five years by the Rural Development Administration (RDA). This study was conducted to introduce the development strategies, features, and challenges of the 9th revision of the KFCT.
-
Methods
- Due to the increasing demands of nutrient database users and generators, the RDA started a new research project in 2013 to improve the quantity and quality of data for the 9th revision of the KFCT. Over 1,000 food items frequently consumed in Korea were selected as key foods using the results of the Korean National Health and Nutrition Examination Survey. About 200 raw materials and processed food items were collected and analyzed every year. Target nutrients that were analyzed by collaborative labs, such as, sugars, selenium, iodine, and biotin, were increased from 22 to 43. Analytical sample handling procedures and data quality evaluation systems were also established in collaboration with 10 contracted labs. Data were evaluated for data quality according to the FAO/INFOODS, CODEX, and AOAC guidelines.
-
Results
- The 9th revision contains data on 3,000 food items and up to 43 and 140 food nutrients for the printed table and the excel database file, respectively. Overall, 1,485 data items were newly added, 973 of which were provided by the RDA and 512 were cited from foreign nutrient databases. The remaining 1,515 food items were maintained as in the 8th revision.
-
Conclusions
- The KFCT provides the basic infrastructure for food and nutrition policy, research, and dietary practice in South Korea. The use of the KFCT has increased exponentially in the past few years in both public and private sectors; accordingly, increased efforts should be paid to the preparation, improvement, and maintenance of KFCT.
Acknowledgments
Acknowledgments
- 1. Kim SY, Kang MS, Kim SN, Kim JB, Cho YS, Park HJ, et al. Food composition tables and national information network for food nutrition in Korea. Food Sci Ind 2011; 44(1): 2-20.
- 2. Lim SH, Kim JB, Cho YS, Choi YM, Park HJ, Kim SN. National standard food composition tables provide the infrastructure for food and nutrition research according to policy and industry. Korean J Food Nutr 2013; 26(4): 886-894.Article
- 3. FAO/INFOODS. FAO/INFOODS Guidelines for checking food composition data prior to the publication of a user table/database. version 1.0. Rome: FAO; 2012. p. 1-40.
- 4. United States Department of Agriculture. USDA national nutrient database for standard reference 28 [internet]. United States Department of Agriculture; 2015; cited 2016 Feb 3]. Available from: https://ndb.nal.usda.gov/ndb/.
- 5. Danish Food Informatics. SciName FinderTM [internet]. Danish Food Informatics; 2013; cited 2016 Feb 3]. Available from: http://www.sciname.info/.
- 6. Korea National Arboretum. Korea biodiversity information system [internet]. Korea National Arboretum; 2016; cited 2016 Feb 3]. Available from: http://www.nature.go.kr.
- 7. Horwitz W. AOAC guidelines for single laboratory validation of chemical methods for dietary supplements and botanicals. Gaithersburg, MD, USA: AOAC International; 2002. p. 18-19. p. 21-22. p. 24-25.
- 8. Rural Resources Development Institute. Food Composition Table. 7th revision. Suwon: Rural Resources Development Institute; 2006. p. 1-453.
- 9. National Academy of Agricultural Sciences. Food Composition Table. 8th revision. Suwon: National Academy of Agricultural Sciences; 2011. p. 1-636.
- 10. Ministry of Education, Culture, Sports, Science and Technology. Standard tables of food composition in Japan -2015- (Seventh Revised Edition), Introduction [internet]. Ministry of Education, Culture, Sports, Science and Technology; 2015; cited 2016 Feb 3]. Available from: http://www.MEXT.go.jp/.
- 11. National Academy of Agricultural Sciences. Tables of Food Functional Composition. 1st edition. Suwon: National Academy of Agricultural Sciences; 2009. p. 1-450.
- 12. National Academy of Agricultural Sciences. 2010 Tables of Food Functional Composition: mineral, fatty acid. Suwon: National Academy of Agricultural Sciences; 2010. p. 1-179.
- 13. National Academy of Agricultural Sciences. 2011 Tables of Food Functional Composition: amino acid. Suwon: National Academy of Agricultural Sciences; 2011. p. 1-387.
- 14. National Academy of Agricultural Sciences. 2012 Tables of Food Functional Composition: fat-soluble vitamin composition table. Suwon: National Academy of Agricultural Sciences; 2012. p. 1-249.
- 15. National Academy of Agricultural Sciences. 2012 Tables of Food Functional Composition: cholesterol edition. Suwon: National Academy of Agricultural Sciences; 2012. p. 1-180.
- 16. Moon JH, Kim HS, Kwon DY, Yoo JY, Seo SY, Lee JM, et al. Measuring the public value of standard food composition table. Rural Development Administration; 2017 02. Report No. 1395048720.
- 17. Kim S, Sung JY, Foo M, Jin YS, Kim PJ. Uncovering the nutritional landscape of food. PLoS ONE 2015; 10(3): e0118697.ArticlePubMedPMC
- 18. Lee HS, Chang MJ, Kim HY, Shim JS, Lee JS, Kim KN. Survey on utilization and demand for national food composition database. J Nutr Health 2018; 51(2): 186-198.ArticleLink
REFERENCES
Fig. 1
In 2013, Rural Development Administration started new research project to improve data quality and quantity for 9th revision KFCT. Over 1,000 food items have been sampled and analyzed by NFAS.
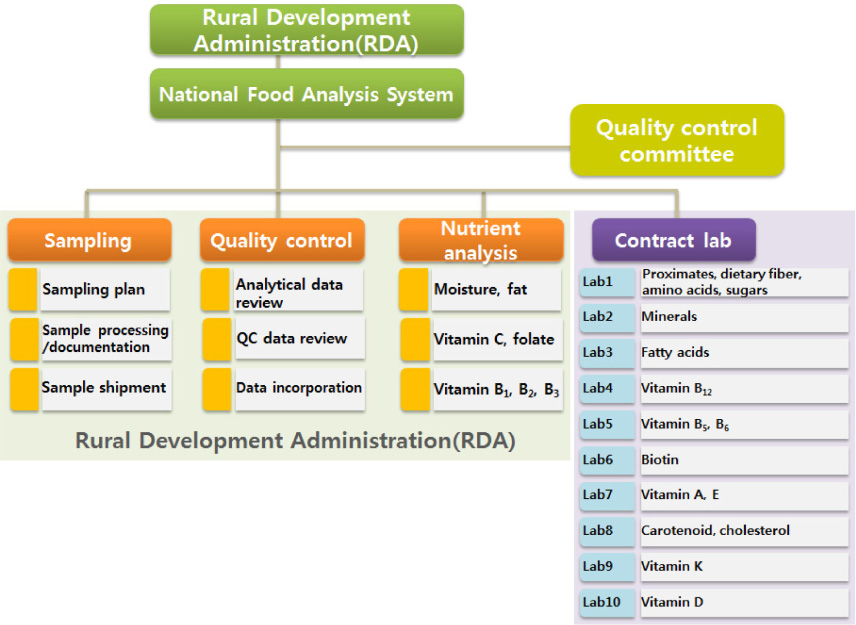
National Food Analysis System


Table 3

The source of nutrient data in 9th revision Korean Food Composition Table
1) Rural Development Administration, Food Composition Table
2) National Institute of Fisheries Science, Chemical Composition of Marine Products in Korea
3) Ministry of Food and Drug Safety, Food Composition Database
4) National Institute of Health, Journal of National Institute of Health
5) Research articles published in Korea
6) Ministry of Education, Culture, Sports, Science and Technology (MEXT), Standard Tables of Food Composition in Japan (Seventh Revised Edition)
7) United States Department of Agriculture. Food Composition Database, Standard Reference 28
Table 4
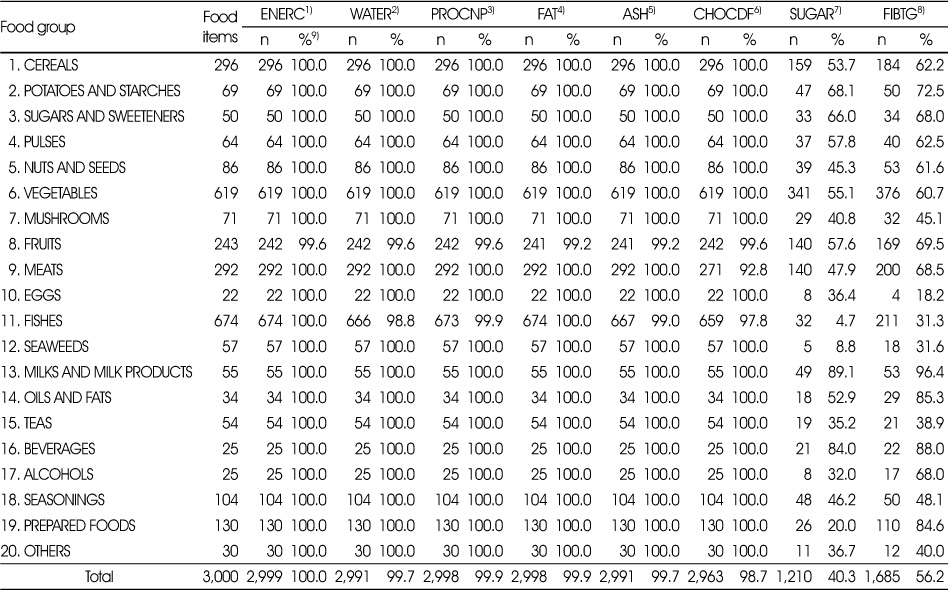
Number of foods in 9th revision Korean Food Composition Table by listing for each nutrients (proximates)
Table 5

Number of foods in 9th revision Korean Food Composition Table by listing for each nutrients (amino acids)
Table 6

Number of foods in 9th revision Korean Food Composition Table by listing for each nutrients(fatty acids and cholesterol)
1) FAFRE: Total fatty acid, 2) FAESS: Total essential fatty acid, 3) FASAT: Saturated Fatty acid, 4) FAMS: Monounsaturated fatty acid, 5) FAPU: Polyunsaturated fatty acid, 6) CHOLE: Cholesterol, 7) The comprehensiveness(%) of the database by listing for each nutrient the number of food items that contain data
Table 7
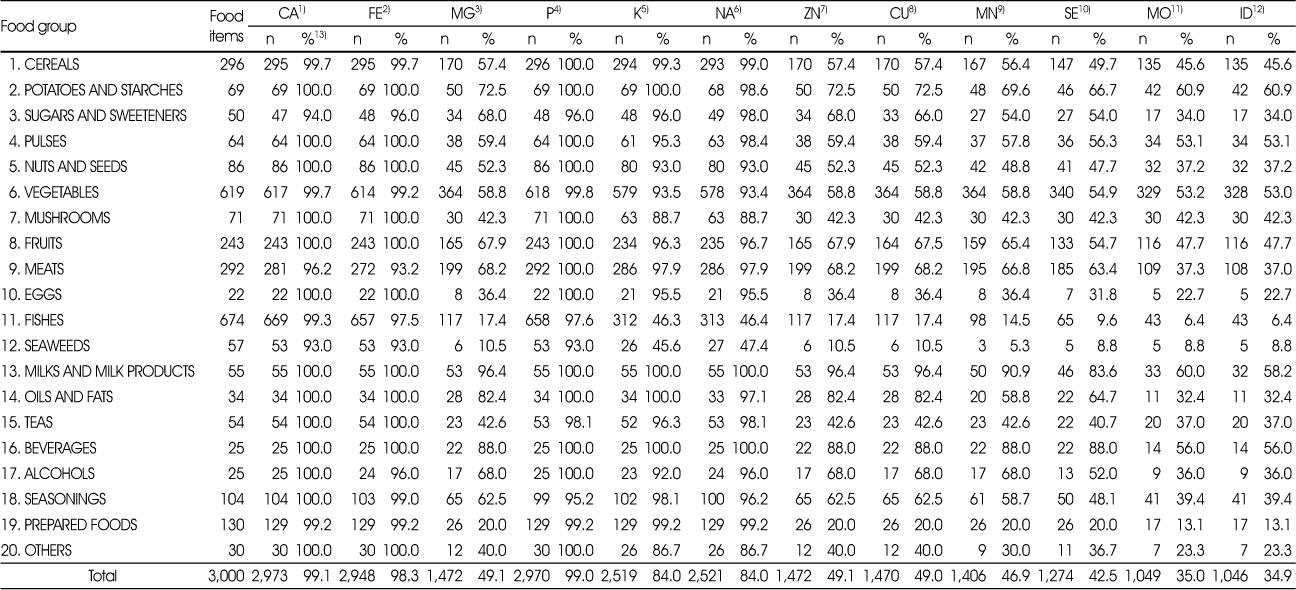
Number of foods in 9th revision Korean Food Composition Table by listing for each nutrients (minerals)
1) CA: Calcium, 2) FE: Iron, 3) MG: Magnesium, 4) P: Phosphorus, 5) K: Potassium, 6) NA: Sodium, 7) ZN: Zinc, 8) CU: Copper, 9) MN: Manganese, 10) SE: Selenium, 11) MO: Molybdenum, 12) ID: Iodine, 13) The comprehensiveness (%) of the database by listing for each nutrient the number of food items that contain data
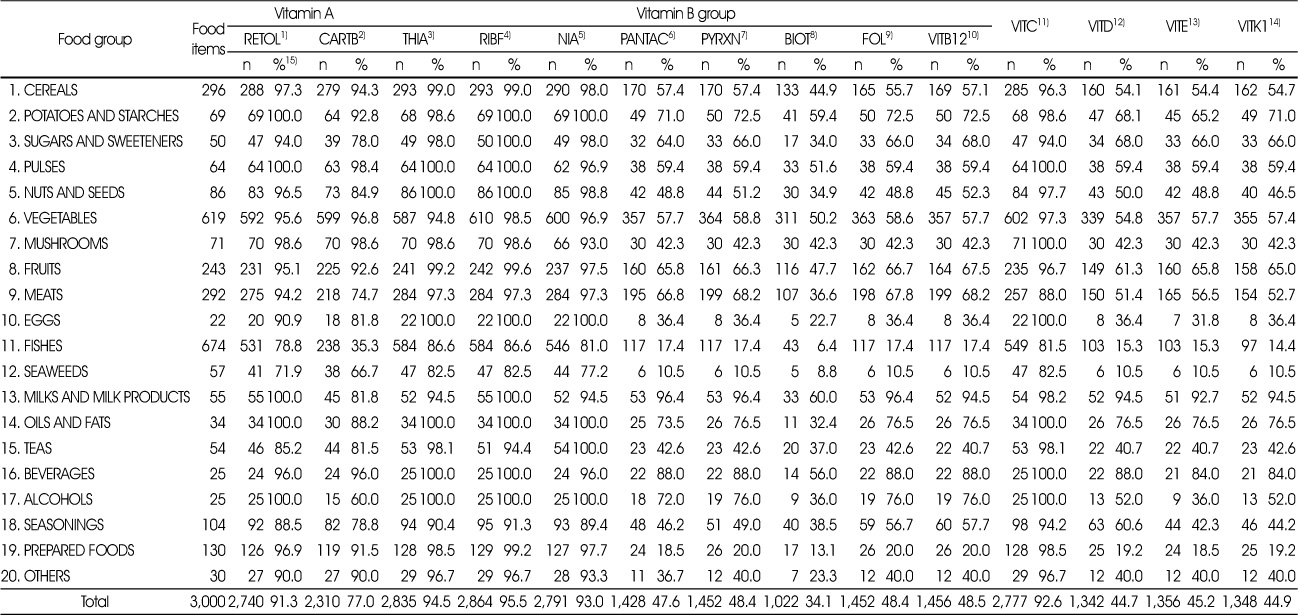
Table 8
Number of foods in 9th revision Korean Food Composition Table by listing for each nutrients (vitamins)
1) RETOL: Retinol, 2) CARTB: β-Carotene, 3) THIA: Thiamin, 4) RIBF: Total Riboflavin, 5) NIA: Total Niacin, 6) PANTAC: Pantothenic acid, 7) PYRXN: Pyridoxine, 8) BIOT: Biotin, 9) FOL: Dietary Folate Equivalent, 10) VITB12: Cyanocobalamin, 11) VITC: Total Ascorbic Acid, 12) VITD: Vitamin D (Ergocalciferol + Cholecalciferol), 13) VITE: Total Vitamin E, 14) VITK1: Phylloquinone, 15) The comprehensiveness (%) of the database by listing for each nutrient the number of food items that contain data
Table 9

Summary of number of food items in 8th and 9th revision Korean Food Composition Table
1) Tables of Food Functional Composition – Mineral/Fatty acid, 2010
2) Tables of Food Functional Composition – 1st edition, 2009
3) Tables of Food Functional Composition – Fat-soluble vitamin, 2012
4) Tables of Food Functional Composition – Amino acid, 2011
5) Tables of Food Functional Composition – Cholesterol, 2012
Figure & Data
REFERENCES
Citations
Citations to this article as recorded by 
- Combined associations of protein intake and resistance exercise with handgrip strength in postmenopausal women
Jin Kyung Baek, Hae Rim Kim, Eun Jin Lee, Yun Soo Chung, Seok Kyo Seo
Maturitas.2026; 205: 108808. CrossRef - Irregular meal frequency and depressive symptoms: Moderating roles of dietary diversity and breakfast skipping
Hyejin Tae, Jeong-Ho Chae
Journal of Affective Disorders.2026; 404: 121417. CrossRef - Analysis of Six Sugars in Domestically Distributed Seeds and Mushrooms
Sumin Song, Eun-Bin Seo, Su-Hyun Kim, Chang Wan Lim, Sung-Hwan Lee, Kyoung-Min Seo, Young-Hee Park, Youngmin Choi, Eunji Park, Byung-Man Kwak
Journal of the Korean Society of Food Science and Nutrition.2026; 55(1): 20. CrossRef - Evaluation of folate retention in ready-to-serve and ready-to-cook foods
Jong-Kug Lee, Ye-Eun Park, Seo-Eun Park, Hui Jin Lee, Jiyeon Chun
Food Science and Preservation.2026; 33(1): 151. CrossRef - Association Between Dietary Animal Protein and Depression in a General Population
Sunghee Lee
Nutrients.2026; 18(7): 1104. CrossRef - Impact of energy intake on the association between protein intake and the prevalence of frailty in older Korean adults: The Korea National Health and Nutrition Examination Survey, 2014–2018
Seokju Kang, Youri Jin, Yongsoon Park
The Journal of nutrition, health and aging.2025; 29(4): 100518. CrossRef - Dietary β-Carotene, Vitamin A, and Retinol Intake and Prevalence of Colorectal Adenoma: A Cross-Sectional Study and Meta-Analysis
Joowon Chung, Jioh Kang, Sang Hoon Kim, Min Kyu Jung, Dong Hyun Kim, Hyun Joo Song, Ki Bae Kim, Seung-Joo Nam, Hoon Jai Chun, Jung Eun Lee, Yun Jeong Lim
Gut and Liver.2025; 19(6): 845. CrossRef - Relationship between urinary sodium excretion and bone mineral density in pediatrics: population-based study from KNHANES V 2010–2011
In Kyung Lee, Yoo Mi Kim, Han Hyuk Lim
Journal of Pediatric Endocrinology and Metabolism.2024; 37(6): 553. CrossRef - Development and Validation of a Questionnaire to Measure Adherence to a Mediterranean-Type Diet in Youth
Yu-Jin Kwon, Young-Hwan Park, Yae-Ji Lee, Li-Rang Lim, Ji-Won Lee
Nutrients.2024; 16(16): 2754. CrossRef - Nutrition survey methods and food composition database update of the Korean Genome and Epidemiology Study
Seon-Joo Park, Jieun Lyu, Kyoungho Lee, Hae-Jeung Lee, Hyun-Young Park
Epidemiology and Health.2024; 46: e2024042. CrossRef - Fruits and the Risk of Type 2 Diabetes: The Korean Genome and Epidemiology Study Cohort
Hojun Yu, Cheol Min Lee, Seung-Won Oh
Korean Journal of Family Medicine.2024; 45(1): 44. CrossRef - Ultra-Processed Food Intakes Are Associated with Depression in the General Population: The Korea National Health and Nutrition Examination Survey
Sunghee Lee, Myungjin Choi
Nutrients.2023; 15(9): 2169. CrossRef - Analyzing the Sugar Components of Domestic Agricultural Products for Establishing the National Standard Food Composition Data-Base
Eun-Ha Jang, Ki-Yeon Lee, Kyung-Dae Kim, Jae-Hee Lee, Ji-Sun Park, Jae-Gil Lim, Jin-Kwan Ham, Jin-Ju Park
Journal of the East Asian Society of Dietary Life.2023; 33(1): 71. CrossRef - Comparative analysis of the relationship between four hepatic steatosis indices and muscle mass
Taesic Lee, Tae-Ha Chung
Scientific Reports.2023;[Epub] CrossRef - Association Between Parental BMI and Offspring’s Blood Pressure by Mediation Analysis: A Study Using Data From the Korean National Health and Nutrition Examination Survey
Hyowon Choi, Hunju Lee, Yeon-Soon Ahn
Journal of Preventive Medicine and Public Health.2023; 56(6): 533. CrossRef - Intake of omega-3 polyunsaturated fatty acids and fish associated with prevalence of low lean mass and muscle mass among older women: Analysis of Korea National Health and Nutrition Examination Survey, 2008-2011
Yeji Kim, Yongsoon Park
Frontiers in Nutrition.2023;[Epub] CrossRef - Association of Protein Intake with Handgrip Strength and Its Relation to Strength Exercise in Korean Adults Aged over 60 Years in the KNHANES (2014-18)
Eun Young Choi
Nutrients.2023; 15(4): 1014. CrossRef - Analysis of Vitamin K Content in Commonly Consumed Foods in Korea
Seungjun Lee, Youngmin Choi, Minjoo Gu, Seungjoo Baik, Jeehye Sung, Heon Sang Jeong, Junsoo Lee
Journal of the Korean Society of Food Science and Nutrition.2022; 51(12): 1272. CrossRef - The association between fruit and vegetable consumption and metabolic syndrome in Korean adults: does multivitamin use matter?
Jihae Kim, Li-Juan Tan, Hyein Jung, Yumi Roh, Kyungjoon Lim, Sangah Shin
Epidemiology and Health.2022; 44: e2022039. CrossRef - Association of Dietary Total Antioxidant Capacity with Cancer Recurrence and Mortality among Breast Cancer Survivors: A Prospective Cohort Study
Doyeon Han, Minsung Chung, Yongsoon Park
Nutrition and Cancer.2022; 74(9): 3253. CrossRef - Daily Walking Accompanied with Intermittent Resistance Exercise Prevents Osteosarcopenia: A Large Cohort Study
Sangyeob Lee, Ji-Seok Kim, Ki-Soo Park, Kyung-Wan Baek, Jun-Il Yoo
Journal of Bone Metabolism.2022; 29(4): 255. CrossRef - Comparison of multivariate linear regression and a machine learning algorithm developed for prediction of precision warfarin dosing in a Korean population
Van Lam Nguyen, Hoang Dat Nguyen, Yong‐Soon Cho, Ho‐Sook Kim, Il‐Yong Han, Dae‐Kyeong Kim, Sangzin Ahn, Jae‐Gook Shin
Journal of Thrombosis and Haemostasis.2021; 19(7): 1676. CrossRef - Comparative Analysis of Universal Protein Extraction Methodologies for Screening of Lipase Activity from Agricultural Products
Jisu Ha, Jun-Young Park, Yoonseok Choi, Pahn-Shick Chang, Kyung-Min Park
Catalysts.2021; 11(7): 816. CrossRef - Association of a Tobacco-specific Nitrosamine Carcinogen with Urinary Cotinine, Urinary Sodium Excretion, and Total Energy Intake in Adolescents and Children
Jong Weon Choi, Tatsuyoshi Fujii, Noriyoshi Fujii
Current Medical Science.2021; 41(2): 270. CrossRef - Development of an Unified Food Composition Database for the European Project “Stance4Health”
Daniel Hinojosa-Nogueira, Sergio Pérez-Burillo, Beatriz Navajas-Porras, Bartolomé Ortiz-Viso, Silvia Pastoriza de la Cueva, Fabio Lauria, Alexandra Fatouros, Kostas N. Priftis, Verónica González-Vigil, José Ángel Rufián-Henares
Nutrients.2021; 13(12): 4206. CrossRef - Total, bioavailable and free 25-hydroxyvitamin D levels as functional indicators for bone parameters in healthy children
You Joung Heo, Yun Jeong Lee, Kyunghoon Lee, Jae Hyun Kim, Choong Ho Shin, Young Ah Lee, Junghan Song, Dengshun Miao
PLOS ONE.2021; 16(10): e0258585. CrossRef - Association of Dietary Total Antioxidant Capacity with Bone Mass and Osteoporosis Risk in Korean Women: Analysis of the Korea National Health and Nutrition Examination Survey 2008–2011
Donghyun Kim, Anna Han, Yongsoon Park
Nutrients.2021; 13(4): 1149. CrossRef - Association between Iron Intake and Diabetic Peripheral Neuropathy in Type 2 Diabetes: Significance of Iron Intake and the Ratio between Iron Intake and Polyunsaturated Fatty Acids Intake
Kyuho Kim, YoonJu Song, Tae Jung Oh, Sung Hee Choi, Hak Chul Jang
Nutrients.2020; 12(11): 3365. CrossRef - Association between Dietary Patterns and Handgrip Strength: Analysis of the Korean National Health and Nutrition Examination Survey Data Between 2014 and 2017
Yunkoo Kang, Jieun Kim, Do-Yeon Kim, Seung Kim, Sowon Park, Hyunjung Lim, Hong Koh
Nutrients.2020; 12(10): 3048. CrossRef - Comparison of hemodialysis and peritoneal dialysis patients’ dietary behaviors
Seon-Mi Kim, Byung Chin Kang, Hyun-Jung Kim, Min-Sook Kyung, Hyung Jung Oh, Jung-Hyun Kim, Oran Kwon, Dong-Ryeol Ryu
BMC Nephrology.2020;[Epub] CrossRef - Development of a Smartphone Application for Dietary Self-Monitoring
Jeong Sun Ahn, Dong Woo Kim, Jiae Kim, Haemin Park, Jung Eun Lee
Frontiers in Nutrition.2019;[Epub] CrossRef
 Cite
CiteDevelopment of 9(th) Revision Korean Food Composition Table and Its Major Changes

Fig. 1
National Food Analysis System
In 2013, Rural Development Administration started new research project to improve data quality and quantity for 9th revision KFCT. Over 1,000 food items have been sampled and analyzed by NFAS.
Fig. 1
Development of 9(th) Revision Korean Food Composition Table and Its Major Changes
Number of food items in each food group
Number of foods updated in each food group
The source of nutrient data in 9th revision Korean Food Composition Table
1) Rural Development Administration, Food Composition Table
2) National Institute of Fisheries Science, Chemical Composition of Marine Products in Korea
3) Ministry of Food and Drug Safety, Food Composition Database
4) National Institute of Health, Journal of National Institute of Health
5) Research articles published in Korea
6) Ministry of Education, Culture, Sports, Science and Technology (MEXT), Standard Tables of Food Composition in Japan (Seventh Revised Edition)
7) United States Department of Agriculture. Food Composition Database, Standard Reference 28
Number of foods in 9th revision Korean Food Composition Table by listing for each nutrients (proximates)
1) ENERC: Energy, 2) WATER: Water, 3) PROCNP: Protein, 4) FAT: Fat, 5) ASH: Ash, 6) CHOCDF: Carbohydrate, 7) SUGAR: Total sugars, 8) FIBTG: Total Dietary Fiber, 9) The comprehensiveness (%) of the database by listing for each nutrient the number of food items that contain data
Number of foods in 9th revision Korean Food Composition Table by listing for each nutrients (amino acids)
1) AAT19: Sum of 19 amino acids, 2) AAE10A: Total essential amino acid, 3) AANE: Total non-essential amino acid, 4) The comprehensiveness(%) of the database by listing for each nutrient the number of food items that contain data
Number of foods in 9th revision Korean Food Composition Table by listing for each nutrients(fatty acids and cholesterol)
1) FAFRE: Total fatty acid, 2) FAESS: Total essential fatty acid, 3) FASAT: Saturated Fatty acid, 4) FAMS: Monounsaturated fatty acid, 5) FAPU: Polyunsaturated fatty acid, 6) CHOLE: Cholesterol, 7) The comprehensiveness(%) of the database by listing for each nutrient the number of food items that contain data
Number of foods in 9th revision Korean Food Composition Table by listing for each nutrients (minerals)
1) CA: Calcium, 2) FE: Iron, 3) MG: Magnesium, 4) P: Phosphorus, 5) K: Potassium, 6) NA: Sodium, 7) ZN: Zinc, 8) CU: Copper, 9) MN: Manganese, 10) SE: Selenium, 11) MO: Molybdenum, 12) ID: Iodine, 13) The comprehensiveness (%) of the database by listing for each nutrient the number of food items that contain data
Number of foods in 9th revision Korean Food Composition Table by listing for each nutrients (vitamins)
1) RETOL: Retinol, 2) CARTB: β-Carotene, 3) THIA: Thiamin, 4) RIBF: Total Riboflavin, 5) NIA: Total Niacin, 6) PANTAC: Pantothenic acid, 7) PYRXN: Pyridoxine, 8) BIOT: Biotin, 9) FOL: Dietary Folate Equivalent, 10) VITB12: Cyanocobalamin, 11) VITC: Total Ascorbic Acid, 12) VITD: Vitamin D (Ergocalciferol + Cholecalciferol), 13) VITE: Total Vitamin E, 14) VITK1: Phylloquinone, 15) The comprehensiveness (%) of the database by listing for each nutrient the number of food items that contain data
Summary of number of food items in 8th and 9th revision Korean Food Composition Table
1) Tables of Food Functional Composition – Mineral/Fatty acid, 2010
2) Tables of Food Functional Composition – 1st edition, 2009
3) Tables of Food Functional Composition – Fat-soluble vitamin, 2012
4) Tables of Food Functional Composition – Amino acid, 2011
5) Tables of Food Functional Composition – Cholesterol, 2012
Table 1
Number of food items in each food group
Table 2
Number of foods updated in each food group
Table 3
The source of nutrient data in 9th revision Korean Food Composition Table
1) Rural Development Administration, Food Composition Table 2) National Institute of Fisheries Science, Chemical Composition of Marine Products in Korea 3) Ministry of Food and Drug Safety, Food Composition Database 4) National Institute of Health, Journal of National Institute of Health 5) Research articles published in Korea 6) Ministry of Education, Culture, Sports, Science and Technology (MEXT), Standard Tables of Food Composition in Japan (Seventh Revised Edition) 7) United States Department of Agriculture. Food Composition Database, Standard Reference 28
Table 4
Number of foods in 9th revision Korean Food Composition Table by listing for each nutrients (proximates)
1) ENERC: Energy, 2) WATER: Water, 3) PROCNP: Protein, 4) FAT: Fat, 5) ASH: Ash, 6) CHOCDF: Carbohydrate, 7) SUGAR: Total sugars, 8) FIBTG: Total Dietary Fiber, 9) The comprehensiveness (%) of the database by listing for each nutrient the number of food items that contain data
Table 5
Number of foods in 9th revision Korean Food Composition Table by listing for each nutrients (amino acids)
1) AAT19: Sum of 19 amino acids, 2) AAE10A: Total essential amino acid, 3) AANE: Total non-essential amino acid, 4) The comprehensiveness(%) of the database by listing for each nutrient the number of food items that contain data
Table 6
Number of foods in 9th revision Korean Food Composition Table by listing for each nutrients(fatty acids and cholesterol)
1) FAFRE: Total fatty acid, 2) FAESS: Total essential fatty acid, 3) FASAT: Saturated Fatty acid, 4) FAMS: Monounsaturated fatty acid, 5) FAPU: Polyunsaturated fatty acid, 6) CHOLE: Cholesterol, 7) The comprehensiveness(%) of the database by listing for each nutrient the number of food items that contain data
Table 7
Number of foods in 9th revision Korean Food Composition Table by listing for each nutrients (minerals)
1) CA: Calcium, 2) FE: Iron, 3) MG: Magnesium, 4) P: Phosphorus, 5) K: Potassium, 6) NA: Sodium, 7) ZN: Zinc, 8) CU: Copper, 9) MN: Manganese, 10) SE: Selenium, 11) MO: Molybdenum, 12) ID: Iodine, 13) The comprehensiveness (%) of the database by listing for each nutrient the number of food items that contain data
Table 8
Number of foods in 9th revision Korean Food Composition Table by listing for each nutrients (vitamins)
1) RETOL: Retinol, 2) CARTB: β-Carotene, 3) THIA: Thiamin, 4) RIBF: Total Riboflavin, 5) NIA: Total Niacin, 6) PANTAC: Pantothenic acid, 7) PYRXN: Pyridoxine, 8) BIOT: Biotin, 9) FOL: Dietary Folate Equivalent, 10) VITB12: Cyanocobalamin, 11) VITC: Total Ascorbic Acid, 12) VITD: Vitamin D (Ergocalciferol + Cholecalciferol), 13) VITE: Total Vitamin E, 14) VITK1: Phylloquinone, 15) The comprehensiveness (%) of the database by listing for each nutrient the number of food items that contain data
Table 9
Summary of number of food items in 8th and 9th revision Korean Food Composition Table
1) Tables of Food Functional Composition – Mineral/Fatty acid, 2010 2) Tables of Food Functional Composition – 1st edition, 2009 3) Tables of Food Functional Composition – Fat-soluble vitamin, 2012 4) Tables of Food Functional Composition – Amino acid, 2011 5) Tables of Food Functional Composition – Cholesterol, 2012


