Articles
- Page Path
- HOME > Korean J Community Nutr > Volume 16(2); 2011 > Article
-
Original Article
- Evaluation of a Nutrition Education Program for 3rd Grade Elementary School Students
- Duk Ha Kwon, Sung Nim Han, Hye-Kyeong Kim
-
Korean Journal of Community Nutrition 2011;16(2):183-194.
DOI: https://doi.org/10.5720/kjcn.2011.16.2.183
Published online: April 30, 2011
Nutrition Education, Graduate School of Education, The Catholic University of Korea, Bucheon, Korea.
1Department of Food and Nutrition, Seoul National University, Seoul, Korea.
2Department of Food Science & Nutrition, The Catholic University of Korea, Bucheon, Korea.
- Corresponding author: Hye-Kyeong Kim, Department of Food Science & Nutrition, The Catholic University of Korea, 43-1 Yeokgok 2-dong, Wonmi-gu, Bucheon, Gyeonggi-do 420-743, Korea. Tel: (02) 2164-4314, Fax: (02)2164-4314, hkyeong@catholic.ac.kr
Copyright © 2011 The Korean Society of Community Nutrition
- 1,292 Views
- 6 Download
- 7 Crossref
Abstract
- This study examined the effects of a nutrition education program on nutrition-related knowledge, eating habits, and dietary behavior. Subjects were 3rd grade elementary school students in Anyang, Gyeonggi-do. A 5-week nutrition education program was implemented to 28 children and another 26 children were included in the study as a control group. A self-administered questionnaire was used to assess the effects of nutrition education program. Mean nutrition related knowledge score was improved after education (p < 0.001). There was a significant improvement in knowledge of nutrient source (p < 0.05), role of protein (p < 0.05), food tower (p < 0.001), getting information from nutrition labeling (p < 0.05), and proper way of snacking (p < 0.001). Eating habits and self-efficacy also tended to improve by nutrition education, especially eating habit of snack and self-efficacy on balanced diet reached significant improvement (p < 0.05). Food consumption frequency was not changed significantly, only consumption of sea weeds which is considered as a reluctant food among children was increased after education (p < 0.05). In addition, the number of leftover food items and total amount of leftover at school lunch reduced significantly after education when compared with the same 10-day menu prior to education (p < 0.01). This result suggests that unbalanced dietary behavior has been changed with the nutrition education program. In conclusion, the nutrition education program was found to be effective in improving nutrition-related knowledge, eating habits, and dietary behavior.
- 1. Ahn Y, Ko SY, Kim KW. Evaluation of a nutrition education program for elementary school children. Korean J Community Nutr. 2009; 14(3): 266-276.
- 2. Bundy D. School health and nutrition: policy and programs. Food Nutr Bull. 2005; 26(2): S186-S192.ArticlePubMedPDF
- 3. Heo ES. Evaluation of problem and nutritional education status for children's nutrition, and the development of internet assisted nutritional education program for children's healthy dietary habit. 2002; Changwon National University; Dissertation.
- 4. Hwang SN. Nutrition education for elementary school students step by step process. 2008; Seoul Metropolitan Office of Education.
- 5. Hyon SM, Kim JW. Improvement of dietary attitudes of elementary students by nutrition labeling education. Korean J Community Nutr. 2007; 12(2): 168-177.
- 6. Jeong NY, Kim KW. Nutrition knowledge and eating behaviors of elementary school children in Seoul. Korean J Community Nutr. 2009; 14(1): 55-66.
- 7. Kim KA, Lee YK. The effect of nutrition education using animations on the nutrition knowledge, eating habits and food preferences of elementary school students. Korean J Community Nutr. 2010; 15(1): 50-60.
- 8. Kim SB, Choi HJ. Effects of nutrition education using food exchange system: changes in elementary students' nutrition knowledge, dietary attitude and nutrients intake. Korean J Community Nutr. 2008; 13(6): 922-933.
- 9. Koo JO, Lee JW, Choi YS, Kim JH, Lee JH. Nutrition throughout the life cycle. 2006; Seoul: Hyoil Publishing Co..
- 10. Korea Centers for Disease Control and Prevention. The Korean Pediatrics Society. Korean national growth charts. 2007.
- 11. Kwon YK, Jang YA, Kim KW. Application of a practical nutrition education program (KHIDIKIDS) for the improvement of dietary attitudes and habits of elementary students. Korean J Nutr. 2006; 39(8): 808-816.
- 12. Lee JW, Lee HS, Chang NS, Kim JM. The relationship between nutrition knowledge scores and dietary behavior, dietary intakes and anthropometric parameters among primary school children participating in a nutrition education program. Korean J Nutr. 2009; 42(4): 338-349.Article
- 13. Lee JY, Lee SY. A comparative study on nutrition knowledge, eating behavior and nutrient intake for students at elementary schools with and without nutrition education program. J East Asian Soc Diet Life. 2004; 14(6): 561-570.
- 14. Lee OK, Chang SO, Park MJ. Comparison of nutrition knowledge, dietary attitude and dietary habit in elementary school children with and without nutrition education. J Korean Soc Food Sci Nutr. 2008; 37(11): 1427-1434.Article
- 15. Lee SY. A comparative study on nutrition knowledge, eating behavior and a nutrient intake for students in elementary schools with and without nutrition education problem. 2003; Dongguk University; MS thesis.
- 16. Lee YJ, Kim GM, Chang KJ. The analysis of effect on nutrition education of elementary school children, Incheon. J Korean Diet Assoc. 2000; 6(2): 86-96.
- 17. Lee YM, Lee MJ, Kim SY. Effects of nutrition education through discretional activities in elementary school - Focused on improving nutrition knowledge and dietary habits in 4th-, 5th- and 6th-grade students. J Korean Diet Assoc. 2005; 11(3): 331-340.
- 18. Ministry for Health, Welfare and Family Affairs. Korea Centers for Disease Control and Prevention. 2008 National health statistics - The 4th Korea national health and nutrition examination survey. 2009; Korea: Korea Centers for Disease Control and Prevention.
- 19. Oh YJ, Lee YM, Kim JH, Ahn HS, Kim JW, Park HR, Seo JS, Kim KW, Kwon OR, Park HK, Lee EJ, Sung HN. Interview survey of elementary school student's nutrition education and practice. Korean J Community Nutr. 2008; 13(4): 499-509.
- 20. Park A, Chang KJ. A study on elementary school dietitian's status and recognition of nutrition education in Incheon. Korean J Community Nutr. 2004; 9(6): 716-724.
- 21. Park HO, Kim EK, Chi KA, Kwak TK. Comparison of the nutrition knowledge, food habits and life styles of obese children and normal children in elementary school in Kyeong-gi province. Korean J Community Nutr. 2000; 5(4): 586-597.
- 22. Park YH, Kim HH, Shin KH, Shin EK, Bae IS, Lee YK. A survey on practice of nutrition education and perception for implementing nutrition education by nutrition teacher in elementary schools. Korean J Nutr. 2006; 39(4): 403-416.
- 23. Pearson N, Biddle SJ, Gorelt T. Family correlates of fruit and vegetable consumption in children and adolescents: a systemic review. Public Health Nutr. 2009; 12(2): 267-283.ArticlePubMed
- 24. Raulio S, Roos E, Prattala R. School and workplace meals promote healthy food habits. Public Health Nutr. 2010; 13(6A): 987-992.ArticlePubMed
- 25. Seo JS, Kim KW, Yoon EY, Bae HJ. Development of contents for nutrition education for nutritionally vulnerable groups. Report of the research grant supported by the Korea Food and Drug Administration. 2006.
- 26. Shin EK, Lee HS, Lee YK. Effect of nutrition education program in obese children and their parents(I) - Focus on anthropometric values and serum biochemical index. Korean J Community Nutr. 2004; 9(5): 566-577.
- 27. Shin EK, Shin KH, Kim HH, Park YH, Bae IS, Lee YK. A survey on the needs of educators, learners and parents for implementing nutrition education by nutrition teachers in elementary schools. J Korean Diet Assoc. 2006; 12(1): 89-101.
- 28. Singhal N, Misra A, Shah P, Gulati S. Effect of controlled school-based multi-component model of nutrition and lifestyle intervention on behavior modification, anthropometry and metabolic risk profile of urban Asian Indian adolescents in North India. Eur J Clin Nutr. 2010; 64(4): 364-373.ArticlePubMedPDF
- 29. Suh EN, Kim CK. Analysis of nutrition education for elementary schools based upon elementary school teachers within inner Seoul. Korean J Nutr. 1998; 31(4): 787-798.
- 30. Trahms CM. Nutrition in childhood. Nutrition throughout the life cycle. 2000; Boston: McGraw-Hill.
- 31. Woo TJ, Her Es, Lee KH. Effect-evaluation of nutrition education textbook and teaching manual in elementary school. J Korean Diet Assoc. 2006; 12(3): 299-306.
- 32. Yon MY, Hyun TS. Evaluation of nutrition education program for obese children. Hum Ecol Res. 2007; 11(2): 143-151.
- 33. Yoon HS, Yang HL, Her ES. Effect of nutrition education program on nutrition knowledge, dietary diversity of elementary school children. Korean J Community Nutr. 2000; 5(3): 513-521.
- 34. Yu OK, Park SH, Cha YS. Eating habits, eating behaviors and nutrition knowledge of higher grade elementary school students in Jeonju area. Korean J Food Cult. 2007; 22(6): 665-672.
- 35. Yun HH. Effects of nutrition education on eating behavior, nutrition knowledge and nutrient intake by school mealservice. An empirical study on elementary school children in Chonbuk area. 2004; Chonbuk University; MS thesis.
REFERENCES
Figure & Data
REFERENCES
Citations

- Effect of Nutrition Education on Reduced Sugar Intake in Elementary School Students
Young-Mi Seo, Ok-Jin Park, Min-June Lee
Journal of the East Asian Society of Dietary Life.2021; 31(1): 14. CrossRef - Status of Dietary Life Related Knowledge, Self-Efficacy, Food Preference and Dietary Behavior of Preschoolers in Kyunggi Area
A Reum Lee, Ye Lee Yu, Hye Jin Kim, Kyung A Kim, Kyung Won Kim
Korean Journal of Community Nutrition.2016; 21(3): 274. CrossRef - Effectiveness Evaluation of Food Allergy Education Program for Elementary School Children
Harim Kim, Kyunghee Song, Youngmi Lee, Youngshin Han, Bomi Kang, Soun Ju Kweoun
Journal of the East Asian Society of Dietary Life.2015; 25(6): 1058. CrossRef - Effects of Dietary Education on Elementary Children in After-school Program in Seoul
Kyung-Hee Kim
Journal of the Korean Society of Food Culture.2014; 29(2): 222. CrossRef - Perception on Nutrition Labeling of the Processed Food among Elementary School Students and Parents in Daegu Area
Jung Mi Kim, Mi Hee Lee, Nan Hee Lee
The Korean Journal of Food And Nutrition.2014; 27(6): 1107. CrossRef - Relationships between Eating Behavior, Dietary Self-Efficacy, and Nutrition Knowledge of Elementary School Students by Food Service Type in Gangwon Province
Hyang-Rye Won, Gi-Beum Shin
Journal of the Korean Society of Food Science and Nutrition.2012; 41(5): 638. CrossRef - Effects of Short-Term Food Additive Nutrition Education Including Hands-on Activities on Food Label Use and Processed-Food Consumption Behaviors: among 5th Grade Elementary School Students
Ji-Hye Kim, Seungmin Lee
Korean Journal of Community Nutrition.2011; 16(5): 539. CrossRef
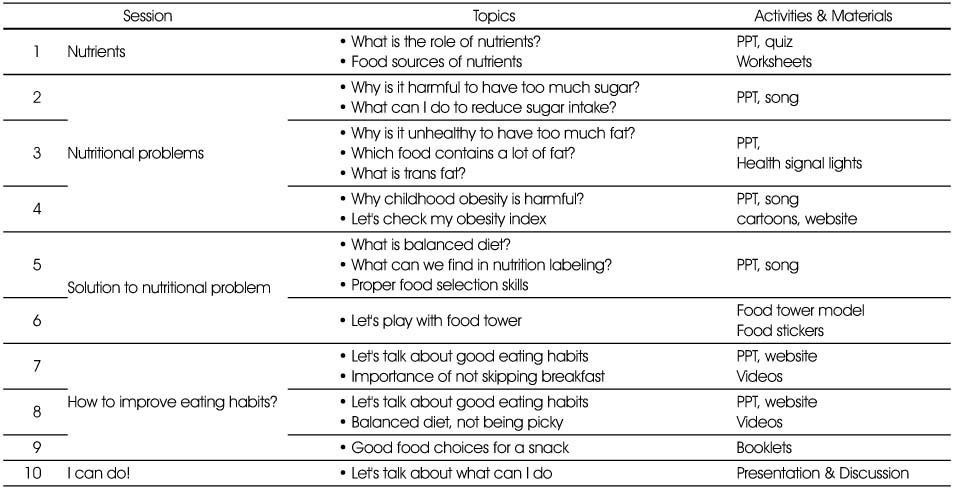
Summary of nutrition education program
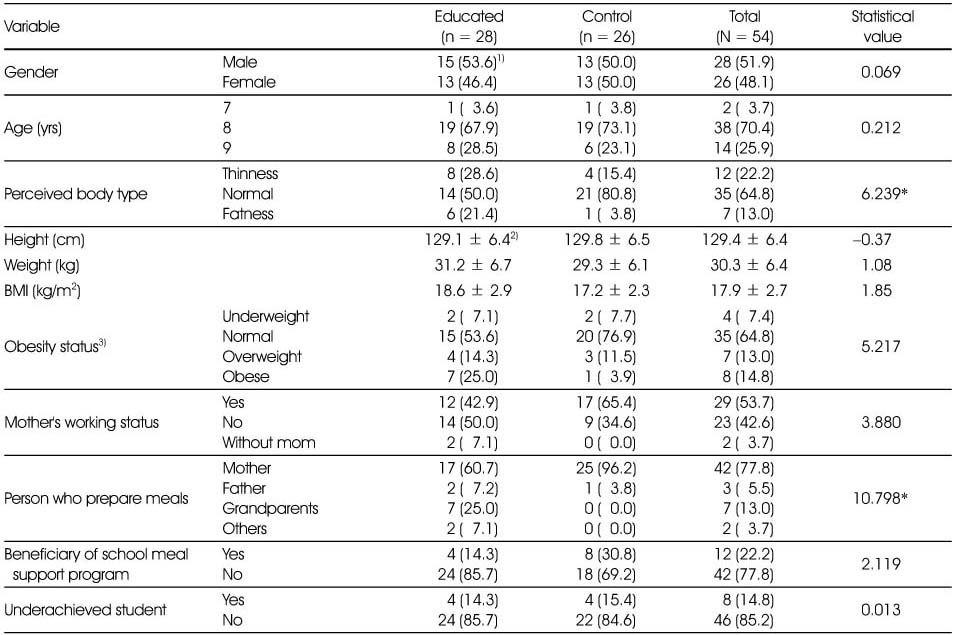
General characteristics of the subjects
*: p < 0.05
1) N (%)
2) Mean ± SD
3) Obesity status by BMI percentiles for age: Underweight: < 5th percentiles, normal: 5th~85th percentiles, overweight: 85th~95th percentiles, obese:= 95th percentile
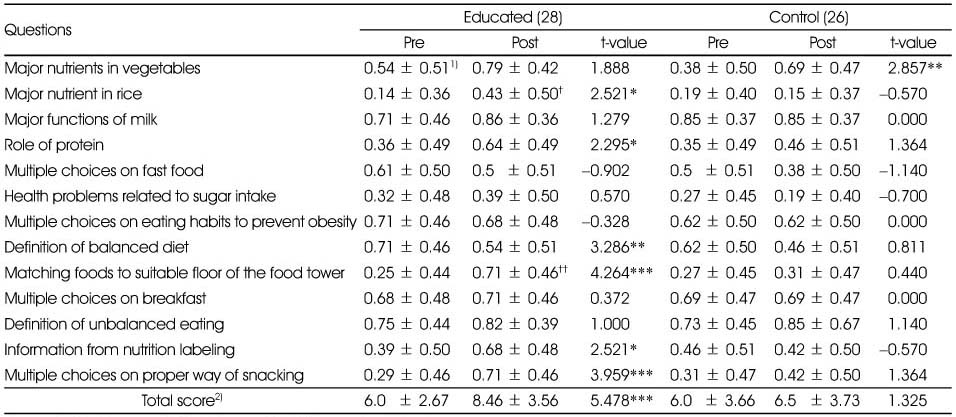
Comparison of nutrition-related knowledge before and after receiving nutrition education
*: p < 0.05, **: p < 0.01, ***: p < 0.001 by paired t-test
†: p < 0.05, ††: p < 0.01 by t-test (group difference)
1) Mean ± SD
2) Possible total score ranged from 0 - 13 points, each item was scored (1=correct or 0=incorrect)
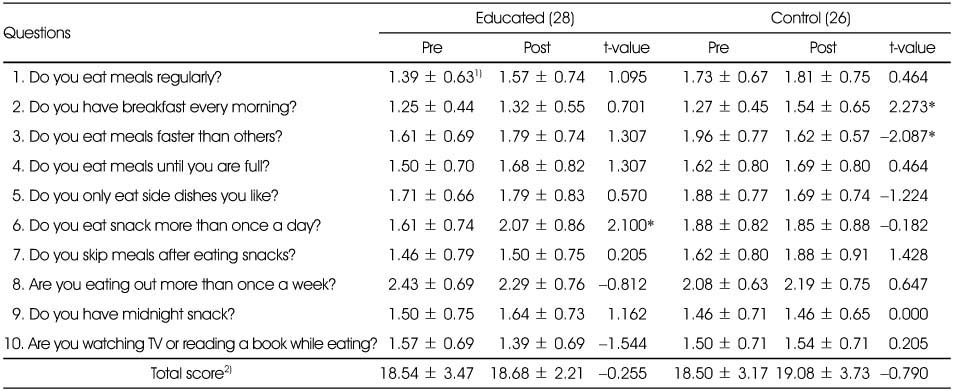
Comparison of eating habits before and after receiving nutrition education
*: p < 0.05, **: p < 0.01, ***: p < 0.001 by paired t-test
†: p < 0.05, ††: p < 0.01 by t-test (group difference)
1) Mean ± SD
2) Possible total score ranged from 10 - 30 points. Each item was scored (3 = yes, 2 = often, 1 = no) and item 3, 4 ,5, 7, 8, 9, 10 were scored reversely
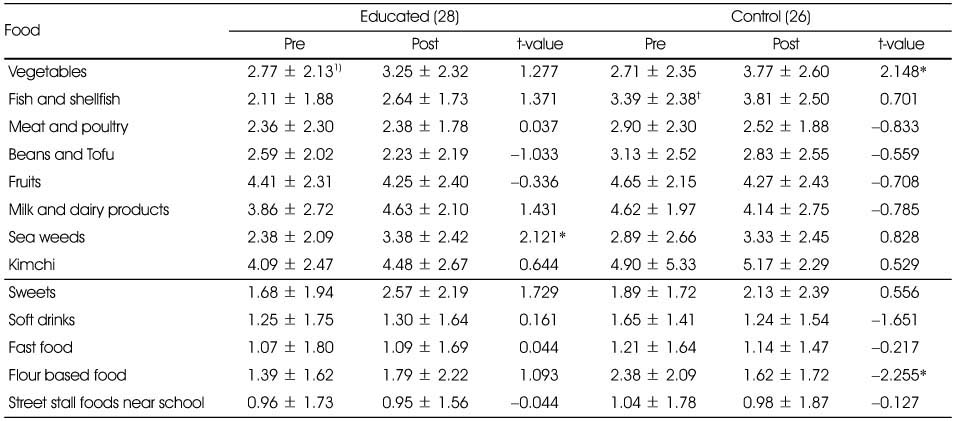
Food consumption frequency before and after receiving nutrition education
*: p < 0.05 by paired t-test
†: p < 0.05 by t-test (group difference)
1) Mean ± SD, Each food item was scored by 5 scales (7 = every day, 5.5 = 5~6 times a week, 3.5 = 3~4 times a week, 1.5 = 1~2 times a week, 0 = rarely)
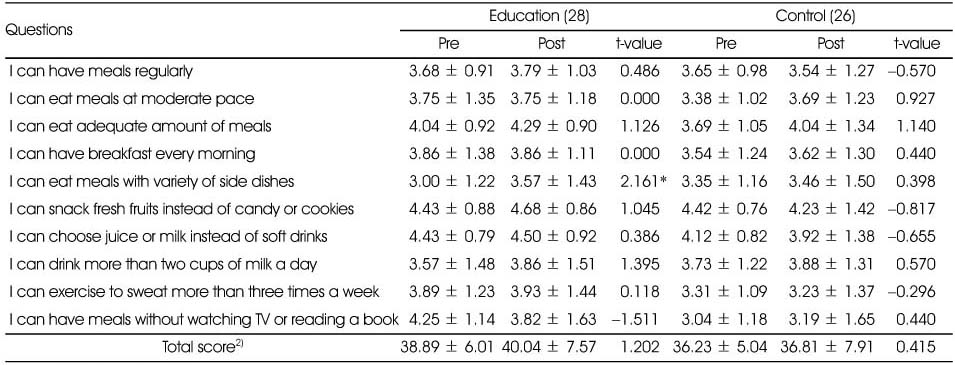
Comparison of self-efficacy before and after nutrition education
*: p < 0.05 by paired t-test
1) Mean ± SD
2) Possible total score ranged from 10 - 50 points. Each item was scored by 5-point scales ranging from 'strongly agree' (5) to 'strongly disagree' (1)
Comparison of school lunch leftover between control and educated groups
*: p < 0.05, **: p < 0.01, ***: p < 0.001
1) Mean ± SD
*: p < 0.05 1) N (%) 2) Mean ± SD 3) Obesity status by BMI percentiles for age: Underweight: < 5th percentiles, normal: 5th~85th percentiles, overweight: 85th~95th percentiles, obese:= 95th percentile
*: p < 0.05, **: p < 0.01, ***: p < 0.001 by paired t-test †: p < 0.05, ††: p < 0.01 by t-test (group difference) 1) Mean ± SD 2) Possible total score ranged from 0 - 13 points, each item was scored (1=correct or 0=incorrect)
*: p < 0.05, **: p < 0.01, ***: p < 0.001 by paired t-test †: p < 0.05, ††: p < 0.01 by t-test (group difference) 1) Mean ± SD 2) Possible total score ranged from 10 - 30 points. Each item was scored (3 = yes, 2 = often, 1 = no) and item 3, 4 ,5, 7, 8, 9, 10 were scored reversely
*: p < 0.05 by paired t-test †: p < 0.05 by t-test (group difference) 1) Mean ± SD, Each food item was scored by 5 scales (7 = every day, 5.5 = 5~6 times a week, 3.5 = 3~4 times a week, 1.5 = 1~2 times a week, 0 = rarely)
*: p < 0.05 by paired t-test 1) Mean ± SD 2) Possible total score ranged from 10 - 50 points. Each item was scored by 5-point scales ranging from 'strongly agree' (5) to 'strongly disagree' (1)
*: p < 0.05, **: p < 0.01, ***: p < 0.001 1) Mean ± SD

 KSCN
KSCN

 Cite
Cite


