
Articles
- Page Path
- HOME > Korean J Community Nutr > Volume 17(5); 2012 > Article
-
Original Article
- The Relationship among Insulin Resistance, Blood Profiles and Nutrient Intake in Overweight or Obese Children and Adolescents
- Jae-Hee Kim, Eun-Kyung Kim
-
Korean Journal of Community Nutrition 2012;17(5):530-542.
DOI: https://doi.org/10.5720/kjcn.2012.17.5.530
Published online: October 31, 2012
Department of Food and Nutrition, Gangneung-Wonju National University, Gangneung, Korea.
- Corresponding author: Eun-Kyung Kim, Department of Food and Nutrition, Gangneung-Wonju National University, 7, Jukheon-gil, Gangneung, Gangwon-do 210-702, Korea. Tel: (033) 640-2336, Fax: (033) 640-2330, ekkim@gwnu.ac.kr
• Received: July 18, 2012 • Revised: September 26, 2012 • Accepted: October 5, 2012
Copyright © 2012 The Korean Society of Community Nutrition
- 1,688 Views
- 1 Download
- 5 Crossref
Abstract
- The purposes of this study were to investigate blood profiles and nutrient intakes of groups that are different in obese levels, and to find the credible predictor of insulin resistance. The subjects were classified as normal weight (%IBW ≤ 110), obese without MS and obese with MS according to IDF definition of the risk group in metabolic syndrome (MS). Subjects of this study were included 137 (59 boys, 78 girls) free living children and adolescents (mean age 12.6 ± 3.4 years) in Gangneung area, South Korea. %IBW of normal weight (94.9%), obese without MS (123.8%) and obese with MS (131.5%) were significantly different among groups. HOMA-IR had positive correlations with TG (r = 0.634), waist circumference (r = 0.553), atherogenic index (r = 0.513), %IBW (r = 0.453) and ALT (r = 0.360), but showed negative correlations with HDL cholesterol (r = -0.417, p < 0.001). HOMA-IR showed positive correlation with polyunsaturated fatty acid intake (p < 0.05). The energy intake of obese with MS was 1762 kcal/day which was not significantly different from those of normal weight and obese without MS. Total fatty acid intakes of two obese groups were significantly higher than that of normal weight. The results of this study suggest that waist circumference and ALT as well as TG, atherogenic index and weight can be credible indices to predict the insulin resistance in children and in adolescents. In addition, nutrition education and adequate diet should be provided to prevent MS in children and in adolescents.
-
This research was supported by Basic Science Research Program through the National Research Foundation of Korea (NRF) funded by the Ministry of Education, Science and Technology (2010-0004472).
NOTES
- 1. Angelico F, Del Ben M, Conti R, Francioso S, Feole K, Fiorello S, Cavallo MG, Zalunardo B, Lirussi F, Alessan Dri C. Insulin resistance, the metabolic syndrome and nonalcoholic fatty liver disease. J Clin Endocrinol Metab. 2005; 90: 1578-1582.ArticlePubMedPDF
- 2. Ardern CI, Katzmarzyk PT, Janssen I, Ross R. Discrimination of health risk by combined body mass index and waist circumference. Obes Res. 2003; 11: 135-142.ArticlePubMed
- 3. Berg JE, Hostmark AT. Cardiovascular risk determination: discrepancy between total cholesterol evaluation and two compound laboratory indices in Norway. J Epidemiol Community Health. 1994; 48: 338-343.ArticlePubMedPMC
- 4. Brambilla P, Bedogni G, Moreno LA, Goran MI, Gutin B, Fox KR. Cross validation of anthropometry against magnetic resonance imaging for the assessment of visceral and subcutaneous adipose tissue in children. Int J Obes (Lond). 2006; 30: 23-30.ArticlePubMedPDF
- 5. Bugianesi E, Gastaldelli A, Vanni E, Gambino R, Cassader M, Baldi S, Ponti V, Pagano G, Ferrannini E, Rizzetto M. Insulin resistance in non-diabetic patients with non-alcoholic fatty liver disease: Sites and mechanisms. Diabetologia. 2005; 48: 634-642.ArticlePubMedPDF
- 6. Chen CM, Zhao W, Yang Z, Zhai Y, Wu Y, Kong L. The role of dietary factors in chronic disease control in China. Obes Rev. 2008; 9: Suppl 1. 100-103.Article
- 7. Chu MA, Choe BH. Obesity and metabolic syndrome among children and adolescents in Korea. J Korean Med Assoc. 2010; 53(2): 142-152.Article
- 8. Chun IY. Comparison of obesity rate, dietary behavior, nutrient intake and blood profile related to metabolic syndrome of adult women in rural area. 2006; Chosun University; Dissertation.
- 9. Chung HK, Kang JH, Shin MJ. Assessment for nutrient intakes in Korean women according to obesity and metabolic syndrome. Korean J Community Nutr. 2010; 15(5): 694-703.
- 10. Cook S, Weitzman M, Auinger P, Nguyen M, Dietz WH. Prevalence of a metabolic syndrome phenotype in adolescents: findings from the third National Health and Nutrition Examination Survey, 1988-1994. Arch Pediatr Adolesc Med. 2003; 157: 821-827.ArticlePubMed
- 11. Devaraj S, Wang-Polagruto J, Polagruto J, Keen CL, Jialal I. Highfat, energy-dense, fast-food-style breakfast results in an increase in oxidative stress in metabolic syndrome. Metabolism. 2008; 57: 867-870.ArticlePubMedPMC
- 12. Flegal KM, Carroll MD, Ogden CL, Curtin L. Prevalence and trends in obesity among US adults, 1999-2008. JAMA. 2010; 303(3): 235-241.ArticlePubMed
- 13. Ford ES, Giles WH. A comparison of the prevalence of the metabolic syndrome using two proposed definitions. Diabetes Care. 2003; 26: 575-581.ArticlePubMedPDF
- 14. Ford ES, Li C. Defining the metabolic syndrome in children and adolescents: will the real definition please stand up? J Pediatr. 2008; 152: 160-164.ArticlePubMed
- 15. Friedewald WT, Levy RI, Fredrickson DS. Estimation of the concentration of low-density lipoprotein cholesterol in plasma, without use of the preparative ultracentrifuge. Clin Chem. 1972; 18: 499-502.ArticlePubMedPDF
- 16. Gibson RS. Evaluation of nutrient intake data. Principles of nutritional assessment. 1990; New York: Oxford University Press; 137-154.
- 17. Guthrie HA, Scheer JC. Validity of a dietary score for assessing nutritive adequacy. J Am Diet Assoc. 1981; 78(3): 240-245.PubMed
- 18. Heymsfield SB, McManus CB, Smith J, Stevens V, Nixon DW. Anthropometric measurement of muscle mass, revised equations for calculating bone-free arm muscle area. Am J Clin Nutr. 1982; 36(4): 680-690.ArticlePubMed
- 19. Hoffmann IS, Cubeddu LX. Salt and the metabolic syndrome. Nutr Metab Cardiovasc Dis. 2009; 19: 123-128.ArticlePubMed
- 20. Jang Y, Kim OY, Ryu HJ, Kim JY, Song SH, Ordovas JM, Lee JH. Visceral fat accumulation determines postprandial lipemic response, lipid peroxidation, DNA damage, and endothelial dysfunction in nonobese Korean men. J Lipid Res. 2003; 44: 2356-2364.ArticlePubMed
- 21. Janssen I, Katzmarzyk PT, Ross R. Waist circumference and not body mass index explains obesity-related health risk. Am J Clin Nutr. 2004; 79: 379-384.ArticlePubMed
- 22. Jung GY, Lee YS, Kim SM. The study of dietary behavior, BMI and nutrient intake status in middle school students of Daegu area. J East Asian Soc Diet Life. 2005; 15: 1-10.
- 23. Kadowaki T, Yamauchi T, Kubota N, Hara K, Ueki K, Tobe K. Adiponectin and adiponectin receptors in insulin resistance, diabetes and the metabolic syndrome. J Clin Invest. 2006; 116: 1784-1792.ArticlePubMedPMC
- 24. Kim KH. Effects of eating habits and control of overeating of obese children on body weight control program. Korean J Food Cult. 2005; 20(4): 476-486.
- 25. Korea Centers for Disease Control and Prevention. The Korean Pediatric Society. The Committee for the Development of Growth Standard for Korean Children and Adolescents. 2007 Korean Children and Adolescents Growth Standard (commentary for the development of 2007 growth chart). Government report online. 2007 11; Seoul: Division of Chronic Disease Surveillance; Available from: http://www.cdc.go.kr/.
- 26. Lee EJ, Kim KH. Changes of obesity index, serum lipid profiles and nutrient intakes in obese children after the weight control program of nutrition education. Korean J Community Nutr. 2010; 15(1): 61-72.
- 27. Lee S, Bacha F, Gungor N, Arslanian SA. Waist circumference is an independent predictor of insulin resistance in black and white youths. J Pediatr. 2006; 148: 188-194.ArticlePubMed
- 28. Livingstone MB, Robson PJ, Wallaoe JM. Issues in dietaryintake assessment of children and adolescents. Br J Nutr. 2004; 92: Suppl 2. S213-S222.ArticlePubMed
- 29. Maffeis C, Corciulo N, Livieri C, Rabbone I, Trifiro G, Falorni A. Waist circumference as a predictor of cardiovascular and metabolic risk factors in obese girls. Eur J Clin Nutr. 2003; 57: 566-572.ArticlePubMedPDF
- 30. Matthews DR, Hosker JP, Rudenski AS, Naylor BA, Treacher DF, Turner RC. Homeostasis model assessment: insulin resistance and beta-cell function from fasting plasma glucose and insulin concentrations in man. Diabetologia. 1985; 28: 412-419.ArticlePubMedPDF
- 31. Miller ER, Erlinger TP, Appel LJ. The effects of macronutrients on blood pressure and lipids an overview of the DASH and OmniHeart trials. Curr Atheroscler Rep. 2006; 8: 460-465.ArticlePubMedPDF
- 32. Ministry of Health and Welfare. National health and nutrition survey: overview. 2011; Seoul, South Korea: Ministry of Health and Welfare.
- 33. Moreno LA, Pineda I, Rodriguez G, Fleta J, Sarria A, Bueno M. Waist circumference for the screening of the metabolic syndrome in children. Acta Paediatr. 2002; 91: 1307-1312.ArticlePubMed
- 34. Morrison JA, Friedman LA, Gray-McGuire C. Metabolic syndrome in childhood predicts adult cardiovascular disease 25 years later: the Princeton Lipid Research Clinic Followup Study. Pediatrics. 2007; 120: 340-345.PubMed
- 35. Park JS, Park ES. Prevalence of metabolic syndrome and nutrient intakes of obese middle school students in Korea. J Korean Living Sci Assoc. 2008; 17(1): 159-170.
- 36. Park YS, Lee DH, Choi JM, Kang YJ, Kim CH. Trend of obesity in school age children in Seoul over the past 23 years. Korean J Pediatr. 2004; 47: 247-257.
- 37. Park YS, Son SM, Lim WJ, Kim SB, Chung YS. Comparison of dietary behaviors related to sodium intake by gender and age. Korean J Community Nutr. 2008; 13: 1-12.
- 38. Popkin BM, Conde W, Hou N, Monteiro C. Is there a lag globally in overweight trends for children compared with adults? Obesity. 2006; 14: 1846-1853.ArticlePubMed
- 39. Reaven GM. Do high carbohydrate diets prevent the development or attenuate the manifestations (or both) of syndrome X? A viewpoint strongly against. Curr Opin Lipidol. 1997; 8: 23-27.ArticlePubMed
- 40. Pi-Sunyer X. The metabolic syndrome: how to approach differing definitions. Med Clin North Am. 2007; 91: 1025-1040.ArticlePubMed
- 41. Riccardi G, Giacco R, Rivellese AA. Dietary fat, insulin sensitivity and the MS. Clin Nutr. 2004; 23: 447-456.PubMed
- 42. Saito I, Mori M, Shibata H, Hirose H, Tsujioka M, Kawabe H. Prevalence of metabolic syndrome in young men in Japan. J Atheroscler Thromb. 2007; 14: 27-30.ArticlePubMed
- 43. Seo JW, Jung JA, Park HS, Ko JS, Kim YJ, Kim JY, Ryoo E, Bae SH, Sim JG, Yang HR, Choe BH, Cho KY. Assessment of modifiable lifestyle factors for obese children and adolescents through questionnaires. Korean J Pediatr. 2008; 51: 576-583.Article
- 44. Seong EJ. Metabolic syndrome of Korean children and adolescents. 2006; Seoul National University; 43-44 Dissertation.
- 45. Shai I, Schwarzfuchs D, Henkin Y, Shahar DR, Witkow S, Greenberg I, Golan R, Fraser D, Bolotin A, Vardi H, Tangi-Rozental O, Zuk-Ramot R, Sarusi B, Brickner D, Schwartz Z, Sheiner E, Marko R, Katorza E, Thiery J, Fiedler GM, Blher M, Stumvoll M, Stampfer MJ. Dietary Intervention Randomized Controlled Trial (DIRECT) Group. Weight loss with a low-carbohydrate, Mediterranean, or low-fat diet. N Engl J Med. 2008; 359(3): 229-241.PubMed
- 46. Srinivasan SR, Bao W, Watt igney WA, Berenson GS. Adolescent overweight is associated with adult overweight and related multiple cardiovascular risk factors: the Bogalusa Heart Study. Metabolism. 1996; 45: 235-240.ArticlePubMed
- 47. Styne DM. Childhood and adolescent obesity. Prevalence and significance. Pediatr Clin North Am. 2001; 48: 823-854.PubMed
- 48. The Korea Health Industry Development Institute. National food and nutrition statitics. 2010.
- 49. The Korean Society of Nutrition. Dietary reference intake for Koreans. 2010.
- 50. Yang SF, Tzang BS, Yang KT, Hsiao YC, Chang YY, Chan CH, Fu SG, Chen YC. Taurine alleviates dyslipidemia and liver damage induced by a high-fat/cholesterol-dietary habit. Food Chemisty. 2010; 120: 156-162.Article
- 51. Yoo HJ, Kim YH. A study on the characteristics of nutrient intake in metabolic syndrome subjects. Korean J Nutr. 2008; 41(6): 510-517.
- 52. Abe Y, Kikuchi T, Nagasaki K, Hiura M, Tanaka Y, Ogawa Y, Uchiyama M. Usefulness of GPT for diagnosis of metabolic syndrome in obese Japanese children. J Atheroscler Thromb. 2009; 16: 902-909.ArticlePubMed
- 53. Warensjo C, Sundstrom J, Lind L, Vessby B. Factor analysis of fatty acids in serum lipids as a measure of dietary fat quality in relation to the metabolic syndrome in men. Am J Clin Nutr. 2006; 84: 442-448.ArticlePubMed
- 54. Webber LS, Srinivasan SR, Wattigney WA, Berenson GS. Tracking of serum lipids and lipoproteins from childhood to adulthood. The Bogalusa Heart Study. Am J Epidemiol. 1991; 133: 884-899.PubMed
- 55. Zhu S, Heshka S, Wang Z, Shen W, Allison DB, Ross R. Combination of BMI and waist circumference for identifying cardiovascular risk factors in whites. Obes Res. 2004; 12: 633-645.ArticlePubMed
REFERENCES
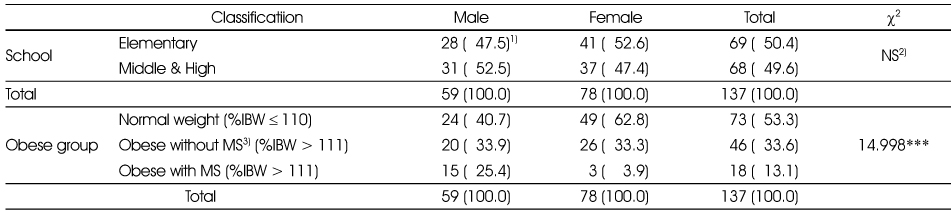
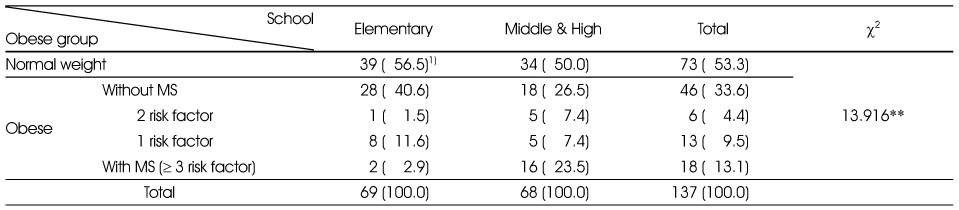
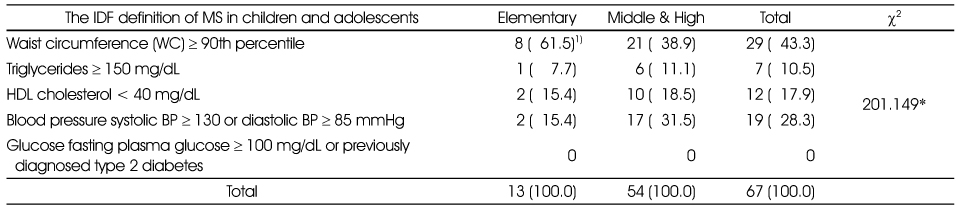
Table 4Anthropometric measurements of subjects by obese groups (N = 137)
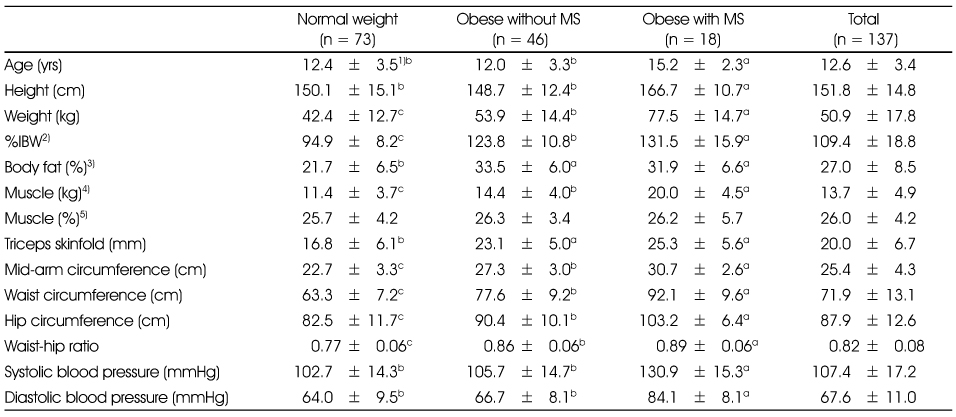
1) Mean ± SD
2) [Body weight (kg) / Standard weight (kg)] × 100
3) Body fat (%) measured by Inbody 720
4) Muscle mass (kg) calculated by Heymsfield's formular
5) Body muscle (%) = [Muscle (kg) / body weight (kg)] * 100
abc means significant difference (p < 0.05) among groups by Duncan's multiple range test
All data are same after controlling for age using ANCOVA among groups
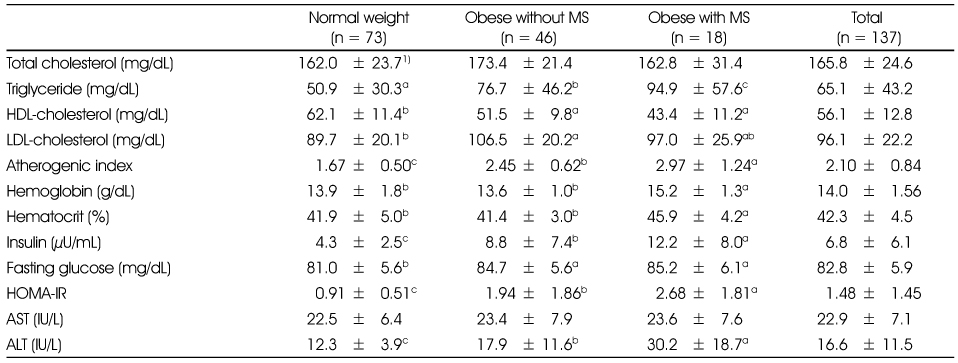
Table 6Pearson's correlation coefficient of HOMA-IR with anthropometric and biochemical variables of blood in subjects
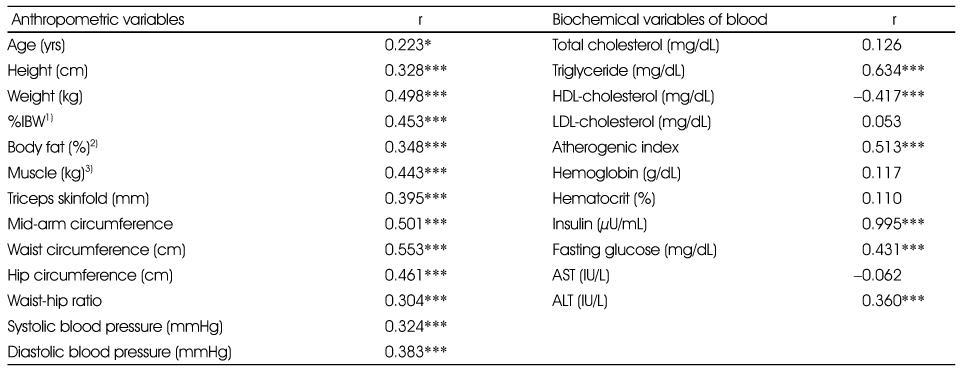
Table 7Comparison of daily nutrient intakes in normal weight, obese without MS and obese with MS groups
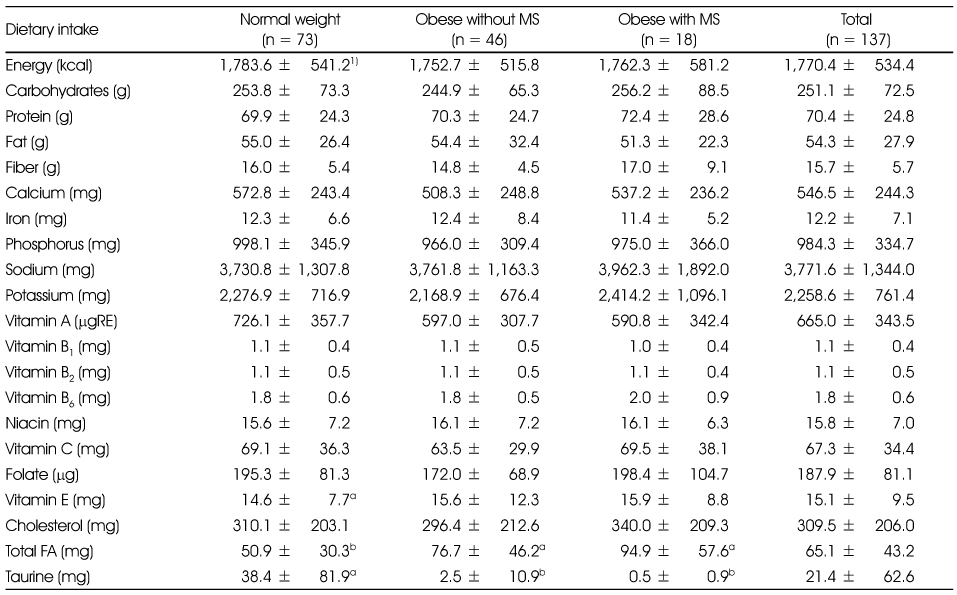
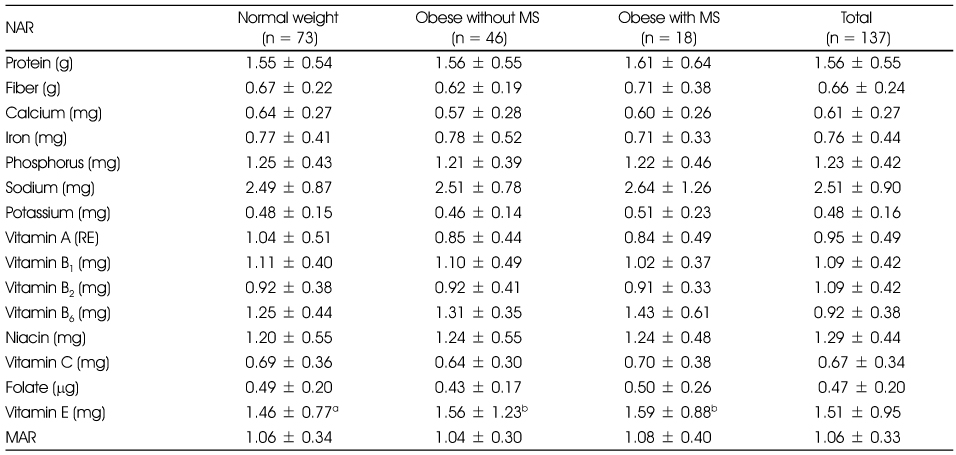
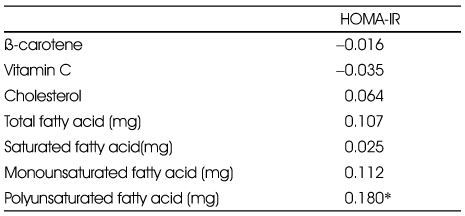
Figure & Data
REFERENCES
Citations
Citations to this article as recorded by 
- Assessment of dietary quality and nutrient intake of obese children in Changwon area
Ji-Sook Park, Ha-Neul Choi, Jae-Young Kim, Sang-Hyuk Ma, Jung-Eun Yim
Journal of Nutrition and Health.2022; 55(6): 630. CrossRef - Biochemical Index, Nutrition Label Use, and Weight Control Behavior in Female Adolescents: Using the 2010 and 2011 Korea National Health and Nutrition Examination Survey
Mi-Ja Choi, Hyun-Ju Jo, Mi-Kyung Kim
Clinical Nutrition Research.2020; 9(1): 32. CrossRef - Factors associated with Obesity among Korean Adolescents based on the Seventh Korea National Health and Nutrition Examination Survey (2016)
Hyun Young Koo, Eun Kyung Lee
Child Health Nursing Research.2019; 25(1): 28. CrossRef - Effects of interaction betweenSLC12A3polymorphism, salt-sensitive gene, and sodium intake on risk of child obesity
Joohyun Jung, Myoungsook Lee
Journal of Nutrition and Health.2017; 50(1): 32. CrossRef - Evaluation of Eating Behavior and Nutritional Status Using the Nutrition Quotient in Obese Children
Hee-Sook Lim, Soon-Kyung Kim, Yoon-Hyung Park, Young-Lim Shin
The Korean Journal of Obesity.2016; 25(4): 225. CrossRef
 Cite
CiteThe Relationship among Insulin Resistance, Blood Profiles and Nutrient Intake in Overweight or Obese Children and Adolescents
The Relationship among Insulin Resistance, Blood Profiles and Nutrient Intake in Overweight or Obese Children and Adolescents
Gender distribution of subjects by school and obese group (N = 137)
1) N (%)
2) NS: No Significant
3) MS: Metabolic Syndrome
Significant difference at ***: p < 0.001
Distribution of risk factors of MS by obese group in total subjects (N = 137)
1) N (%)
Significant difference at **: p < 0.01
Distribution of risk factors of MS in total subjects (N = 137)
1) N (%)
Significant difference at *: p < 0.05
Anthropometric measurements of subjects by obese groups (N = 137)
1) Mean ± SD
2) [Body weight (kg) / Standard weight (kg)] × 100
3) Body fat (%) measured by Inbody 720
4) Muscle mass (kg) calculated by Heymsfield's formular
5) Body muscle (%) = [Muscle (kg) / body weight (kg)] * 100
abc means significant difference (p < 0.05) among groups by Duncan's multiple range test
All data are same after controlling for age using ANCOVA among groups
Biochemistry characteristics of subjects by obese group (N = 137)
1) Mean ± SD
abc means significant difference at p < 0.05 among groups by Duncan's multiple range test
All data are same after controlling for age using ANCOVA among groups
Pearson's correlation coefficient of HOMA-IR with anthropometric and biochemical variables of blood in subjects
1) % IBW = [body weight (kg) / standard weight (cm)] × 100
2) Body fat (%) = measured by inbody 720
3) Muscle mass (kg) was calculated by Heymsfield's formular
Significant difference at ***: p < 0.001
Comparison of daily nutrient intakes in normal weight, obese without MS and obese with MS groups
1) Mean ± SD
abc means significant difference at p < 0.05 among groups by Duncan's multiple range test
Comparison of nutrient adequacy ratio(NAR) and mean adequacy ratio (MAR)
1) Mean ± SD
No significant difference except Vit E among obese groups by Duncan's multiple range test
Correlation of insulin resistance HOMA-IR with nutrients intake
Significantly correlated at *: p < 0.05
Table 1
Gender distribution of subjects by school and obese group (N = 137)
1) N (%) 2) NS: No Significant 3) MS: Metabolic Syndrome Significant difference at ***: p < 0.001
Table 2
Distribution of risk factors of MS by obese group in total subjects (N = 137)
1) N (%) Significant difference at **: p < 0.01
Table 3
Distribution of risk factors of MS in total subjects (N = 137)
1) N (%) Significant difference at *: p < 0.05
Table 4
Anthropometric measurements of subjects by obese groups (N = 137)
1) Mean ± SD 2) [Body weight (kg) / Standard weight (kg)] × 100 3) Body fat (%) measured by Inbody 720 4) Muscle mass (kg) calculated by Heymsfield's formular 5) Body muscle (%) = [Muscle (kg) / body weight (kg)] * 100 abc means significant difference (p < 0.05) among groups by Duncan's multiple range test All data are same after controlling for age using ANCOVA among groups
Table 5
Biochemistry characteristics of subjects by obese group (N = 137)
1) Mean ± SD abc means significant difference at p < 0.05 among groups by Duncan's multiple range test All data are same after controlling for age using ANCOVA among groups
Table 6
Pearson's correlation coefficient of HOMA-IR with anthropometric and biochemical variables of blood in subjects
1) % IBW = [body weight (kg) / standard weight (cm)] × 100 2) Body fat (%) = measured by inbody 720 3) Muscle mass (kg) was calculated by Heymsfield's formular Significant difference at ***: p < 0.001
Table 7
Comparison of daily nutrient intakes in normal weight, obese without MS and obese with MS groups
1) Mean ± SD abc means significant difference at p < 0.05 among groups by Duncan's multiple range test
Table 8
Comparison of nutrient adequacy ratio(NAR) and mean adequacy ratio (MAR)
1) Mean ± SD No significant difference except Vit E among obese groups by Duncan's multiple range test
Table 9
Correlation of insulin resistance HOMA-IR with nutrients intake
Significantly correlated at *: p < 0.05


